***Last / Change / Volume data in this table is the closing quote data***
Symbol/Exchange
Company Name
Industry Group |
PRICE |
CHANGE
(%Change) |
Day High |
Volume
(% DAV)
(% 50 day avg vol) |
52 Wk Hi
% From Hi |
Featured
Date |
Price
Featured |
Pivot Featured |
|
Max Buy |
BITA
-
NYSE
Bitauto Hldgs Ltd Ads
INTERNET - Internet Information Providers
|
$15.87
|
-0.59
-3.58% |
$16.15
|
1,435,416
467.71% of 50 DAV
50 DAV is 306,900
|
$18.10
-12.32%
|
8/7/2013
|
$12.01
|
PP = $13.30
|
|
MB = $13.97
|
 Most Recent Note - 9/12/2013 4:02:47 PM
G - Gapped down today, retreating with heavy volume following a best-ever close on the prior session. During its choppy consolidation it found support above its 50 DMA line and prior highs.
>>> The latest Featured Stock Update with an annotated graph appeared on 9/3/2013. Click here.
View all notes |
Alert me of new notes |
CANSLIM.net Company Profile |
SEC |
Zacks Reports |
StockTalk |
News |
Chart |
Request a new note
C
A N
S L
I M


|
CELG
-
NASDAQ
Celgene Corp
DRUGS - Drug Manufacturers - Major
|
$149.64
|
+0.08
0.05% |
$150.93
|
1,698,126
69.19% of 50 DAV
50 DAV is 2,454,400
|
$151.00
-0.90%
|
9/12/2013
|
$149.50
|
PP = $150.02
|
|
MB = $157.52
|
Most Recent Note - 9/12/2013 4:08:38 PM
Y - Wedging into new high territory this week with a streak of gains lacking volume conviction. New pivot point is cited based on its 8/01/13 high plus 10 cents, and subsequent volume-driven gains may trigger a new (or add-on) technical buy signal. It formed a base-on-base type pattern. Its 50 DMA line defines important chart support.
>>> The latest Featured Stock Update with an annotated graph appeared on 8/21/2013. Click here.
View all notes |
Alert me of new notes |
CANSLIM.net Company Profile |
SEC |
Zacks Reports |
StockTalk |
News |
Chart |
Request a new note
C
A N
S L
I M
|
FLT
-
NYSE
Fleetcor Technologies
DIVERSIFIED SERVICES - Business/Management Services
|
$107.24
|
-0.17
-0.16% |
$108.61
|
747,949
123.08% of 50 DAV
50 DAV is 607,700
|
$110.42
-2.88%
|
8/19/2013
|
$99.01
|
PP = $100.97
|
|
MB = $106.02
|
Most Recent Note - 9/12/2013 12:33:46 PM
G - Blasted beyond its "max buy" level to new highs after pricing a 2.75M share Secondary Offering at $105.25. FLT has traded up as much as +55% since first featured in yellow in the mid-day report on 3/21/13 (read here)
>>> The latest Featured Stock Update with an annotated graph appeared on 9/6/2013. Click here.
View all notes |
Alert me of new notes |
CANSLIM.net Company Profile |
SEC |
Zacks Reports |
StockTalk |
News |
Chart |
Request a new note
C
A N
S L
I M
|
GNRC
-
NYSE
Generac Hldgs Inc
CONSUMER DURABLES - Electronic Equipment
|
$41.40
|
+0.63
1.55% |
$41.64
|
734,784
86.41% of 50 DAV
50 DAV is 850,300
|
$44.30
-6.55%
|
9/12/2013
|
$41.40
|
PP = $43.27
|
|
MB = $45.43
|
Most Recent Note - 9/12/2013 5:47:27 PM
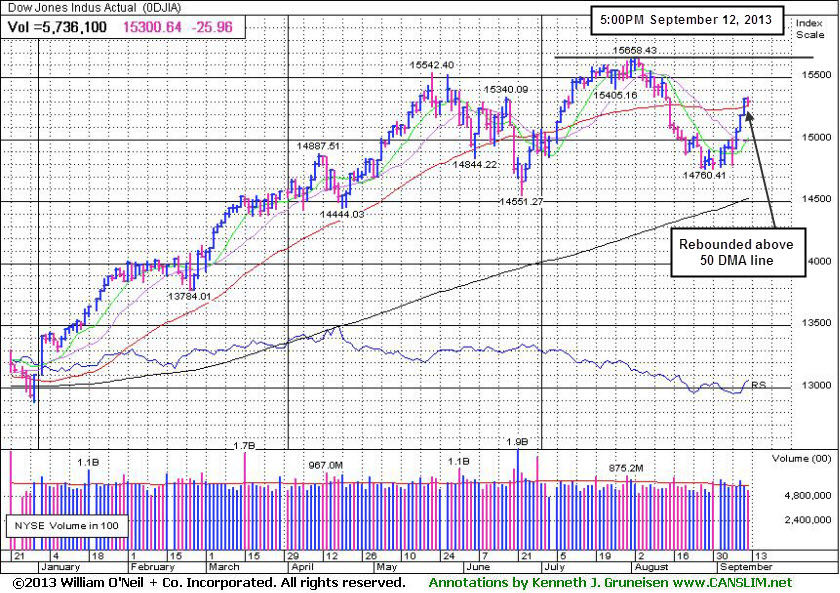
Y - Rebounded above its 50 DMA line, its color code is changed to yellow while building on a new base with pivot point based on its 8/14/13 high. Subsequent volume-driven gains may trigger a new technical buy signal.
>>> The latest Featured Stock Update with an annotated graph appeared on 8/22/2013. Click here.
View all notes |
Alert me of new notes |
CANSLIM.net Company Profile |
SEC |
Zacks Reports |
StockTalk |
News |
Chart |
Request a new note
C
A N
S L
I M
|
KORS
-
NYSE
Michael Kors Hldgs Ltd
RETAIL - Apparel Stores
|
$73.32
|
-1.26
-1.69% |
$74.78
|
2,722,722
77.28% of 50 DAV
50 DAV is 3,523,000
|
$76.74
-4.46%
|
8/6/2013
|
$69.66
|
PP = $66.28
|
|
MB = $69.59
|
Most Recent Note - 9/10/2013 7:39:15 PM
G - Retreated from its high with above average volume behind today's big loss and it finished near the session low. Its 50 DMA line defines support above prior highs in the $66 area.
>>> The latest Featured Stock Update with an annotated graph appeared on 8/29/2013. Click here.
View all notes |
Alert me of new notes |
CANSLIM.net Company Profile |
SEC |
Zacks Reports |
StockTalk |
News |
Chart |
Request a new note
C
A N
S L
I M
|
Symbol/Exchange
Company Name
Industry Group |
PRICE |
CHANGE
(%Change) |
Day High |
Volume
(% DAV)
(% 50 day avg vol) |
52 Wk Hi
% From Hi |
Featured
Date |
Price
Featured |
Pivot Featured |
|
Max Buy |
LOPE
-
NASDAQ
Grand Canyon Education
DIVERSIFIED SERVICES - Education and; Training Services
|
$36.55
|
+0.10
0.27% |
$36.98
|
269,470
65.36% of 50 DAV
50 DAV is 412,300
|
$37.19
-1.72%
|
6/19/2013
|
$31.47
|
PP = $34.17
|
|
MB = $35.88
|
Most Recent Note - 9/12/2013 5:40:47 PM
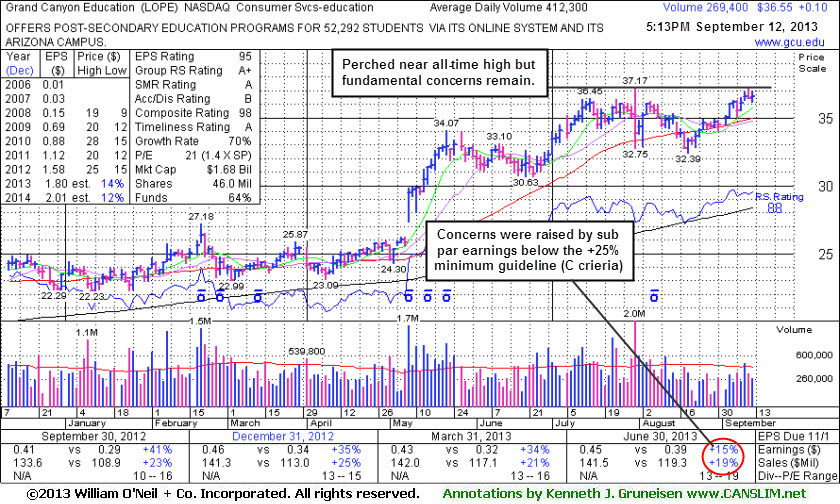
G - Perched near its all-time high but fundamental concerns remain while technical action has been reassuring. See latest FSU analysis for more details and a new annotated graph.
>>> The latest Featured Stock Update with an annotated graph appeared on 9/12/2013. Click here.
View all notes |
Alert me of new notes |
CANSLIM.net Company Profile |
SEC |
Zacks Reports |
StockTalk |
News |
Chart |
Request a new note
C
A N
S L
I M
|
MRLN
-
NASDAQ
Marlin Business Services
DIVERSIFIED SERVICES - Rental and Leasing Services
|
$24.99
|
+0.16
0.64% |
$25.47
|
63,317
203.59% of 50 DAV
50 DAV is 31,100
|
$26.96
-7.31%
|
9/9/2013
|
$25.75
|
PP = $26.07
|
|
MB = $27.37
|
Most Recent Note - 9/12/2013 12:52:07 PM
Y - Trading at a new 52-week high today. The company announced plans to pay a Special Dividend to shareholders of record 9/16/13. Held its ground stubbornly and rose since a volume-driven breakout gain on 9/05/13. See the latest FSU analysis for more details and an annotated weekly graph.
>>> The latest Featured Stock Update with an annotated graph appeared on 9/9/2013. Click here.
View all notes |
Alert me of new notes |
CANSLIM.net Company Profile |
SEC |
Zacks Reports |
StockTalk |
News |
Chart |
Request a new note
C
A N
S L
I M
|
PCLN
-
NASDAQ
Priceline.Com Inc
INTERNET - Internet Software and Services
|
$969.79
|
-11.77
-1.20% |
$982.13
|
310,920
48.60% of 50 DAV
50 DAV is 639,800
|
$994.98
-2.53%
|
7/8/2013
|
$878.28
|
PP = $847.43
|
|
MB = $889.80
|
Most Recent Note - 9/6/2013 6:15:20 PM
G - Consolidating in an orderly fashion above prior highs, building a new base. Reported earnings +24% on +27% sales revenues for the Jun '13 quarter, just under the +25% minimum earnings guideline (C criteria).
>>> The latest Featured Stock Update with an annotated graph appeared on 8/19/2013. Click here.
View all notes |
Alert me of new notes |
CANSLIM.net Company Profile |
SEC |
Zacks Reports |
StockTalk |
News |
Chart |
Request a new note
C
A N
S L
I M
|
PRAA
-
NASDAQ
Portfolio Recovery Assoc
DIVERSIFIED SERVICES - Business/Management Services
|
$58.47
|
-0.31
-0.53% |
$59.20
|
253,277
46.24% of 50 DAV
50 DAV is 547,700
|
$59.45
-1.64%
|
7/31/2013
|
$51.43
|
PP = $54.72
|
|
MB = $57.46
|
Most Recent Note - 9/10/2013 7:33:47 PM
G - Hit a new 52-week high and rallied above its "max buy" level with today's 6th consecutive gain and its color code is changed to green. Found support above its 50 DMA line during the latest consolidation.
>>> The latest Featured Stock Update with an annotated graph appeared on 8/28/2013. Click here.
View all notes |
Alert me of new notes |
CANSLIM.net Company Profile |
SEC |
Zacks Reports |
StockTalk |
News |
Chart |
Request a new note
C
A N
S L
I M
|
PRLB
-
NYSE
Proto Labs Inc
MANUFACTURING - Small Tools and Accessories
|
$73.19
|
-1.74
-2.32% |
$75.69
|
347,754
86.42% of 50 DAV
50 DAV is 402,400
|
$76.73
-4.61%
|
7/29/2013
|
$64.86
|
PP = $67.50
|
|
MB = $70.88
|
Most Recent Note - 9/12/2013 4:10:51 PM
G - Quietly hovering near its all-time high after rallying beyond its "max buy" level. Support to watch is at prior highs and above its 50 DMA line coinciding in the $67 area.
>>> The latest Featured Stock Update with an annotated graph appeared on 8/27/2013. Click here.
View all notes |
Alert me of new notes |
CANSLIM.net Company Profile |
SEC |
Zacks Reports |
StockTalk |
News |
Chart |
Request a new note
C
A N
S L
I M
|
Symbol/Exchange
Company Name
Industry Group |
PRICE |
CHANGE
(%Change) |
Day High |
Volume
(% DAV)
(% 50 day avg vol) |
52 Wk Hi
% From Hi |
Featured
Date |
Price
Featured |
Pivot Featured |
|
Max Buy |
QCOR
-
NASDAQ
Questcor Pharmaceuticals
DRUGS - Biotechnology
|
$63.84
|
-0.14
-0.22% |
$65.21
|
1,053,365
62.96% of 50 DAV
50 DAV is 1,673,200
|
$74.76
-14.61%
|
7/31/2013
|
$66.46
|
PP = $59.01
|
|
MB = $61.96
|
Most Recent Note - 9/11/2013 8:28:42 PM
G - Loss today with above average volume tested near its 50 DMA line, yet it found prompt support and ended the session near recent lows in the $64 area.
>>> The latest Featured Stock Update with an annotated graph appeared on 8/26/2013. Click here.
View all notes |
Alert me of new notes |
CANSLIM.net Company Profile |
SEC |
Zacks Reports |
StockTalk |
News |
Chart |
Request a new note
C
A N
S L
I M
|
SFUN
-
NYSE
Soufun Hldgs Ltd Ads A
INTERNET - Internet Information Providers
|
$47.35
|
-3.24
-6.40% |
$50.70
|
1,545,983
202.57% of 50 DAV
50 DAV is 763,200
|
$53.77
-11.94%
|
7/16/2013
|
$29.54
|
PP = $27.90
|
|
MB = $29.30
|
Most Recent Note - 9/12/2013 3:58:49 PM
G - Retreating from all-time highs with above average volume behind today's 2nd consecutive loss. It is still very extended from any sound base. Recent highs near $42 define initial support to watch on pullbacks.
>>> The latest Featured Stock Update with an annotated graph appeared on 8/30/2013. Click here.
View all notes |
Alert me of new notes |
CANSLIM.net Company Profile |
SEC |
Zacks Reports |
StockTalk |
News |
Chart |
Request a new note
C
A N
S L
I M
|
SSNC
-
NASDAQ
S S & C Technologies
COMPUTER SOFTWARE and SERVICES - Application Software
|
$37.71
|
+0.28
0.75% |
$38.02
|
292,682
82.96% of 50 DAV
50 DAV is 352,800
|
$38.80
-2.81%
|
9/5/2013
|
$36.01
|
PP = $38.90
|
|
MB = $40.85
|
Most Recent Note - 9/10/2013 7:35:28 PM
Y - Rallied for a solid gain with 2 times average volume today while approaching a new pivot point cited based on its 8/02/13 high plus 10 cents. Subsequent volume-driven gains may trigger a new buy signal.
>>> The latest Featured Stock Update with an annotated graph appeared on 9/5/2013. Click here.
View all notes |
Alert me of new notes |
CANSLIM.net Company Profile |
SEC |
Zacks Reports |
StockTalk |
News |
Chart |
Request a new note
C
A N
S L
I M
|
SSYS
-
NASDAQ
Stratasys Ltd
COMPUTER HARDWARE - Computer Peripherals
|
$97.79
|
-5.20
-5.05% |
$103.00
|
1,672,309
192.66% of 50 DAV
50 DAV is 868,000
|
$113.49
-13.83%
|
7/8/2013
|
$91.44
|
PP = $95.00
|
|
MB = $99.75
|
Most Recent Note - 9/12/2013 3:55:01 PM
Y - Color code is changed to yellow while slumping below its "max buy" level, sinking near its 50 DMA line and prior highs with above average volume behind today's 7th consecutive loss. Proposed a new Public Offering on 9/09/13 perched near all-time highs.
>>> The latest Featured Stock Update with an annotated graph appeared on 9/10/2013. Click here.
View all notes |
Alert me of new notes |
CANSLIM.net Company Profile |
SEC |
Zacks Reports |
StockTalk |
News |
Chart |
Request a new note
C
A N
S L
I M
|
STMP
-
NASDAQ
Stamps.Com Inc
INTERNET - Internet Software and Services
|
$43.10
|
-0.39
-0.90% |
$43.85
|
91,806
70.89% of 50 DAV
50 DAV is 129,500
|
$46.47
-7.25%
|
7/31/2013
|
$40.00
|
PP = $42.98
|
|
MB = $45.13
|
Most Recent Note - 9/12/2013 3:56:42 PM
Y - Holding its ground stubbornly with volume totals cooling after 7 consecutive gains to a best-ever close. Recently found encouraging support at its 50 DMA line.
>>> The latest Featured Stock Update with an annotated graph appeared on 8/23/2013. Click here.
View all notes |
Alert me of new notes |
CANSLIM.net Company Profile |
SEC |
Zacks Reports |
StockTalk |
News |
Chart |
Request a new note
C
A N
S L
I M
|
Symbol/Exchange
Company Name
Industry Group |
PRICE |
CHANGE
(%Change) |
Day High |
Volume
(% DAV)
(% 50 day avg vol) |
52 Wk Hi
% From Hi |
Featured
Date |
Price
Featured |
Pivot Featured |
|
Max Buy |
TBBK
-
NASDAQ
Bancorp Inc
BANKING - Regional - Mid-Atlantic Banks
|
$17.84
|
-0.29
-1.60% |
$18.19
|
244,781
153.37% of 50 DAV
50 DAV is 159,600
|
$18.38
-2.94%
|
9/4/2013
|
$16.26
|
PP = $16.79
|
|
MB = $17.63
|
Most Recent Note - 9/12/2013 1:03:15 PM
G - Perched at its 52-week high today following a streak of 10 consecutive gains, extended from its prior base. Prior highs define important near-term support to watch near $16 on pullbacks. Rallied +12% higher since highlighted on 9/04/13 under the headline, "Forming Sound Set-Up While "M" Correction Remains Overriding Concern".
>>> The latest Featured Stock Update with an annotated graph appeared on 9/4/2013. Click here.
View all notes |
Alert me of new notes |
CANSLIM.net Company Profile |
SEC |
Zacks Reports |
StockTalk |
News |
Chart |
Request a new note
C
A N
S L
I M
|
TNGO
-
NASDAQ
Tangoe Inc
COMPUTER SOFTWARE and SERVICES - Technical and System Software
|
$23.15
|
-0.01
-0.04% |
$23.64
|
957,950
205.22% of 50 DAV
50 DAV is 466,800
|
$23.72
-2.40%
|
9/12/2013
|
$21.30
|
PP = $23.15
|
|
MB = $24.31
|
Most Recent Note - 9/12/2013 1:34:42 PM
Y - Color code is changed to yellow with pivot point cited based on its May 2012 high plus 10 cents. Hovering at its 52-week high after recently topping its 2012 high with a recent spurt of gains backed by above average volume, and it is on track for its 16th weekly gain in the span of 18 weeks. Prior mid-day report repeatedly noted - "Fundamentals remain strong with great earnings increases through the Jun '13 quarter. Rebounded and rallied impressively following a deep consolidation below its 200 DMA line since dropped from the Featured Stocks list on 8/28/12." 
>>> The latest Featured Stock Update with an annotated graph appeared on 8/24/2012. Click here.
View all notes |
Alert me of new notes |
CANSLIM.net Company Profile |
SEC |
Zacks Reports |
StockTalk |
News |
Chart |
Request a new note
C
A N
S L
I M
|
VRX
-
NYSE
Valeant Pharmaceuticals
DRUGS - Drug Manufacturers - Other
|
$99.57
|
-0.69
-0.69% |
$100.82
|
610,388
49.99% of 50 DAV
50 DAV is 1,221,100
|
$105.40
-5.53%
|
9/11/2013
|
$100.26
|
PP = $105.50
|
|
MB = $110.78
|
Most Recent Note - 9/11/2013 8:19:59 PM
Y- Color code is changed to yellow with new pivot point cited based on its 8/14/13 high plus 10 cents. Recent insider buying while trading near its highs has been noted as an encouraging sign. See the latest FSU analysis for more details and a new annotated graph.
>>> The latest Featured Stock Update with an annotated graph appeared on 9/11/2013. Click here.
View all notes |
Alert me of new notes |
CANSLIM.net Company Profile |
SEC |
Zacks Reports |
StockTalk |
News |
Chart |
Request a new note
C
A N
S L
I M
|
YNDX
-
NASDAQ
Yandex N V Class A
INTERNET - Internet Information Providers
|
$34.40
|
-0.10
-0.29% |
$34.64
|
1,780,811
72.70% of 50 DAV
50 DAV is 2,449,700
|
$35.88
-4.12%
|
9/5/2013
|
$34.24
|
PP = $34.79
|
|
MB = $36.53
|
Most Recent Note - 9/9/2013 5:48:44 PM
Y - Rallied to a best-ever close and a new 52-week high with today's gain lacking great volume conviction. Found support at its 50 DMA line, important near-term support to watch. It did not form a base of sufficient length, however its color code was changed to yellow while a valid secondary buy point exists up to +5% above its prior high.
>>> The latest Featured Stock Update with an annotated graph appeared on 8/20/2013. Click here.
View all notes |
Alert me of new notes |
CANSLIM.net Company Profile |
SEC |
Zacks Reports |
StockTalk |
News |
Chart |
Request a new note
C
A N
S L
I M
|