***Last / Change / Volume data in this table is the closing quote data***
Symbol/Exchange
Company Name
Industry Group |
PRICE |
CHANGE
(%Change) |
Day High |
Volume
(% DAV)
(% 50 day avg vol) |
52 Wk Hi
% From Hi |
Featured
Date |
Price
Featured |
Pivot Featured |
|
Max Buy |
AVG
-
NYSE
A V G Technologies N.V.
INTERNET - Internet Software and Services
|
$23.25
|
+0.33
1.44% |
$23.28
|
1,392,876
187.87% of 50 DAV
50 DAV is 741,400
|
$23.78
-2.23%
|
9/13/2013
|
$23.06
|
PP = $23.88
|
|
MB = $25.07
|
 Most Recent Note - 9/13/2013 8:23:51 AM
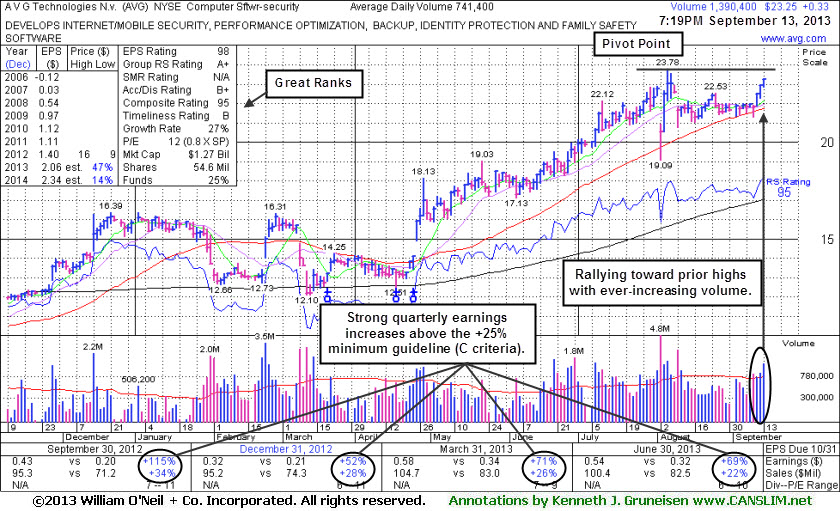
Y - Finished strong after highlighted in yellow with pivot point based on its 8/06/13 high plus 10 cents in the earlier mid-day report (read here), rallying to a best-ever close with +87% above average volume behind today's 3rd consecutive gain. It is approaching its 52-week high on the right side of a 6-week flat base above its 50 DMA line. Showed strong sales revenues growth with earnings increases well above the +25% minimum guideline (C criteria) in the 4 latest quarterly comparisons through Jun '13. Earnings in FY '11 were flat versus the prior year. See the latest FSU analysis for more details and a new annotated graph.
>>> The latest Featured Stock Update with an annotated graph appeared on 9/13/2013. Click here.
View all notes |
Alert me of new notes |
CANSLIM.net Company Profile |
SEC |
Zacks Reports |
StockTalk |
News |
Chart |
Request a new note
C
A N
S L
I M


|
BITA
-
NYSE
Bitauto Hldgs Ltd Ads
INTERNET - Internet Information Providers
|
$15.74
|
-0.13
-0.82% |
$16.20
|
443,794
132.59% of 50 DAV
50 DAV is 334,700
|
$18.10
-13.04%
|
8/7/2013
|
$12.01
|
PP = $13.30
|
|
MB = $13.97
|
Most Recent Note - 9/12/2013 4:02:47 PM
G - Gapped down today, retreating with heavy volume following a best-ever close on the prior session. During its choppy consolidation it found support above its 50 DMA line and prior highs.
>>> The latest Featured Stock Update with an annotated graph appeared on 9/3/2013. Click here.
View all notes |
Alert me of new notes |
CANSLIM.net Company Profile |
SEC |
Zacks Reports |
StockTalk |
News |
Chart |
Request a new note
C
A N
S L
I M
|
CELG
-
NASDAQ
Celgene Corp
DRUGS - Drug Manufacturers - Major
|
$149.48
|
-0.16
-0.11% |
$149.75
|
1,486,049
60.88% of 50 DAV
50 DAV is 2,440,900
|
$151.00
-1.01%
|
9/12/2013
|
$149.50
|
PP = $150.02
|
|
MB = $157.52
|
Most Recent Note - 9/12/2013 4:08:38 PM
Y - Wedging into new high territory this week with a streak of gains lacking volume conviction. New pivot point is cited based on its 8/01/13 high plus 10 cents, and subsequent volume-driven gains may trigger a new (or add-on) technical buy signal. It formed a base-on-base type pattern. Its 50 DMA line defines important chart support.
>>> The latest Featured Stock Update with an annotated graph appeared on 8/21/2013. Click here.
View all notes |
Alert me of new notes |
CANSLIM.net Company Profile |
SEC |
Zacks Reports |
StockTalk |
News |
Chart |
Request a new note
C
A N
S L
I M
|
FLT
-
NYSE
Fleetcor Technologies
DIVERSIFIED SERVICES - Business/Management Services
|
$107.23
|
-0.01
-0.01% |
$107.72
|
496,622
81.21% of 50 DAV
50 DAV is 611,500
|
$110.42
-2.89%
|
8/19/2013
|
$99.01
|
PP = $100.97
|
|
MB = $106.02
|
Most Recent Note - 9/12/2013 12:33:46 PM
G - Blasted beyond its "max buy" level to new highs after pricing a 2.75M share Secondary Offering at $105.25. FLT has traded up as much as +55% since first featured in yellow in the mid-day report on 3/21/13 (read here)
>>> The latest Featured Stock Update with an annotated graph appeared on 9/6/2013. Click here.
View all notes |
Alert me of new notes |
CANSLIM.net Company Profile |
SEC |
Zacks Reports |
StockTalk |
News |
Chart |
Request a new note
C
A N
S L
I M
|
GNRC
-
NYSE
Generac Hldgs Inc
CONSUMER DURABLES - Electronic Equipment
|
$41.65
|
+0.25
0.60% |
$41.78
|
454,804
54.16% of 50 DAV
50 DAV is 839,700
|
$44.30
-5.98%
|
9/12/2013
|
$41.40
|
PP = $43.27
|
|
MB = $45.43
|
Most Recent Note - 9/12/2013 5:47:27 PM
Y - Rebounded above its 50 DMA line, its color code is changed to yellow while building on a new base with pivot point based on its 8/14/13 high. Subsequent volume-driven gains may trigger a new technical buy signal.
>>> The latest Featured Stock Update with an annotated graph appeared on 8/22/2013. Click here.
View all notes |
Alert me of new notes |
CANSLIM.net Company Profile |
SEC |
Zacks Reports |
StockTalk |
News |
Chart |
Request a new note
C
A N
S L
I M
|
Symbol/Exchange
Company Name
Industry Group |
PRICE |
CHANGE
(%Change) |
Day High |
Volume
(% DAV)
(% 50 day avg vol) |
52 Wk Hi
% From Hi |
Featured
Date |
Price
Featured |
Pivot Featured |
|
Max Buy |
KORS
-
NYSE
Michael Kors Hldgs Ltd
RETAIL - Apparel Stores
|
$74.03
|
+0.71
0.97% |
$74.95
|
2,361,946
66.85% of 50 DAV
50 DAV is 3,533,400
|
$76.74
-3.53%
|
8/6/2013
|
$69.66
|
PP = $66.28
|
|
MB = $69.59
|
Most Recent Note - 9/10/2013 7:39:15 PM
G - Retreated from its high with above average volume behind today's big loss and it finished near the session low. Its 50 DMA line defines support above prior highs in the $66 area.
>>> The latest Featured Stock Update with an annotated graph appeared on 8/29/2013. Click here.
View all notes |
Alert me of new notes |
CANSLIM.net Company Profile |
SEC |
Zacks Reports |
StockTalk |
News |
Chart |
Request a new note
C
A N
S L
I M
|
LOPE
-
NASDAQ
Grand Canyon Education
DIVERSIFIED SERVICES - Education and; Training Services
|
$36.48
|
-0.07
-0.19% |
$36.94
|
208,267
50.87% of 50 DAV
50 DAV is 409,400
|
$37.19
-1.91%
|
6/19/2013
|
$31.47
|
PP = $34.17
|
|
MB = $35.88
|
Most Recent Note - 9/12/2013 5:40:47 PM
G - Perched near its all-time high but fundamental concerns remain while technical action has been reassuring. See latest FSU analysis for more details and a new annotated graph.
>>> The latest Featured Stock Update with an annotated graph appeared on 9/12/2013. Click here.
View all notes |
Alert me of new notes |
CANSLIM.net Company Profile |
SEC |
Zacks Reports |
StockTalk |
News |
Chart |
Request a new note
C
A N
S L
I M
|
MRLN
-
NASDAQ
Marlin Business Services
DIVERSIFIED SERVICES - Rental and Leasing Services
|
$25.24
|
+0.25
1.00% |
$25.54
|
25,767
69.64% of 50 DAV
50 DAV is 37,000
|
$26.96
-6.38%
|
9/9/2013
|
$25.75
|
PP = $26.07
|
|
MB = $27.37
|
Most Recent Note - 9/12/2013 12:52:07 PM
Y - Trading at a new 52-week high today. The company announced plans to pay a Special Dividend to shareholders of record 9/16/13. Held its ground stubbornly and rose since a volume-driven breakout gain on 9/05/13. See the latest FSU analysis for more details and an annotated weekly graph.
>>> The latest Featured Stock Update with an annotated graph appeared on 9/9/2013. Click here.
View all notes |
Alert me of new notes |
CANSLIM.net Company Profile |
SEC |
Zacks Reports |
StockTalk |
News |
Chart |
Request a new note
C
A N
S L
I M
|
PCLN
-
NASDAQ
Priceline.Com Inc
INTERNET - Internet Software and Services
|
$966.82
|
-2.97
-0.31% |
$971.70
|
552,739
86.79% of 50 DAV
50 DAV is 636,900
|
$994.98
-2.83%
|
9/13/2013
|
$966.82
|
PP = $995.08
|
|
MB = $1,044.83
|
Most Recent Note - 9/13/2013 8:30:57 AM
Y - Color code is changed to yellow with new pivot point cited based on its 8/09/13 high plus 10 cents. Consolidating in an orderly fashion above prior highs, still building a new flat base. Subsequent volume-driven gains may trigger a new (or add-on) technical buy signal.
>>> The latest Featured Stock Update with an annotated graph appeared on 8/19/2013. Click here.
View all notes |
Alert me of new notes |
CANSLIM.net Company Profile |
SEC |
Zacks Reports |
StockTalk |
News |
Chart |
Request a new note
C
A N
S L
I M
|
PRAA
-
NASDAQ
Portfolio Recovery Assoc
DIVERSIFIED SERVICES - Business/Management Services
|
$58.47
|
+0.00
0.00% |
$59.04
|
286,017
52.28% of 50 DAV
50 DAV is 547,100
|
$59.45
-1.64%
|
7/31/2013
|
$51.43
|
PP = $54.72
|
|
MB = $57.46
|
Most Recent Note - 9/10/2013 7:33:47 PM
G - Hit a new 52-week high and rallied above its "max buy" level with today's 6th consecutive gain and its color code is changed to green. Found support above its 50 DMA line during the latest consolidation.
>>> The latest Featured Stock Update with an annotated graph appeared on 8/28/2013. Click here.
View all notes |
Alert me of new notes |
CANSLIM.net Company Profile |
SEC |
Zacks Reports |
StockTalk |
News |
Chart |
Request a new note
C
A N
S L
I M
|
Symbol/Exchange
Company Name
Industry Group |
PRICE |
CHANGE
(%Change) |
Day High |
Volume
(% DAV)
(% 50 day avg vol) |
52 Wk Hi
% From Hi |
Featured
Date |
Price
Featured |
Pivot Featured |
|
Max Buy |
PRLB
-
NYSE
Proto Labs Inc
MANUFACTURING - Small Tools and Accessories
|
$72.26
|
-0.93
-1.27% |
$73.56
|
305,623
76.98% of 50 DAV
50 DAV is 397,000
|
$76.73
-5.83%
|
7/29/2013
|
$64.86
|
PP = $67.50
|
|
MB = $70.88
|
Most Recent Note - 9/12/2013 4:10:51 PM
G - Quietly hovering near its all-time high after rallying beyond its "max buy" level. Support to watch is at prior highs and above its 50 DMA line coinciding in the $67 area.
>>> The latest Featured Stock Update with an annotated graph appeared on 8/27/2013. Click here.
View all notes |
Alert me of new notes |
CANSLIM.net Company Profile |
SEC |
Zacks Reports |
StockTalk |
News |
Chart |
Request a new note
C
A N
S L
I M
|
QCOR
-
NASDAQ
Questcor Pharmaceuticals
DRUGS - Biotechnology
|
$63.07
|
-0.77
-1.21% |
$65.10
|
1,138,129
67.96% of 50 DAV
50 DAV is 1,674,600
|
$74.76
-15.64%
|
7/31/2013
|
$66.46
|
PP = $59.01
|
|
MB = $61.96
|
Most Recent Note - 9/11/2013 8:28:42 PM
G - Loss today with above average volume tested near its 50 DMA line, yet it found prompt support and ended the session near recent lows in the $64 area.
>>> The latest Featured Stock Update with an annotated graph appeared on 8/26/2013. Click here.
View all notes |
Alert me of new notes |
CANSLIM.net Company Profile |
SEC |
Zacks Reports |
StockTalk |
News |
Chart |
Request a new note
C
A N
S L
I M
|
SFUN
-
NYSE
Soufun Hldgs Ltd Ads A
INTERNET - Internet Information Providers
|
$45.41
|
-1.94
-4.10% |
$47.00
|
2,884,816
365.12% of 50 DAV
50 DAV is 790,100
|
$53.77
-15.55%
|
7/16/2013
|
$29.54
|
PP = $27.90
|
|
MB = $29.30
|
Most Recent Note - 9/12/2013 3:58:49 PM
G - Retreating from all-time highs with above average volume behind today's 2nd consecutive loss. It is still very extended from any sound base. Recent highs near $42 define initial support to watch on pullbacks.
>>> The latest Featured Stock Update with an annotated graph appeared on 8/30/2013. Click here.
View all notes |
Alert me of new notes |
CANSLIM.net Company Profile |
SEC |
Zacks Reports |
StockTalk |
News |
Chart |
Request a new note
C
A N
S L
I M
|
SSNC
-
NASDAQ
S S & C Technologies
COMPUTER SOFTWARE and SERVICES - Application Software
|
$37.72
|
+0.01
0.03% |
$37.94
|
349,922
99.55% of 50 DAV
50 DAV is 351,500
|
$38.80
-2.78%
|
9/5/2013
|
$36.01
|
PP = $38.90
|
|
MB = $40.85
|
Most Recent Note - 9/10/2013 7:35:28 PM
Y - Rallied for a solid gain with 2 times average volume today while approaching a new pivot point cited based on its 8/02/13 high plus 10 cents. Subsequent volume-driven gains may trigger a new buy signal.
>>> The latest Featured Stock Update with an annotated graph appeared on 9/5/2013. Click here.
View all notes |
Alert me of new notes |
CANSLIM.net Company Profile |
SEC |
Zacks Reports |
StockTalk |
News |
Chart |
Request a new note
C
A N
S L
I M
|
SSYS
-
NASDAQ
Stratasys Ltd
COMPUTER HARDWARE - Computer Peripherals
|
$92.32
|
-5.47
-5.59% |
$94.70
|
7,151,792
799.53% of 50 DAV
50 DAV is 894,500
|
$113.49
-18.65%
|
7/8/2013
|
$91.44
|
PP = $95.00
|
|
MB = $99.75
|
Most Recent Note - 9/12/2013 3:55:01 PM
Y - Color code is changed to yellow while slumping below its "max buy" level, sinking near its 50 DMA line and prior highs with above average volume behind today's 7th consecutive loss. Proposed a new Public Offering on 9/09/13 perched near all-time highs.
>>> The latest Featured Stock Update with an annotated graph appeared on 9/10/2013. Click here.
View all notes |
Alert me of new notes |
CANSLIM.net Company Profile |
SEC |
Zacks Reports |
StockTalk |
News |
Chart |
Request a new note
C
A N
S L
I M
|
Symbol/Exchange
Company Name
Industry Group |
PRICE |
CHANGE
(%Change) |
Day High |
Volume
(% DAV)
(% 50 day avg vol) |
52 Wk Hi
% From Hi |
Featured
Date |
Price
Featured |
Pivot Featured |
|
Max Buy |
STMP
-
NASDAQ
Stamps.Com Inc
INTERNET - Internet Software and Services
|
$43.61
|
+0.51
1.18% |
$43.78
|
50,789
39.10% of 50 DAV
50 DAV is 129,900
|
$46.47
-6.15%
|
7/31/2013
|
$40.00
|
PP = $42.98
|
|
MB = $45.13
|
Most Recent Note - 9/12/2013 3:56:42 PM
Y - Holding its ground stubbornly with volume totals cooling after 7 consecutive gains to a best-ever close. Recently found encouraging support at its 50 DMA line.
>>> The latest Featured Stock Update with an annotated graph appeared on 8/23/2013. Click here.
View all notes |
Alert me of new notes |
CANSLIM.net Company Profile |
SEC |
Zacks Reports |
StockTalk |
News |
Chart |
Request a new note
C
A N
S L
I M
|
TBBK
-
NASDAQ
Bancorp Inc
BANKING - Regional - Mid-Atlantic Banks
|
$17.86
|
+0.02
0.11% |
$17.95
|
309,425
196.59% of 50 DAV
50 DAV is 157,400
|
$18.38
-2.83%
|
9/4/2013
|
$16.26
|
PP = $16.79
|
|
MB = $17.63
|
Most Recent Note - 9/12/2013 1:03:15 PM
G - Perched at its 52-week high today following a streak of 10 consecutive gains, extended from its prior base. Prior highs define important near-term support to watch near $16 on pullbacks. Rallied +12% higher since highlighted on 9/04/13 under the headline, "Forming Sound Set-Up While "M" Correction Remains Overriding Concern".
>>> The latest Featured Stock Update with an annotated graph appeared on 9/4/2013. Click here.
View all notes |
Alert me of new notes |
CANSLIM.net Company Profile |
SEC |
Zacks Reports |
StockTalk |
News |
Chart |
Request a new note
C
A N
S L
I M
|
TNGO
-
NASDAQ
Tangoe Inc
COMPUTER SOFTWARE and SERVICES - Technical and System Software
|
$22.93
|
-0.22
-0.95% |
$23.25
|
1,225,605
256.24% of 50 DAV
50 DAV is 478,300
|
$23.72
-3.33%
|
9/12/2013
|
$21.30
|
PP = $23.15
|
|
MB = $24.31
|
Most Recent Note - 9/12/2013 1:34:42 PM
Y - Color code is changed to yellow with pivot point cited based on its May 2012 high plus 10 cents. Hovering at its 52-week high after recently topping its 2012 high with a recent spurt of gains backed by above average volume, and it is on track for its 16th weekly gain in the span of 18 weeks. Prior mid-day report repeatedly noted - "Fundamentals remain strong with great earnings increases through the Jun '13 quarter. Rebounded and rallied impressively following a deep consolidation below its 200 DMA line since dropped from the Featured Stocks list on 8/28/12." 
>>> The latest Featured Stock Update with an annotated graph appeared on 8/24/2012. Click here.
View all notes |
Alert me of new notes |
CANSLIM.net Company Profile |
SEC |
Zacks Reports |
StockTalk |
News |
Chart |
Request a new note
C
A N
S L
I M
|
VRX
-
NYSE
Valeant Pharmaceuticals
DRUGS - Drug Manufacturers - Other
|
$99.20
|
-0.37
-0.37% |
$99.86
|
832,508
70.33% of 50 DAV
50 DAV is 1,183,700
|
$105.40
-5.88%
|
9/11/2013
|
$100.26
|
PP = $105.50
|
|
MB = $110.78
|
Most Recent Note - 9/11/2013 8:19:59 PM
Y- Color code is changed to yellow with new pivot point cited based on its 8/14/13 high plus 10 cents. Recent insider buying while trading near its highs has been noted as an encouraging sign. See the latest FSU analysis for more details and a new annotated graph.
>>> The latest Featured Stock Update with an annotated graph appeared on 9/11/2013. Click here.
View all notes |
Alert me of new notes |
CANSLIM.net Company Profile |
SEC |
Zacks Reports |
StockTalk |
News |
Chart |
Request a new note
C
A N
S L
I M
|
YNDX
-
NASDAQ
Yandex N V Class A
INTERNET - Internet Information Providers
|
$34.38
|
-0.02
-0.06% |
$34.60
|
1,564,398
64.02% of 50 DAV
50 DAV is 2,443,600
|
$35.88
-4.18%
|
9/5/2013
|
$34.24
|
PP = $34.79
|
|
MB = $36.53
|
Most Recent Note - 9/13/2013 8:46:28 AM
Y - Tallied a 4th consecutive small loss today while holding its ground just -4.2% off its 52-week high.Found support at its 50 DMA line, important near-term support to watch. A valid secondary buy point exists up to +5% above its prior high.
>>> The latest Featured Stock Update with an annotated graph appeared on 8/20/2013. Click here.
View all notes |
Alert me of new notes |
CANSLIM.net Company Profile |
SEC |
Zacks Reports |
StockTalk |
News |
Chart |
Request a new note
C
A N
S L
I M
|
Symbol/Exchange
Company Name
Industry Group |
PRICE |
CHANGE
(%Change) |
Day High |
Volume
(% DAV)
(% 50 day avg vol) |
52 Wk Hi
% From Hi |
Featured
Date |
Price
Featured |
Pivot Featured |
|
Max Buy |