***Last / Change / Volume data in this table is the closing quote data***
Symbol/Exchange
Company Name
Industry Group |
PRICE |
CHANGE
(%Change) |
Day High |
Volume
(% DAV)
(% 50 day avg vol) |
52 Wk Hi
% From Hi |
Featured
Date |
Price
Featured |
Pivot Featured |
|
Max Buy |
ALXN
-
NASDAQ
Alexion Pharmaceuticals
DRUGS - Drug Manufacturers - Other
|
$109.06
|
-0.59
-0.54% |
$110.36
|
474,222
37.80% of 50 DAV
50 DAV is 1,254,500
|
$111.06
-1.80%
|
8/23/2012
|
$103.70
|
PP = $110.06
|
|
MB = $115.56
|
Most Recent Note - 9/10/2012 4:41:29 PM
Y - Volume totals have been below average while recently consolidating within close striking distance of its 52-week high. Subsequent volume-driven gains above its pivot point may trigger a new (or add-on) technical buy signal.
>>> The latest Featured Stock Update with an annotated graph appeared on 8/23/2012. Click here.
View all notes |
Alert me of new notes |
CANSLIM.net Company Profile |
SEC |
Zacks Reports |
StockTalk |
News |
Chart |
Request a new note
C
A N
S L
I M


|
ASPS
-
NASDAQ
Altisource Ptf Sltns Sa
REAL ESTATE - Property Management/Developmen
|
$89.45
|
+1.90
2.17% |
$90.83
|
119,888
93.15% of 50 DAV
50 DAV is 128,700
|
$92.29
-3.08%
|
6/5/2012
|
$60.01
|
PP = $63.00
|
|
MB = $66.15
|
Most Recent Note - 9/11/2012 6:05:23 PM
G - Perched -5.1% from its all-time high consolidating in a tight range. Recent lows define near-term support above its 50 DMA line. See the latest FSU analysis for more details and a new annotated graph.
>>> The latest Featured Stock Update with an annotated graph appeared on 9/11/2012. Click here.
View all notes |
Alert me of new notes |
CANSLIM.net Company Profile |
SEC |
Zacks Reports |
StockTalk |
News |
Chart |
Request a new note
C
A N
S L
I M
|
CFNL
-
NASDAQ
Cardinal Financial Corp
BANKING - Regional - Southeast Banks
|
$13.78
|
+0.09
0.66% |
$13.99
|
67,383
112.68% of 50 DAV
50 DAV is 59,800
|
$13.76
0.15%
|
8/17/2012
|
$12.84
|
PP = $13.31
|
|
MB = $13.98
|
Most Recent Note - 9/11/2012 6:06:50 PM
Y - Touched another new 52-week high today with a small gain on below average volume. Gains backed by at least +40% above average are the bare minimum required to trigger a proper technical buy signal. Its 50 DMA line defines important support.
>>> The latest Featured Stock Update with an annotated graph appeared on 8/21/2012. Click here.
View all notes |
Alert me of new notes |
CANSLIM.net Company Profile |
SEC |
Zacks Reports |
StockTalk |
News |
Chart |
Request a new note
C
A N
S L
I M
|
CMCSA
-
NASDAQ
Comcast Corp Cl A
MEDIA - CATV Systems
|
$34.59
|
+0.32
0.93% |
$34.65
|
13,217,159
107.41% of 50 DAV
50 DAV is 12,305,000
|
$35.16
-1.62%
|
6/11/2012
|
$29.94
|
PP = $30.98
|
|
MB = $32.53
|
 Most Recent Note - 9/12/2012 5:02:01 PM
G - Small gain today with higher volume, perched within close striking distance of its 52-week high. Stayed above its 50 DMA line while consolidating after fundamental concerns were raised by the Jun '12 quarter below the fact-based investment system's +25% minimum earnings guideline.
>>> The latest Featured Stock Update with an annotated graph appeared on 8/15/2012. Click here.
View all notes |
Alert me of new notes |
CANSLIM.net Company Profile |
SEC |
Zacks Reports |
StockTalk |
News |
Chart |
Request a new note
C
A N
S L
I M
|
DVA
-
NYSE
Davita Inc
HEALTH SERVICES - Specialized Health Services
|
$98.47
|
+0.87
0.89% |
$99.47
|
840,538
127.10% of 50 DAV
50 DAV is 661,300
|
$103.97
-5.29%
|
9/5/2012
|
$102.92
|
PP = $100.62
|
|
MB = $105.65
|
Most Recent Note - 9/12/2012 5:03:40 PM
Y - Today's gain helped it make a stand near its 50 DMA line and the color code is changed to yellow. A subsequent gain above its pivot point backed by +40% above average volume is the bare minimum volume needed to trigger a technical buy signal. Featured in the 9/05/12 mid-day report (read here) while hitting a new high with a considerable volume-driven gain.
>>> The latest Featured Stock Update with an annotated graph appeared on 9/5/2012. Click here.
View all notes |
Alert me of new notes |
CANSLIM.net Company Profile |
SEC |
Zacks Reports |
StockTalk |
News |
Chart |
Request a new note
C
A N
S L
I M
|
Symbol/Exchange
Company Name
Industry Group |
PRICE |
CHANGE
(%Change) |
Day High |
Volume
(% DAV)
(% 50 day avg vol) |
52 Wk Hi
% From Hi |
Featured
Date |
Price
Featured |
Pivot Featured |
|
Max Buy |
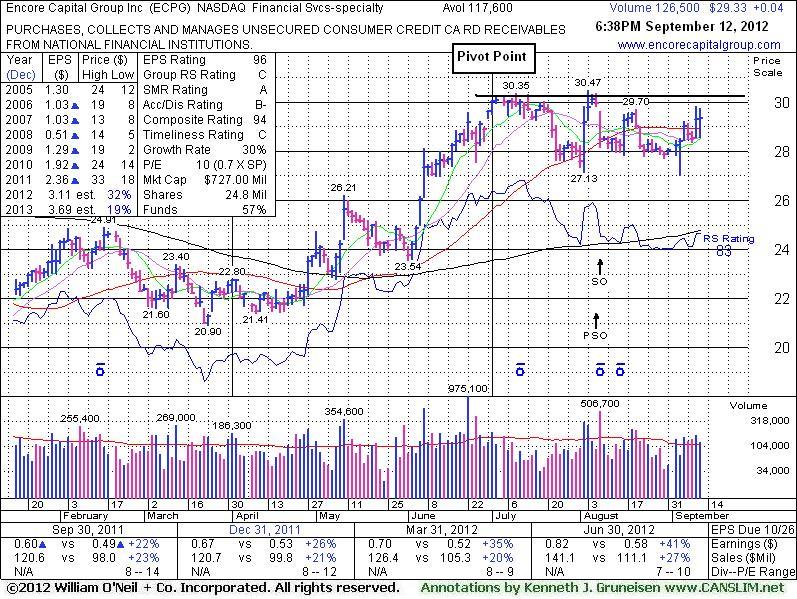
ECPG
-
NASDAQ
Encore Capital Group Inc
FINANCIAL SERVICES - Credit Services
|
$29.33
|
+0.04
0.14% |
$29.74
|
136,152
115.78% of 50 DAV
50 DAV is 117,600
|
$30.47
-3.74%
|
8/3/2012
|
$29.91
|
PP = $30.45
|
|
MB = $31.97
|
Most Recent Note - 9/12/2012 5:05:38 PM
Y - It rebounded above its 50 DMA line this week and finished -3.7% off its 52-week high today. Volume-driven gains to new highs would be a reassuring sign of accumulation hinting that it is capable of sustaining a meaningful rally. Completed a Secondary Offering on 8/08/12.
>>> The latest Featured Stock Update with an annotated graph appeared on 9/12/2012. Click here.
View all notes |
Alert me of new notes |
CANSLIM.net Company Profile |
SEC |
Zacks Reports |
StockTalk |
News |
Chart |
Request a new note
C
A N
S L
I M
|
EXPE
-
NASDAQ
Expedia Inc
INTERNET - Internet Information Providers
|
$54.22
|
+0.43
0.80% |
$55.06
|
2,731,969
81.73% of 50 DAV
50 DAV is 3,342,800
|
$59.50
-8.87%
|
4/27/2012
|
$41.80
|
PP = $35.57
|
|
MB = $37.35
|
Most Recent Note - 9/12/2012 5:07:04 PM
G - Posted its 6th small gain today in the span of 7 sessions. Consolidating above prior highs and its 50 DMA line defining important near-term chart support in the $50 area.
>>> The latest Featured Stock Update with an annotated graph appeared on 8/14/2012. Click here.
View all notes |
Alert me of new notes |
CANSLIM.net Company Profile |
SEC |
Zacks Reports |
StockTalk |
News |
Chart |
Request a new note
C
A N
S L
I M
|
GPX
-
NYSE
G P Strategies Corp
DIVERSIFIED SERVICES - Education and Training Services
|
$19.84
|
+0.04
0.20% |
$19.90
|
15,034
21.09% of 50 DAV
50 DAV is 71,300
|
$20.67
-4.02%
|
6/29/2012
|
$18.01
|
PP = $18.15
|
|
MB = $19.06
|
Most Recent Note - 9/11/2012 12:19:01 PM
G - Consolidating in a tight trading range perched -4.2% off its 52-week high today, slightly extended from its prior base. Prior highs and its 50 DMA line define chart support in the $18 area.
>>> The latest Featured Stock Update with an annotated graph appeared on 8/7/2012. Click here.
View all notes |
Alert me of new notes |
CANSLIM.net Company Profile |
SEC |
Zacks Reports |
StockTalk |
News |
Chart |
Request a new note
C
A N
S L
I M
|
HMSY
-
NASDAQ
H M S Holdings Corp
COMPUTER SOFTWARE and SERVICES - Healthcare Information Service
|
$33.00
|
-0.12
-0.36% |
$33.31
|
1,160,637
142.30% of 50 DAV
50 DAV is 815,600
|
$37.19
-11.27%
|
7/27/2012
|
$33.91
|
PP = $34.83
|
|
MB = $36.57
|
Most Recent Note - 9/10/2012 3:37:24 PM
G - Slumping just under its 50 DMA line with today's 4th consecutive loss and its color code is changed to green. A rally above last week's highs is needed to help its technical stance and outlook. Volume-driven gains into new high territory would be a reassuring sign disciplined investors may wait for as an indication of fresh institutional accumulation.
>>> The latest Featured Stock Update with an annotated graph appeared on 8/22/2012. Click here.
View all notes |
Alert me of new notes |
CANSLIM.net Company Profile |
SEC |
Zacks Reports |
StockTalk |
News |
Chart |
Request a new note
C
A N
S L
I M
|
KH
-
NYSE
China Kanghui Hldgs Ads
HEALTH SERVICES - Medical Appliances and Equipment
|
$25.05
|
+0.55
2.24% |
$25.05
|
25,154
94.92% of 50 DAV
50 DAV is 26,500
|
$27.47
-8.81%
|
8/30/2012
|
$24.19
|
PP = $22.90
|
|
MB = $24.05
|
Most Recent Note - 9/11/2012 1:44:53 PM
G - Above average volume is behind its 5th consecutive loss since a "negative reversal" on 9/05/12 at its all-time high. Prior highs in the $23 area define support to watch on pullbacks.
>>> The latest Featured Stock Update with an annotated graph appeared on 8/30/2012. Click here.
View all notes |
Alert me of new notes |
CANSLIM.net Company Profile |
SEC |
Zacks Reports |
StockTalk |
News |
Chart |
Request a new note
C
A N
S L
I M
|
Symbol/Exchange
Company Name
Industry Group |
PRICE |
CHANGE
(%Change) |
Day High |
Volume
(% DAV)
(% 50 day avg vol) |
52 Wk Hi
% From Hi |
Featured
Date |
Price
Featured |
Pivot Featured |
|
Max Buy |
LKQ
-
NASDAQ
L K Q Corp
WHOLESALE - Auto Parts
|
$39.36
|
+0.42
1.08% |
$39.50
|
600,444
95.35% of 50 DAV
50 DAV is 629,700
|
$40.03
-1.67%
|
8/9/2012
|
$37.93
|
PP = $37.44
|
|
MB = $39.31
|
Most Recent Note - 9/12/2012 4:45:20 PM
G - Color code is changed to green after quietly rising above its "max buy" level. Prior highs in the $37 area define initial support to watch above its 50 DMA line.
>>> The latest Featured Stock Update with an annotated graph appeared on 8/10/2012. Click here.
View all notes |
Alert me of new notes |
CANSLIM.net Company Profile |
SEC |
Zacks Reports |
StockTalk |
News |
Chart |
Request a new note
C
A N
S L
I M
|
LNKD
-
NYSE
Linkedin Corp Class A
INTERNET - Internet Information Providers
|
$119.55
|
+1.65
1.40% |
$120.14
|
1,246,685
49.50% of 50 DAV
50 DAV is 2,518,500
|
$122.85
-2.69%
|
9/5/2012
|
$113.25
|
PP = $113.10
|
|
MB = $118.76
|
Most Recent Note - 9/12/2012 4:48:01 PM
G - Holding its ground stubbornly with volume totals cooling while hovering at its 52-week high, indicating that few are headed for the exits. Prior highs near $113 define initial support to watch on pullbacks.
>>> The latest Featured Stock Update with an annotated graph appeared on 9/6/2012. Click here.
View all notes |
Alert me of new notes |
CANSLIM.net Company Profile |
SEC |
Zacks Reports |
StockTalk |
News |
Chart |
Request a new note
C
A N
S L
I M
|
MIDD
-
NASDAQ
Middleby Corp
MANUFACTURING - Diversified Machinery
|
$117.92
|
+0.57
0.49% |
$118.26
|
36,595
34.69% of 50 DAV
50 DAV is 105,500
|
$122.57
-3.79%
|
8/9/2012
|
$118.60
|
PP = $104.92
|
|
MB = $110.17
|
Most Recent Note - 9/12/2012 4:49:00 PM
G - Volume was light today while holding its ground near its 52-week high. Extended from its prior base, its 50 DMA line and prior highs define important chart support to watch.
>>> The latest Featured Stock Update with an annotated graph appeared on 8/13/2012. Click here.
View all notes |
Alert me of new notes |
CANSLIM.net Company Profile |
SEC |
Zacks Reports |
StockTalk |
News |
Chart |
Request a new note
C
A N
S L
I M
|
N
-
NYSE
Netsuite Inc
DIVERSIFIED SERVICES - Business/Management Services
|
$60.24
|
+2.75
4.78% |
$60.68
|
1,164,280
184.72% of 50 DAV
50 DAV is 630,300
|
$59.22
1.72%
|
8/20/2012
|
$55.88
|
PP = $59.32
|
|
MB = $62.29
|
Most Recent Note - 9/12/2012 4:50:46 PM
Y - Hit a new 52-week high today and rallied above its pivot point with +85% above average volume triggering a new (or add-on) technical buy signal. Its 50 DMA line defines important near-term support.
>>> The latest Featured Stock Update with an annotated graph appeared on 8/20/2012. Click here.
View all notes |
Alert me of new notes |
CANSLIM.net Company Profile |
SEC |
Zacks Reports |
StockTalk |
News |
Chart |
Request a new note
C
A N
S L
I M
|
NSM
-
NYSE
Nationstar Mtg Hldgs Inc
FINANCIAL SERVICES - Credit Services
|
$27.95
|
-0.14
-0.50% |
$28.91
|
680,115
85.24% of 50 DAV
50 DAV is 797,900
|
$30.07
-7.05%
|
8/29/2012
|
$27.96
|
PP = $28.85
|
|
MB = $30.29
|
Most Recent Note - 9/12/2012 4:52:03 PM
Y - Recently encountering distributional pressure, yet it has been noted - "A strong finish above the new pivot point cited may clear the advanced 'ascending base' pattern and clinch a new (or add-on) technical buy signal."
>>> The latest Featured Stock Update with an annotated graph appeared on 9/7/2012. Click here.
View all notes |
Alert me of new notes |
CANSLIM.net Company Profile |
SEC |
Zacks Reports |
StockTalk |
News |
Chart |
Request a new note
C
A N
S L
I M
|
Symbol/Exchange
Company Name
Industry Group |
PRICE |
CHANGE
(%Change) |
Day High |
Volume
(% DAV)
(% 50 day avg vol) |
52 Wk Hi
% From Hi |
Featured
Date |
Price
Featured |
Pivot Featured |
|
Max Buy |
OSIS
-
NASDAQ
O S I Systems Inc
ELECTRONICS - Semiconductor Equipment and Mate
|
$73.64
|
-0.27
-0.37% |
$74.20
|
69,270
62.13% of 50 DAV
50 DAV is 111,500
|
$75.99
-3.09%
|
9/5/2012
|
$74.39
|
PP = $75.10
|
|
MB = $78.86
|
Most Recent Note - 9/10/2012 3:41:29 PM
Y - Encountered distributional pressure last week after a new pivot point was cited based on its 8/15/12 high plus 10 cents. Subsequent volume-driven gains for a close above its pivot point may clinch a new (or add-on) technical buy signal. Prior highs in the $67-68 area define initial support to watch on pullbacks.
>>> The latest Featured Stock Update with an annotated graph appeared on 8/9/2012. Click here.
View all notes |
Alert me of new notes |
CANSLIM.net Company Profile |
SEC |
Zacks Reports |
StockTalk |
News |
Chart |
Request a new note
C
A N
S L
I M
|
RNF
-
NYSE
Rentech Nitrogen Ptnr Lp
CHEMICALS - Agricultural Chemicals
|
$35.50
|
+0.60
1.72% |
$35.50
|
301,853
70.08% of 50 DAV
50 DAV is 430,700
|
$35.48
0.06%
|
7/27/2012
|
$29.58
|
PP = $30.60
|
|
MB = $32.13
|
Most Recent Note - 9/12/2012 4:54:00 PM
G - Hit a new 52-week high today with its 4th consecutive gain backed by below average volume. Extended from its prior base with near-term support at prior highs in the $30-31 area and its 50 DMA line.
>>> The latest Featured Stock Update with an annotated graph appeared on 8/31/2012. Click here.
View all notes |
Alert me of new notes |
CANSLIM.net Company Profile |
SEC |
Zacks Reports |
StockTalk |
News |
Chart |
Request a new note
C
A N
S L
I M
|
SWI
-
NYSE
Solarwinds Inc
COMPUTER SOFTWARE and SERVICES - Application Software
|
$58.52
|
+0.26
0.45% |
$59.16
|
547,887
47.63% of 50 DAV
50 DAV is 1,150,200
|
$60.25
-2.87%
|
7/25/2012
|
$47.82
|
PP = $47.89
|
|
MB = $50.28
|
Most Recent Note - 9/12/2012 4:55:05 PM
G - Volume totals have been cooling while holding its ground near its all-time high. Its 50 DMA line defines important chart support to watch on pullbacks.
>>> The latest Featured Stock Update with an annotated graph appeared on 8/29/2012. Click here.
View all notes |
Alert me of new notes |
CANSLIM.net Company Profile |
SEC |
Zacks Reports |
StockTalk |
News |
Chart |
Request a new note
C
A N
S L
I M
|
TDG
-
NYSE
Transdigm Group Inc
AEROSPACE/DEFENSE - Aerospace/Defense Products and; Services
|
$142.95
|
+0.75
0.53% |
$143.55
|
157,056
42.24% of 50 DAV
50 DAV is 371,800
|
$144.21
-0.87%
|
8/16/2012
|
$132.23
|
PP = $136.44
|
|
MB = $143.26
|
Most Recent Note - 9/12/2012 4:56:19 PM
G - Hovering near its all-time high recently with volume totals cooling. Prior high near $136 defines near-term chart support to watch on pullbacks.
>>> The latest Featured Stock Update with an annotated graph appeared on 8/17/2012. Click here.
View all notes |
Alert me of new notes |
CANSLIM.net Company Profile |
SEC |
Zacks Reports |
StockTalk |
News |
Chart |
Request a new note
C
A N
S L
I M
|
ULTA
-
NASDAQ
Ulta Salon Cosm & Frag
SPECIALTY RETAIL - Specialty Retail, Other
|
$98.90
|
-0.44
-0.44% |
$99.78
|
656,431
82.50% of 50 DAV
50 DAV is 795,700
|
$103.52
-4.46%
|
9/4/2012
|
$93.17
|
PP = $98.52
|
|
MB = $103.45
|
Most Recent Note - 9/12/2012 4:59:03 PM
Y - Quietly consolidating near its 52-week high, above its pivot point since the considerable 9/07/12 gap up gain triggered a technical buy signal. Reported earnings +42% on +22% sales revenues for the quarter ended July 31, 2012 versus the year ago period.
>>> The latest Featured Stock Update with an annotated graph appeared on 9/4/2012. Click here.
View all notes |
Alert me of new notes |
CANSLIM.net Company Profile |
SEC |
Zacks Reports |
StockTalk |
News |
Chart |
Request a new note
C
A N
S L
I M
|
Symbol/Exchange
Company Name
Industry Group |
PRICE |
CHANGE
(%Change) |
Day High |
Volume
(% DAV)
(% 50 day avg vol) |
52 Wk Hi
% From Hi |
Featured
Date |
Price
Featured |
Pivot Featured |
|
Max Buy |
ULTI
-
NASDAQ
Ultimate Software Group
INTERNET - Internet Software and Services
|
$98.91
|
-0.07
-0.07% |
$99.95
|
110,465
69.65% of 50 DAV
50 DAV is 158,600
|
$106.40
-7.04%
|
8/27/2012
|
$98.36
|
PP = $99.19
|
|
MB = $104.15
|
Most Recent Note - 9/11/2012 6:09:02 PM
Y - Pulled back today for a 3rd consecutive loss on lighter volume while retreating from its all-time high. Finished near its prior chart highs defining initial support to watch above its 50 DMA line.
>>> The latest Featured Stock Update with an annotated graph appeared on 8/27/2012. Click here.
View all notes |
Alert me of new notes |
CANSLIM.net Company Profile |
SEC |
Zacks Reports |
StockTalk |
News |
Chart |
Request a new note
C
A N
S L
I M
|
VSI
-
NYSE
Vitamin Shoppe Inc
SPECIALTY RETAIL - Specialty Retail, Other
|
$58.32
|
-0.38
-0.65% |
$58.85
|
249,997
65.88% of 50 DAV
50 DAV is 379,500
|
$61.83
-5.67%
|
6/29/2012
|
$54.93
|
PP = $55.03
|
|
MB = $57.78
|
Most Recent Note - 9/10/2012 1:00:57 PM
G - Paused today following a streak of 4 consecutive gains. Rebounded and rallied above its 50 DMA line last week, helping its technical stance. Prior lows near $52 define near-term support where any further deterioration would raise more serious concerns.
>>> The latest Featured Stock Update with an annotated graph appeared on 9/10/2012. Click here.
View all notes |
Alert me of new notes |
CANSLIM.net Company Profile |
SEC |
Zacks Reports |
StockTalk |
News |
Chart |
Request a new note
C
A N
S L
I M
|
WPI
-
NYSE
Watson Pharmaceuticals
DRUGS - Drugs - Generic
|
$82.00
|
-0.81
-0.98% |
$83.09
|
982,359
82.66% of 50 DAV
50 DAV is 1,188,400
|
$84.02
-2.40%
|
8/24/2012
|
$82.90
|
PP = $81.10
|
|
MB = $85.16
|
Most Recent Note - 9/7/2012 4:23:20 PM
Y - Still holding its ground in a tight range near its 52-week high since triggering a technical buy signal on 8/24/12 when highlighted in the mid-day report with a gap up gain backed by above average volume. Prior highs in the $81 area define initial support to watch on pullbacks.
>>> The latest Featured Stock Update with an annotated graph appeared on 8/28/2012. Click here.
View all notes |
Alert me of new notes |
CANSLIM.net Company Profile |
SEC |
Zacks Reports |
StockTalk |
News |
Chart |
Request a new note
C
A N
S L
I M
|