You are not logged in.
This means you
CAN ONLY VIEW reports that were published prior to Monday, April 14, 2025.
You
MUST UPGRADE YOUR MEMBERSHIP if you want to see any current reports.
AFTER MARKET UPDATE - MONDAY, SEPTEMBER 12TH, 2011
Previous After Market Report Next After Market Report >>>
|
|
|
|
DOW |
+68.99 |
11,061.12 |
+0.63% |
|
Volume |
1,087,067,880 |
-11% |
|
Volume |
1,943,965,660 |
-4% |
|
NASDAQ |
+27.10 |
2,495.09 |
+1.10% |
|
Advancers |
1,392 |
45% |
|
Advancers |
1,416 |
53% |
|
S&P 500 |
+8.04 |
1,162.27 |
+0.70% |
|
Decliners |
1,622 |
52% |
|
Decliners |
1,165 |
43% |
|
Russell 2000 |
+5.80 |
679.76 |
+0.86% |
|
52 Wk Highs |
15 |
|
|
52 Wk Highs |
9 |
|
|
S&P 600 |
+2.74 |
372.00 |
+0.74% |
|
52 Wk Lows |
278 |
|
|
52 Wk Lows |
251 |
|
|
 |
Major Averages Overcame Early Pressure and Posted Gains
Kenneth J. Gruneisen - Passed the CAN SLIM® Master's Exam
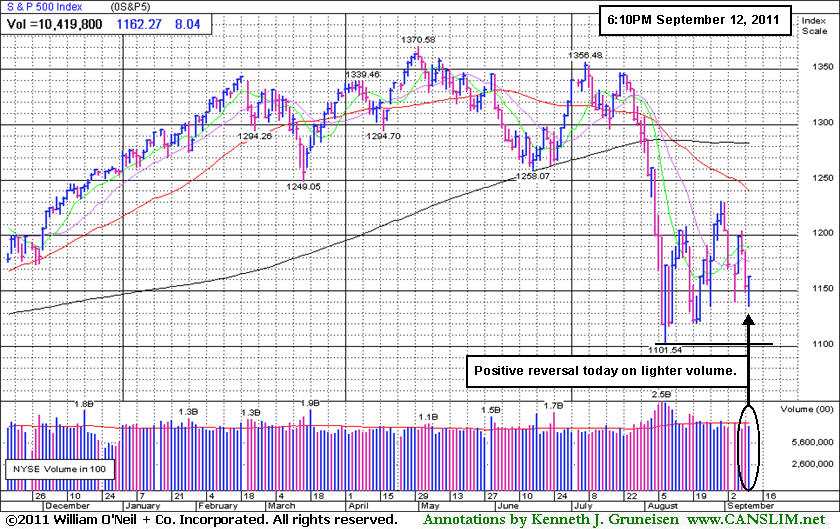
The major averages wiped out the day's losses and rallied in the last half hour after a report that Italy is talking with a Chinese investment firm about buying Italian bonds. The major indices finished near Monday's session highs, however lower reported volume totals on the NYSE and on the Nasdaq exchange was an indication of lackluster buying demand from the institutional crowd. Declining issues beat advancers by 8-7 on the NYSE. Advancing issues beat decliners by 7-6 on the Nasdaq.exchange. The new 52-week lows total expanded again and substantially outnumbered new 52-week highs on both major exchanges. There were only 2 high-ranked companies from the CANSLIM.net Leaders List that made new 52-week highs and appeared on the CANSLIM.net BreakOuts Page, down from the prior session total of 10 stocks. Any sustainable rally requires a healthy crop of strong leaders hitting new 52-week highs, as this commentary has repeated! The contraction in leadership raises some questions about the current rally's strength and its ability to be sustained for a meaningful advance. First Cash Financial Svs (FCFS -0.04%) was the only decliner out of the 8 high-ranked leaders currently included on the Featured Stocks Page.
A report by the Financial Times helped overcome concerns that Greece may default on its debt and offset a prediction by Citigroup Inc (C +0.82%) that U.S. sovereign debt may be downgraded again in the next two to three years. Bank of America Corp (BAC +1.0%) rose after the bank said it will eliminate 30,000 jobs in the initial phase of a plan to cut annual costs by $5 billion by the end of 2013.
McDonald's Corp (MCD +1.36%) and 3-M Company (MMM +2.05%) added the most to the Dow Industrials. Semiconductor stocks chalked up gains after Broadcom Corp (BRCM -1.14%) said it will buy NetLogic Microsystems Inc (NETL +50.8%) for about $3.7 billion. The McGraw Hill Companies Inc (MHP +3.98%) rose after announcing plans to split into two companies and cut costs.
The market environment (M criteria) can barely be considered an uptrend that is under pressure, meanwhile the major averages are at least still sputtering above their Day 1 (8/09/11) lows. Disciplined investors may only want to carefully consider new buying efforts when all key criteria are satisfied, and they may be wise to wait and see more evidence of new leadership before committing sidelined cash to substantial new positions.
The September 2011 issue of CANSLIM.net News will be available soon. The Q3 2011 Webcast has also been scheduled for Wednesday, September 28th at 8PM EST. Links to all prior reports and webcasts are available on the Premium Member Homepage.
PICTURED: The S&P 500 Index managed a positive reversal for a gain with lighter volume.
|
 Kenneth J. Gruneisen started out as a licensed stockbroker in August 1987, a couple of months prior to the historic stock market crash that took the Dow Jones Industrial Average down -22.6% in a single day. He has published daily fact-based fundamental and technical analysis on high-ranked stocks online for two decades. Through FACTBASEDINVESTING.COM, Kenneth provides educational articles, news, market commentary, and other information regarding proven investment systems that work in good times and bad.
Comments contained in the body of this report are technical opinions only and are not necessarily those of Gruneisen Growth Corp. The material herein has been obtained from sources believed to be reliable and accurate, however, its accuracy and completeness cannot be guaranteed. Our firm, employees, and customers may effect transactions, including transactions contrary to any recommendation herein, or have positions in the securities mentioned herein or options with respect thereto. Any recommendation contained in this report may not be suitable for all investors and it is not to be deemed an offer or solicitation on our part with respect to the purchase or sale of any securities. |
|
 |
Semiconductor Index Led Tech Sector Higher
Kenneth J. Gruneisen - Passed the CAN SLIM® Master's Exam
The Semiconductor Index ($SOX +3.03%) led the tech sector while the Networking Index ($NWX +1.88%), Internet Index ($IIX +1.44%), and Biotechnology Index ($BTK +0.85%) also tallied gains. The Retail Index ($RLX +1.64%) was a positive influence on the major averages and the Bank Index ($BKX +1.85%) and Broker/Dealer Index ($XBD +0.96%) also underpinned the session's rally back from negative into positive territory. Gains in energy-related shares boosted the Oil Services Index ($OSX +1.63%). The Healthcare Index ($HMO +0.53%) posted a small gain, and the Gold & Silver Index ($XAU -2.67%) lost ground, making the defensive "safe haven" groups standout laggards on a mostly positive session.
Charts courtesy www.stockcharts.com
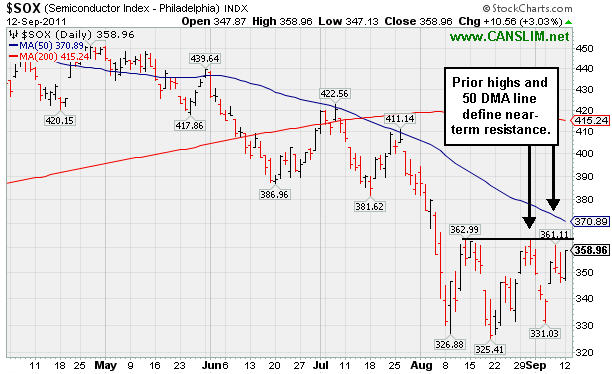
PICTURED: The Semiconductor Index ($SOX +3.03%) faces near-term resistance at prior highs and its 50-day moving average (DMA) line.
| Oil Services |
$OSX |
228.26 |
+3.65 |
+1.63% |
-6.88% |
| Healthcare |
$HMO |
1,955.93 |
+10.22 |
+0.53% |
+15.60% |
| Integrated Oil |
$XOI |
1,103.87 |
+1.46 |
+0.13% |
-9.01% |
| Semiconductor |
$SOX |
358.96 |
+10.56 |
+3.03% |
-12.84% |
| Networking |
$NWX |
232.04 |
+4.28 |
+1.88% |
-17.29% |
| Internet |
$IIX |
278.97 |
+3.95 |
+1.44% |
-9.35% |
| Broker/Dealer |
$XBD |
84.10 |
+0.80 |
+0.96% |
-30.79% |
| Retail |
$RLX |
503.88 |
+8.13 |
+1.64% |
-0.89% |
| Gold & Silver |
$XAU |
217.25 |
-5.96 |
-2.67% |
-4.12% |
| Bank |
$BKX |
36.90 |
+0.67 |
+1.85% |
-29.32% |
| Biotech |
$BTK |
1,157.75 |
+9.80 |
+0.85% |
-10.78% |
|
|
|
 |
Conviction Questionable But Consolidation Has Look Of New Base
Kenneth J. Gruneisen - Passed the CAN SLIM® Master's Exam
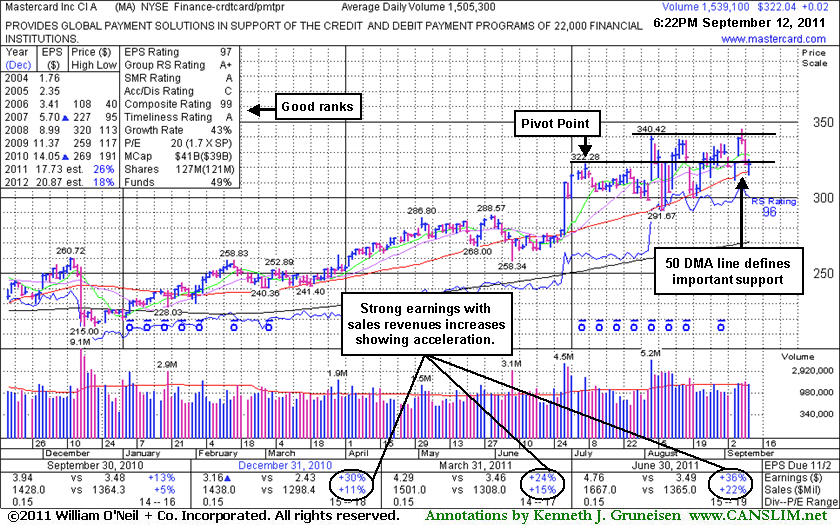
Mastercard Inc Cl A (MA +$0.02 or +0.01% to $322.04) has again slumped near important support at its 50-day moving average (DMA) line and near its prior pivot point. A damaging violation of its 50 DMA line would raise concerns and may trigger a technical sell signal. The choppy action following its prior breakout has offered investors an opportunity to accumulate shares and pyramid into any positions without chasing it higher. While its latest consolidation may be considered a new base pattern, no new pivot point is being cited. Last week it quietly wedged up to touch a new all-time high, but after gains on quiet volume it again pulled back to its 50 DMA line. The broader market (M criteria) has been noted for its recent lack of leadership and worrisome distributional pressure that argues for caution and smart defense more than any new buying efforts.
Mastercard's last FSU appearance was on 8/26/11 with an annotated weekly graph under the headline, "Quiet Gains Reveal Lack Of Conviction After Finding Support." It has been showing sales revenues acceleration and strong quarterly earnings increases, with the latest June 2011 quarter showing a +36% earnings increase on +22% sales revenues. It also has maintained a strong annual earnings (A criteria) history. A considerable 6/29/11 gain on heavy volume came after the Federal Reserve set a higher cap on debit-card fees (mentioned in the 6/29/11 Market Commentary - read here). In a handful of mid-day report appearances in June and July of this year it was noted -"It survived but failed to impress since it was dropped from the Featured Stocks list on 7/02/08 after an ominous 'double top' pattern triggered a technical sell signal." A follow-up article dated 12/16/08 revisited MA and summarized the action under the headline, "Multiple Sell Signals Prompted Profit Taking; Serious Damage Followed".
|
|
|
Color Codes Explained :
Y - Better candidates highlighted by our
staff of experts.
G - Previously featured
in past reports as yellow but may no longer be buyable under the
guidelines.
***Last / Change / Volume data in this table is the closing quote data***
Symbol/Exchange
Company Name
Industry Group |
PRICE |
CHANGE
(%Change) |
Day High |
Volume
(% DAV)
(% 50 day avg vol) |
52 Wk Hi
% From Hi |
Featured
Date |
Price
Featured |
Pivot Featured |
|
Max Buy |
ATHN
-
NASDAQ
Athenahealth Inc
DIVERSIFIED SERVICES - Business/Management Services
|
$60.52
|
+1.44
2.44% |
$60.62
|
623,241
89.82% of 50 DAV
50 DAV is 693,900
|
$63.74
-5.05%
|
9/8/2011
|
$61.93
|
PP = $61.78
|
|
MB = $64.87
|
 Most Recent Note - 9/12/2011 5:04:15 PM
Y - Quiet gain today for its second-best finish ever, climbing back above the previously noted significant high close ($60.00 on 8/03/11). See the latest FSU analysis for more details and a new annotated weekly graph.
>>> The latest Featured Stock Update with an annotated graph appeared on 9/8/2011. Click here.
View all notes |
Alert me of new notes |
CANSLIM.net Company Profile |
SEC |
Zacks Reports |
StockTalk |
News |
Chart |
Request a new note
C
A N
S L
I M


|
EXLS
-
NASDAQ
Exlservice Holdings Inc
DIVERSIFIED SERVICES - Business/Management Services
|
$24.89
|
+0.02
0.08% |
$25.25
|
58,734
59.33% of 50 DAV
50 DAV is 99,000
|
$26.55
-6.25%
|
8/2/2011
|
$24.85
|
PP = $24.85
|
|
MB = $26.09
|
Most Recent Note - 9/9/2011 4:19:12 PM
Y - Loss today with higher volume after a gap down was indicative of mild distributional pressure as it slumped to a close near its prior pivot point. Its 50 DMA line defines important chart support to watch on pullbacks, where a violation would raise concerns and may trigger a technical sell signal.
>>> The latest Featured Stock Update with an annotated graph appeared on 9/7/2011. Click here.
View all notes |
Alert me of new notes |
CANSLIM.net Company Profile |
SEC |
Zacks Reports |
StockTalk |
News |
Chart |
Request a new note
C
A N
S L
I M
|
FCFS
-
NASDAQ
First Cash Financial Svs
SPECIALTY RETAIL - Specialty Retail, Other
|
$48.35
|
-0.02
-0.04% |
$49.10
|
208,259
57.96% of 50 DAV
50 DAV is 359,300
|
$49.13
-1.59%
|
5/31/2011
|
$42.00
|
PP = $40.23
|
|
MB = $42.24
|
Most Recent Note - 9/9/2011 4:20:46 PM
G - Holding its ground stubbornly near its all-time high, extended from its prior base. Its 50 DMA line defines supports to watch.
>>> The latest Featured Stock Update with an annotated graph appeared on 9/6/2011. Click here.
View all notes |
Alert me of new notes |
CANSLIM.net Company Profile |
SEC |
Zacks Reports |
StockTalk |
News |
Chart |
Request a new note
C
A N
S L
I M
|
JCOM
-
NASDAQ
J 2 Global Communication
INTERNET - Internet Software and Services
|
$30.69
|
+0.50
1.66% |
$30.69
|
451,626
111.65% of 50 DAV
50 DAV is 404,500
|
$32.64
-5.97%
|
8/8/2011
|
$30.38
|
PP = $29.31
|
|
MB = $30.78
|
Most Recent Note - 9/12/2011 5:06:05 PM
G - Gain today with lighter but above average volume, finishing -6% off its 52-week high. Previous highs in the $30-31 area define initial chart support to watch.
>>> The latest Featured Stock Update with an annotated graph appeared on 8/29/2011. Click here.
View all notes |
Alert me of new notes |
CANSLIM.net Company Profile |
SEC |
Zacks Reports |
StockTalk |
News |
Chart |
Request a new note
C
A N
S L
I M
|
MA
-
NYSE
Mastercard Inc Cl A
DIVERSIFIED SERVICES - Business/Management Services
|
$322.04
|
+0.02
0.01% |
$325.49
|
1,541,724
102.42% of 50 DAV
50 DAV is 1,505,300
|
$345.13
-6.69%
|
8/3/2011
|
$324.82
|
PP = $322.38
|
|
MB = $338.50
|
Most Recent Note - 9/9/2011 4:28:17 PM
Y - Color code is changed to yellow after its slump to a close near important support at its 50 DMA line and near its prior pivot point. It finished near the session low with a loss on higher volume indicative of distributional pressure. A damaging violation of its 50 DMA would raise concerns and may trigger a technical sell signal.
>>> The latest Featured Stock Update with an annotated graph appeared on 9/12/2011. Click here.
View all notes |
Alert me of new notes |
CANSLIM.net Company Profile |
SEC |
Zacks Reports |
StockTalk |
News |
Chart |
Request a new note
C
A N
S L
I M
|
Symbol/Exchange
Company Name
Industry Group |
PRICE |
CHANGE
(%Change) |
Day High |
Volume
(% DAV)
(% 50 day avg vol) |
52 Wk Hi
% From Hi |
Featured
Date |
Price
Featured |
Pivot Featured |
|
Max Buy |
MG
-
NYSE
Mistras Group Inc
DIVERSIFIED SERVICES - Bulding and Faci;ity Management Services
|
$20.01
|
+0.20
1.01% |
$20.16
|
198,944
113.36% of 50 DAV
50 DAV is 175,500
|
$20.82
-3.89%
|
8/10/2011
|
$17.89
|
PP = $17.58
|
|
MB = $18.46
|
Most Recent Note - 9/9/2011 4:29:44 PM
G - Holding its ground stubbornly near its 52-week high. Prior resistance in the $18 area and its 50 DMA line define important chart support to watch on pullbacks.
>>> The latest Featured Stock Update with an annotated graph appeared on 9/9/2011. Click here.
View all notes |
Alert me of new notes |
CANSLIM.net Company Profile |
SEC |
Zacks Reports |
StockTalk |
News |
Chart |
Request a new note
C
A N
S L
I M
|
MKTX
-
NASDAQ
Marketaxess Holdings Inc
FINANCIAL SERVICES - Investment Brokerage - Nationa
|
$29.44
|
+0.04
0.14% |
$29.73
|
254,937
103.38% of 50 DAV
50 DAV is 246,600
|
$30.95
-4.88%
|
7/29/2011
|
$25.87
|
PP = $26.35
|
|
MB = $27.67
|
Most Recent Note - 9/9/2011 4:33:05 PM
G - Loss on higher volume today was indicative of distributional pressure, but its close in the upper third of its intra-day range was a sign it found encouraging support. It is extended from its prior base. Prior resistance in the $26 area and its 50 DMA line define important chart support to watch.
>>> The latest Featured Stock Update with an annotated graph appeared on 9/2/2011. Click here.
View all notes |
Alert me of new notes |
CANSLIM.net Company Profile |
SEC |
Zacks Reports |
StockTalk |
News |
Chart |
Request a new note
C
A N
S L
I M
|
PSMT
-
NASDAQ
Pricesmart Inc
RETAIL - Drug Stores
|
$67.81
|
+0.81
1.21% |
$67.97
|
357,235
126.72% of 50 DAV
50 DAV is 281,900
|
$68.05
-0.35%
|
8/30/2011
|
$63.01
|
PP = $62.37
|
|
MB = $65.49
|
Most Recent Note - 9/12/2011 5:08:07 PM
G - Inched higher today for a 5th consecutive gain backed by above average volume. Prior highs and its 50 DMA line define support levels to watch on pullbacks.
>>> The latest Featured Stock Update with an annotated graph appeared on 8/30/2011. Click here.
View all notes |
Alert me of new notes |
CANSLIM.net Company Profile |
SEC |
Zacks Reports |
StockTalk |
News |
Chart |
Request a new note
C
A N
S L
I M
|
|
|
|
THESE ARE NOT BUY RECOMMENDATIONS!
Comments contained in the body of this report are technical
opinions only. The material herein has been obtained
from sources believed to be reliable and accurate, however,
its accuracy and completeness cannot be guaranteed.
This site is not an investment advisor, hence it does
not endorse or recommend any securities or other investments.
Any recommendation contained in this report may not
be suitable for all investors and it is not to be deemed
an offer or solicitation on our part with respect to
the purchase or sale of any securities. All trademarks,
service marks and trade names appearing in this report
are the property of their respective owners, and are
likewise used for identification purposes only.
This report is a service available
only to active Paid Premium Members.
You may opt-out of receiving report notifications
at any time. Questions or comments may be submitted
by writing to Premium Membership Services 665 S.E. 10 Street, Suite 201 Deerfield Beach, FL 33441-5634 or by calling 1-800-965-8307
or 954-785-1121.
|
|
|

