You are not logged in.
This means you
CAN ONLY VIEW reports that were published prior to Monday, February 26, 2024.
You
MUST UPGRADE YOUR MEMBERSHIP if you want to see any current reports.
AFTER MARKET UPDATE - THURSDAY, SEPTEMBER 10TH, 2020
Previous After Market Report Next After Market Report >>>
|
|
|
|
DOW |
-405.89 |
27,534.58 |
-1.45% |
|
Volume |
911,197,084 |
+5% |
|
Volume |
3,798,494,900 |
+8% |
|
NASDAQ |
-227.11 |
10,914.45 |
-2.04% |
|
Advancers |
970 |
33% |
|
Advancers |
1,096 |
34% |
|
S&P 500 |
-59.77 |
3,339.19 |
-1.76% |
|
Decliners |
1,943 |
67% |
|
Decliners |
2,103 |
66% |
|
Russell 2000 |
-18.73 |
1,507.75 |
-1.23% |
|
52 Wk Highs |
57 |
|
|
52 Wk Highs |
61 |
|
|
S&P 600 |
-11.76 |
867.53 |
-1.34% |
|
52 Wk Lows |
22 |
|
|
52 Wk Lows |
31 |
|
|
 |
Tech Selloff Resumes and Pressures Major Indices Again
Kenneth J. Gruneisen - Passed the CAN SLIM® Master's Exam
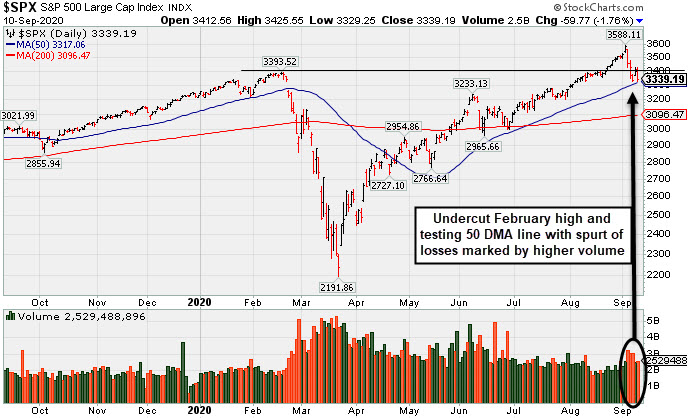
The Dow declined 405 points, while the S&P 500 fell 1.8% after posting its best day since June yesterday. The Nasdaq Composite slipped 2.0%, giving up early gains of more than 1% in the choppy trading session. However, the Tech-heavy index ended the day above correction territory, down 9.4% from its record closing high notched last Wednesday. The reported volume totals were higher than the prior session totals on the NYSE and on the Nasdaq exchange, revealing an increase in distributional selling pressure from the institutional crowd. Breadth was negative as decliners led advancers by a 2-1 margin on the NYSE and on the Nasdaq exchange. Leadership remained thin as only 12 high-ranked companies from the Leaders List hit new 52-week highs and were listed on the BreakOuts Page, versus the total of 13 on the prior session. New 52-week highs totals outnumbered new 52-week lows on both the NYSE and the Nasdaq exchange. The major indices have seen their uptrend recently come under pressure (M criteria). Any sustainable rally requires a healthy crop of new leaders, so it remains very important to see substantial improvement in the new highs totals.
PICTURED: The S&P 500 Index recently undercut its February high and it is testing its 50-day moving average (DMA) line with a spurt of losses marked by higher volume.
Stock U.S. equities finished broadly lower Thursday as the sell-off in Tech stocks resumed and investors assessed updates on the labor market. On the data front, initial jobless claims came in at 884,000 in the week ending September 5, higher than expected and matching the previous upwardly revised reading. Treasuries strengthened amid the perceived “risk off” mood with the yield on the 10-year note falling one basis point to 0.68%. Meanwhile, data from Federal Home Loan Mortgage Corp (FMCC -0.48%) commonly called "Freddie Mac" showed the 30-year fixed mortgage rate dropped to a fresh all-time low of 2.86% in the most recent week. In commodities, WTI crude fell 2.5% to $37.10/barrel amid a surprise build in U.S. crude inventories.
All 11 S&P 500 sectors ended the day in negative territory, with Energy and Information Technology stocks leading the downturn. In corporate news, mega-cap stocks traded lower with Apple (AAPL -3.32%), Amazon (AMZN -2.86%), and Microsoft (MSFT -2.80%) all suffering large losses. Elsewhere, Penn National Gaming Inc (PENN +7.41%) jumped after receiving a street high price target, citing growth in online sports betting. In earnings, Restoration Hardware (RH +20.05%) surged after the luxury furniture retailer provided optimistic forward guidance. GameStop (GME -15.24%) tumbled following a larger-than-forecasted quarterly loss. |
 Kenneth J. Gruneisen started out as a licensed stockbroker in August 1987, a couple of months prior to the historic stock market crash that took the Dow Jones Industrial Average down -22.6% in a single day. He has published daily fact-based fundamental and technical analysis on high-ranked stocks online for two decades. Through FACTBASEDINVESTING.COM, Kenneth provides educational articles, news, market commentary, and other information regarding proven investment systems that work in good times and bad.
Comments contained in the body of this report are technical opinions only and are not necessarily those of Gruneisen Growth Corp. The material herein has been obtained from sources believed to be reliable and accurate, however, its accuracy and completeness cannot be guaranteed. Our firm, employees, and customers may effect transactions, including transactions contrary to any recommendation herein, or have positions in the securities mentioned herein or options with respect thereto. Any recommendation contained in this report may not be suitable for all investors and it is not to be deemed an offer or solicitation on our part with respect to the purchase or sale of any securities. |
|
 |
Tech, Retail, Financial, and Commodity-Linked Groups Fell
Kenneth J. Gruneisen - Passed the CAN SLIM® Master's Exam
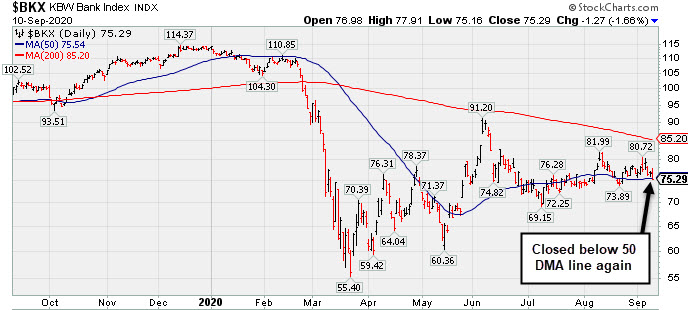
The tech sector had a negative bias as the Networking Index ($NWX -2.86%) outpaced the Biotech Index ($BTK -1.95%) and Semiconductor Index ($SOX -1.47%) to the downside. The Retail Index ($RLX -2.29%) fell and financial stocks also pressured the major indices as the Broker/Dealer Index ($XBD -1.31%) and Bank Index ($BKX -1.66%) both lost ground. The Oil Services Index ($OSX -3.69%) and Integrated Oil Index ($XOI -4.16%) were standout decliners and the Gold & Silver Index ($XAU -1.59%) also fell.
PICTURED: The Bank Index ($BKX -1.66%) closed below its 50-day moving average (DMA) line again with Thursday's loss.
| Oil Services |
$OSX |
32.75 |
-1.26 |
-3.69% |
-58.17% |
| Integrated Oil |
$XOI |
650.35 |
-28.21 |
-4.16% |
-48.81% |
| Semiconductor |
$SOX |
2,137.78 |
-31.83 |
-1.47% |
+15.66% |
| Networking |
$NWX |
529.11 |
-15.60 |
-2.86% |
-9.31% |
| Broker/Dealer |
$XBD |
283.02 |
-3.76 |
-1.31% |
-2.53% |
| Retail |
$RLX |
3,396.30 |
-79.44 |
-2.29% |
+38.67% |
| Gold & Silver |
$XAU |
152.34 |
-2.45 |
-1.59% |
+42.48% |
| Bank |
$BKX |
75.29 |
-1.27 |
-1.66% |
-33.58% |
| Biotech |
$BTK |
5,128.46 |
-101.78 |
-1.95% |
+1.20% |
|
|
|
 |
Adobe Found Support Following Recent Breakout
Kenneth J. Gruneisen - Passed the CAN SLIM® Master's Exam
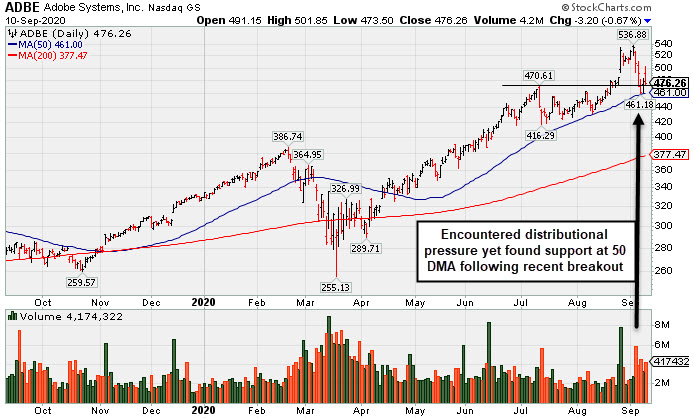
Adobe Inc (ADBE -$3.20 or -0.67% to $476.26) reversed into the red and ended the session lower after it was highlighted in yellow in the earlier mid-day report (read here) after finding support at its 10 week-moving average (WMA). A valid secondary buy point exists up to 5% above the latest high. It pulled back from its all-time high and found support above its 50-day moving average (DMA) line ($461).
Disciplined investors always limit losses by selling any stock that falls more than 7-8% from their purchase price. Keep in mind it is due to report Aug '20 quarterly results on Tuesday, 9/15/20. Volume and volatility often increase near earnings news. This well-known Computer Software - Desktop firm reported May '20 quarterly earnings +34% on +14% sales revenues, which marked its 3rd consecutive quarterly earnings increase above the +25% minimum guideline (C criteria). Annual earnings history (A criteria) has been strong and steady.
It has a large supply of 479.7 million shares outstanding (S criteria) which makes it a less likely sprinter. However, the number of top-rated funds owning its shares rose from 3,285 in Sep '19 to 3,860 in Jun '20, a reassuring sign concerning the I criteria. Its current Up/Down Volume Ratio of 1.2 is an unbiased indication its shares have been under slight accumulation over the past 50 days. It has an A Timeliness Rating and a B Sponsorship rating, however, its Accumulation/Distribution rating is currently a D.
|
|
|
Color Codes Explained :
Y - Better candidates highlighted by our
staff of experts.
G - Previously featured
in past reports as yellow but may no longer be buyable under the
guidelines.
***Last / Change / Volume data in this table is the closing quote data***
Symbol/Exchange
Company Name
Industry Group |
PRICE |
CHANGE
(%Change) |
Day High |
Volume
(% DAV)
(% 50 day avg vol) |
52 Wk Hi
% From Hi |
Featured
Date |
Price
Featured |
Pivot Featured |
|
Max Buy |
 ADBE
-
NASDAQ
ADBE
-
NASDAQ
Adobe Inc
COMPUTER SOFTWARE and SERVICES - Application Software
|
$476.26
|
-3.20
-0.67% |
$501.85
|
4,178,112
154.86% of 50 DAV
50 DAV is 2,698,000
|
$536.88
-11.29%
|
9/10/2020
|
$488.46
|
PP = $536.88
|
|
MB = $563.72
|
 Most Recent Note - 9/10/2020 4:57:49 PM
Y - Encountered distributional pressure and reversed early gains to suffer a loss with above average volume today after highlighted in yellow in the mid-day report. Since finding support at its 10 week-moving average (WMA), a valid secondary buy point exists up to 5% above the latest high. Subsequent losses violating its 50 DMA line ($461) may trigger a technical sell signal. Disciplined investors always limit losses by selling any stock that falls more than 7-8% from their purchase price. Due to report Aug '20 quarterly results on 9/15/20. Volume and volatility often increase near earnings news. This well-known Computer Software - Desktop firm reported May '20 quarterly earnings +34% on +14% sales revenues, its 3rd consecutive quarterly earnings increase above the +25% minimum guideline (C criteria). Annual earnings history (A criteria) has been strong and steady. See the latest FSU analysis for more details and a new annotated graph.
>>> FEATURED STOCK ARTICLE : Adobe Found Support Following Recent Breakout - 9/10/2020 |
View all notes |
Set NEW NOTE alert |
Company Profile |
SEC
News |
Chart |
Request a new note
C
A
S
I |
CRL
-
NYSE
Charles River Labs Intl
DRUGS - Biotechnology
|
$214.96
|
+5.07
2.42% |
$218.67
|
480,532
142.59% of 50 DAV
50 DAV is 337,000
|
$221.97
-3.16%
|
7/15/2020
|
$192.66
|
PP = $189.95
|
|
MB = $199.45
|
Most Recent Note - 9/10/2020 3:55:25 PM
G - Volume is above average behind today's gain after gapping up. Approaching previously stubborn resistance in the $221 area. Found prompt support at its 50 DMA line ($204) after volume-driven losses. Recently reported Jun '20 quarterly earnings -3% on +4% sales revenues, below the +25% minimum guideline (C criteria), but better than expected while the company also raised its guidance.
>>> FEATURED STOCK ARTICLE : Volume Totals Cooling While Hovering in Tight Range Near Record High - 8/25/2020 |
View all notes |
Set NEW NOTE alert |
Company Profile |
SEC
News |
Chart |
Request a new note
C
A
S
I |
EBS
-
NYSE
Emergent Biosolutions
DRUGS - Biotechnology
|
$99.00
|
-5.00
-4.81% |
$104.49
|
634,257
64.92% of 50 DAV
50 DAV is 977,000
|
$137.61
-28.06%
|
7/7/2020
|
$89.47
|
PP = $93.68
|
|
MB = $98.36
|
Most Recent Note - 9/10/2020 3:52:42 PM
G - Still slumping after violating its prior high $107.16 on 7/20/20) and its 50 DMA line ($109.50) during a spurt of 13 losses over the span of 15 sessions. A rebound above its 50 DMA line is needed for its outlook to improve. Fundamentals remain strong. See the latest FSU analysis for more details and an annotated graph.
>>> FEATURED STOCK ARTICLE : Recently Sputtering Below 50-Day Moving Average - 9/9/2020 |
View all notes |
Set NEW NOTE alert |
Company Profile |
SEC
News |
Chart |
Request a new note
C
A
S
I |
AMD
-
NASDAQ
Advanced Micro Devices
ELECTRONICS - Semiconductor - Broad Line
|
$78.98
|
-2.93
-3.58% |
$83.31
|
51,140,292
79.61% of 50 DAV
50 DAV is 64,239,000
|
$94.28
-16.23%
|
8/31/2020
|
$90.42
|
PP = $87.39
|
|
MB = $91.76
|
Most Recent Note - 9/10/2020 3:50:28 PM
Y - Slumping near recent lows in the $76 area which define important near-term support above its 50 DMA line ($73.27). Fundamentals remain strong.
>>> FEATURED STOCK ARTICLE : Perched at All-Time High After Another Bullish Breakout - 9/2/2020 |
View all notes |
Set NEW NOTE alert |
Company Profile |
SEC
News |
Chart |
Request a new note
C
A
S
I |
TREX
-
NYSE
Trex Company Inc
MATERIALS and CONSTRUCTION - General Building Materials
|
$137.69
|
-3.52
-2.49% |
$141.61
|
859,176
137.25% of 50 DAV
50 DAV is 626,000
|
$156.63
-12.09%
|
6/26/2020
|
$109.05
|
PP = $132.94
|
|
MB = $139.59
|
Most Recent Note - 9/9/2020 6:08:32 PM
G - Color code is changed to green after rebounding above its "max buy" level. Found prompt support near its 50 DMA line ($138.42) line helping its outlook improve. Fundamentals remain strong.
>>> FEATURED STOCK ARTICLE : Fall Below "Max Buy" Level Also Undercut 50-Day Moving Average - 9/4/2020 |
View all notes |
Set NEW NOTE alert |
Company Profile |
SEC
News |
Chart |
Request a new note
C
A
S
I |
Symbol/Exchange
Company Name
Industry Group |
PRICE |
CHANGE
(%Change) |
Day High |
Volume
(% DAV)
(% 50 day avg vol) |
52 Wk Hi
% From Hi |
Featured
Date |
Price
Featured |
Pivot Featured |
|
Max Buy |
NFLX
-
NASDAQ
Netflix Inc
SPECIALTY RETAIL - Music and Video Stores
|
$480.67
|
-19.52
-3.90% |
$506.29
|
6,036,956
75.86% of 50 DAV
50 DAV is 7,958,000
|
$575.37
-16.46%
|
9/1/2020
|
$547.45
|
PP = $575.47
|
|
MB = $604.24
|
Most Recent Note - 9/10/2020 3:41:35 PM
G - Color code is changed to green while violating its 50 DMA line ($501.73) with today's 6th consecutive loss with near average or lighter volume raising concerns and triggering a technical sell signal. A prompt rebound above the 50 DMA line is needed for its outlook to improve.
>>> FEATURED STOCK ARTICLE : Pulling Back After Best Ever Close on Tuesday - 9/3/2020 |
View all notes |
Set NEW NOTE alert |
Company Profile |
SEC
News |
Chart |
Request a new note
C
A
S
I |
LGIH
-
NASDAQ
L G I Homes Inc
Bldg-Resident/Comml
|
$111.60
|
-2.84
-2.48% |
$116.62
|
271,494
85.11% of 50 DAV
50 DAV is 319,000
|
$123.94
-9.96%
|
7/7/2020
|
$99.19
|
PP = $95.82
|
|
MB = $100.61
|
Most Recent Note - 9/9/2020 4:58:09 PM
G - Retreated from its 52-week high but halted its near its 50 DMA line ($109.97) and posted 2 consecutive gains on lighter volume. More damaging losses would raise greater concerns. Reported Jun '20 quarterly earnings +21% on +4% sales revenues, breaking a streak of 4 comparisons above the +25% minimum guideline (C criteria).
>>> FEATURED STOCK ARTICLE : Homebuilder Halted Slide Near Prior Low and 50-Day Average - 9/8/2020 |
View all notes |
Set NEW NOTE alert |
Company Profile |
SEC
News |
Chart |
Request a new note
C
A
S
I |
NOW
-
NYSE
Servicenow Inc
Computer Sftwr-Enterprse
|
$452.98
|
-5.22
-1.14% |
$468.32
|
1,084,852
62.24% of 50 DAV
50 DAV is 1,743,000
|
$501.82
-9.73%
|
8/20/2020
|
$453.34
|
PP = $454.79
|
|
MB = $477.53
|
Most Recent Note - 9/9/2020 6:06:16 PM
Y - Rebounded today after briefly undercutting the prior high ($454) and testing support at its 50 DMA line ($440). Fundamentals remain strong. More damaging losses may raise concerns and trigger a technical sell signal.
>>> FEATURED STOCK ARTICLE : Quiet Gain to New High for Computer Software Firm - 8/28/2020 |
View all notes |
Set NEW NOTE alert |
Company Profile |
SEC
News |
Chart |
Request a new note
C
A
S
I |
DOCU
-
NASDAQ
Docusign Inc
Computer Sftwr-Enterprse
|
$205.95
|
-5.84
-2.76% |
$217.25
|
6,018,400
95.20% of 50 DAV
50 DAV is 6,322,000
|
$290.23
-29.04%
|
6/10/2020
|
$149.73
|
PP = $152.10
|
|
MB = $159.71
|
Most Recent Note - 9/9/2020 5:08:22 PM
G - Halted its slide today near its 50 DMA line ($207) after suffering 4 consecutive volume-driven losses while abruptly retreating from its all-time high. The prior low ($189.12 on 8/12/20) defines the next important near-term support to watch.
>>> FEATURED STOCK ARTICLE : Perched Near All-Time High After Finding Support Above 50 DMA - 8/31/2020 |
View all notes |
Set NEW NOTE alert |
Company Profile |
SEC
News |
Chart |
Request a new note
C
A
S
I |
|
|
|
THESE ARE NOT BUY RECOMMENDATIONS!
Comments contained in the body of this report are technical
opinions only. The material herein has been obtained
from sources believed to be reliable and accurate, however,
its accuracy and completeness cannot be guaranteed.
This site is not an investment advisor, hence it does
not endorse or recommend any securities or other investments.
Any recommendation contained in this report may not
be suitable for all investors and it is not to be deemed
an offer or solicitation on our part with respect to
the purchase or sale of any securities. All trademarks,
service marks and trade names appearing in this report
are the property of their respective owners, and are
likewise used for identification purposes only.
This report is a service available
only to active Paid Premium Members.
You may opt-out of receiving report notifications
at any time. Questions or comments may be submitted
by writing to Premium Membership Services 665 S.E. 10 Street, Suite 201 Deerfield Beach, FL 33441-5634 or by calling 1-800-965-8307
or 954-785-1121.
|
|
|