You are not logged in.
This means you
CAN ONLY VIEW reports that were published prior to Monday, April 14, 2025.
You
MUST UPGRADE YOUR MEMBERSHIP if you want to see any current reports.
AFTER MARKET UPDATE - THURSDAY, SEPTEMBER 10TH, 2009
Previous After Market Report Next After Market Report >>>
|
|
|
|
DOW |
+80.26 |
9,627.48 |
+0.84% |
|
Volume |
1,494,227,540 |
+20% |
|
Volume |
2,491,016,340 |
-1% |
|
NASDAQ |
+23.63 |
2,084.02 |
+1.15% |
|
Advancers |
2,308 |
74% |
|
Advancers |
1,817 |
64% |
|
S&P 500 |
+10.77 |
1,044.14 |
+1.04% |
|
Decliners |
724 |
23% |
|
Decliners |
875 |
31% |
|
Russell 2000 |
+8.50 |
594.90 |
+1.45% |
|
52 Wk Highs |
179 |
|
|
52 Wk Highs |
107 |
|
|
S&P 600 |
+4.28 |
312.52 |
+1.39% |
|
52 Wk Lows |
1 |
|
|
52 Wk Lows |
3 |
|
|
 |
Major Averages Post 5th Consecutive Gains, Hitting Unanimous New 2009 Highs
Kenneth J. Gruneisen - Passed the CAN SLIM® Master's Exam
The major averages collectively rallied for their 5th consecutive gains on Thursday. The Dow Jones Industrial Average, S&P 500 Index, and the Nasdaq Composite Index ended near their session highs and unanimously marked fresh 2009 highs. Advancers trumped decliners by a 3-to-1 ratio on the NYSE and by a 2-to-1 ratio on the Nasdaq exchange. Volume totals above average were a welcome sign while compared to the prior session volume was reported higher on the NYSE and very near the prior session total on the Nasdaq exchange. There were 33 high-ranked companies from the CANSLIM.net Leaders List that made a new 52-week high and appeared on the CANSLIM.net BreakOuts Page, down slightly from the 36 issues that appeared on the prior session. New 52-week highs still outnumbered new 52-week lows on both exchanges while new lows were in the single digits yet again.
President Obama said on Wednesday evening a health insurance plan of $900 billion over 10 years will be funded with spending cuts and tax increases. Managed care stocks responded with gains for the near-term, however the uncharacteristically poor perform ace of the healthcare group during the most recent period of economic uncertainty has been discussed numerous times in this commentary. The HMO group was just featured in the Industry Group Watch section of Wednesday's After Market Update (read here). Treasury Secretary Geithner's testimony before Congress Thursday suggested that policymakers are in a position to evolve their strategy with the goal of repairing and rebuilding the economy's foundation for future growth. He also said that it is unlikely more bank bailout money will be needed, so its contingency provision can be removed from the budget.
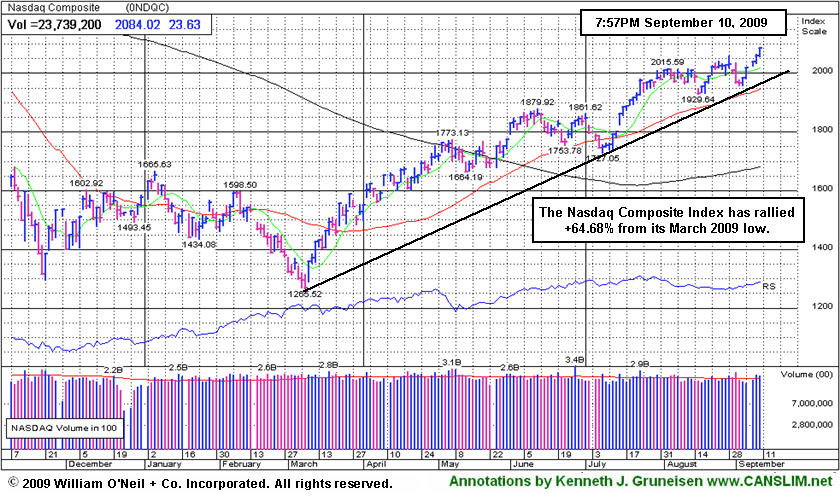
PICTURED: The Nasdaq Composite Index has rallied +64.68% from its March 2009 low.
|
 Kenneth J. Gruneisen started out as a licensed stockbroker in August 1987, a couple of months prior to the historic stock market crash that took the Dow Jones Industrial Average down -22.6% in a single day. He has published daily fact-based fundamental and technical analysis on high-ranked stocks online for two decades. Through FACTBASEDINVESTING.COM, Kenneth provides educational articles, news, market commentary, and other information regarding proven investment systems that work in good times and bad.
Comments contained in the body of this report are technical opinions only and are not necessarily those of Gruneisen Growth Corp. The material herein has been obtained from sources believed to be reliable and accurate, however, its accuracy and completeness cannot be guaranteed. Our firm, employees, and customers may effect transactions, including transactions contrary to any recommendation herein, or have positions in the securities mentioned herein or options with respect thereto. Any recommendation contained in this report may not be suitable for all investors and it is not to be deemed an offer or solicitation on our part with respect to the purchase or sale of any securities. |
|
 |
Networking Index Sets Strong Pace, Up +110% From 2009 Lows
Kenneth J. Gruneisen - Passed the CAN SLIM® Master's Exam
Thursday's mostly higher session had participation from a broad variety of industry groups, with defensive groups setting the strongest pace. The Healthcare Index ($HMO +3.54%) and the Gold & Silver Index ($XAU +3.21%) posted better than +3% gains, and the Integrated Oil Index ($XOI +1.28%) and Oil Services Index ($OSX +1.80%) rose as energy-related shares finished mostly higher. The Networking Index ($NWX +3.37%) set a strong pace for the tech sector, and the Internet Index ($IIX +1.93%) and Semiconductor Index ($SOX +1.78%) also posed solid gains. A modestly positive bias in the influential financial group helped the Bank Index ($BKX +0.53%) and Broker/Dealer Index ($XBD +0.91%) post modest gains along with the Retail Index ($RLX +0.58%). The Biotechnology Index ($BTK -0.15%) ended with a slight loss, making it a standout laggard.
Charts courtesy www.stockcharts.com
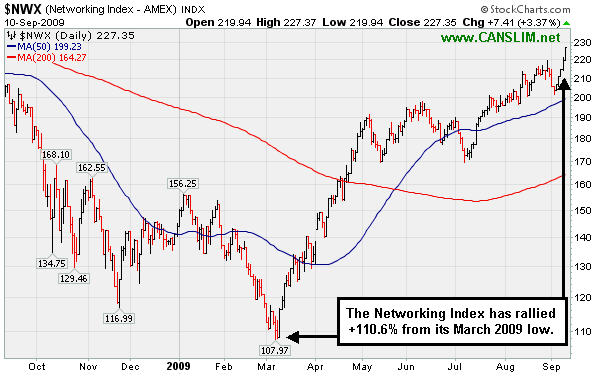
PICTURED: The Networking Index ($NWX +3.37%) has rallied +110.6% from its March 2009 low.
| Oil Services |
$OSX |
183.97 |
+3.25 |
+1.80% |
+51.55% |
| Healthcare |
$HMO |
1,274.70 |
+43.57 |
+3.54% |
+32.76% |
| Integrated Oil |
$XOI |
1,023.87 |
+12.98 |
+1.28% |
+4.51% |
| Semiconductor |
$SOX |
325.82 |
+5.69 |
+1.78% |
+53.57% |
| Networking |
$NWX |
227.35 |
+7.41 |
+3.37% |
+58.00% |
| Internet |
$IIX |
212.29 |
+4.01 |
+1.93% |
+58.70% |
| Broker/Dealer |
$XBD |
115.83 |
+1.04 |
+0.91% |
+49.52% |
| Retail |
$RLX |
375.48 |
+2.17 |
+0.58% |
+34.46% |
| Gold & Silver |
$XAU |
167.07 |
+5.19 |
+3.21% |
+34.90% |
| Bank |
$BKX |
45.95 |
+0.24 |
+0.53% |
+3.68% |
| Biotech |
$BTK |
935.16 |
-1.45 |
-0.15% |
+44.50% |
|
|
|
 |
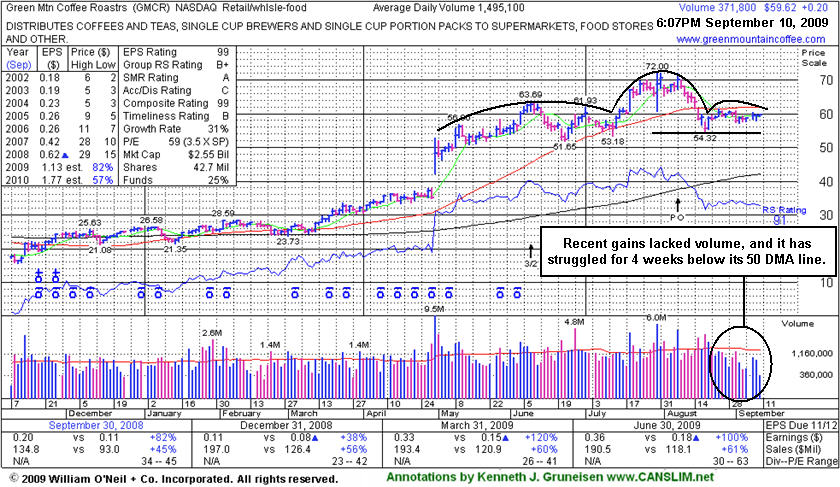
Struggling Below 50 Day Average 4 Weeks With Lack Of Volume Behind Gains
Kenneth J. Gruneisen - Passed the CAN SLIM® Master's Exam
Green Mountain Coffee Roasters (GMCR +$0.20 or +0.34% to $59.62) has been hovering in a tight trading range for the past 4 weeks under its 50-day moving average (DMA) line with volume drying up. As previously noted, "a violation of its prior chart low ($54.32 on 8/18/09) would complete a bearish 'head-and-shoulders' pattern and may trigger more worrisome technical sell signals." It last appearance in this FSU section on 8/26/09 (read here) came under the headline, "Coffee Stock Cooling Off Since Share Offering Recently Completed", which described some current concerns that have arisen since GMCR traded up more than +168% since appearing with an annotated graph under the headline "It May Soon Be Time To Go Green" when featured in the January 2009 CANSLIM.net News (read here).
After a stock slumps under its 50 DMA line its outlook becomes increasingly questionable the longer it stays trading under its 50 DMA line. That important short-term average can be a source of near-term technical resistance, so for its outlook to improve, GMCR now needs to produce gains to get back above it. Meanwhile, the next support is at prior chart lows in the $54-53 area, where violations would trigger additional sell signals and raise more serious concerns. As previously noted, "Its gap down and considerable loss on 8/17/09 on heavy volume triggered technical sell signals."
|
|
|
Color Codes Explained :
Y - Better candidates highlighted by our
staff of experts.
G - Previously featured
in past reports as yellow but may no longer be buyable under the
guidelines.
***Last / Change / Volume quote data in this table corresponds with the timestamp on the note***
Symbol/Exchange
Company Name
Industry Group |
Last |
Chg. |
Vol
% DAV |
Date Featured |
Price Featured |
Latest Pivot Point
Featured |
Status |
| Latest Max Buy Price |
ARO
- NYSE
Aeropostale Inc
RETAIL - Apparel Stores
|
$42.24
|
-0.06
|
2,153,729
72% DAV
2,972,200
|
8/21/2009
(Date
Featured) |
$39.21
(Price
Featured) |
PP = $38.84 |
G |
| MB = $40.78 |
Most Recent Note - 9/10/2009 4:03:31 PM
G - This high-ranked leader in the Retail - Clothing/shoe group has held its ground near all-time highs for the past week. It found support at prior highs in the $38 area on a healthy pullback after first triggering a technical buy signal when featured in yellow in the 8/21/09 Mid-Day BreakOuts Report (read here).
>>> The latest Featured Stock Update with an annotated graph appeared on 9/2/2009. click here.
|
|
C
A
S
I |
News |
Chart |
SEC
View all notes Alert
me of new notes
Company
Profile
|
ARST
-
|
$22.67
|
-0.23
|
480,284
66% DAV
732,200
|
9/1/2009
(Date
Featured) |
$19.91
(Price
Featured) |
PP = $20.90 |
G |
| MB = $21.95 |
Most Recent Note - 9/10/2009 4:05:33 PM
G - Hovering at all-time highs with volume drying up since its considerable gain on 9/04/09 with nearly 3 times average volume triggered a technical buy signal. Featured in yellow in the 9/01/09 Mid-Day BreakOuts Report with an annotated daily graph (read here) and it was also featured with more detailed analysis in the September 2009 CANSLIM.net News with an annotated weekly graph (read here).
>>> The latest Featured Stock Update with an annotated graph appeared on 9/4/2009. click here.
|
|
C
A
S
I |
News |
Chart |
SEC
View all notes Alert
me of new notes
Company
Profile
|
BIDU
- NASDAQ
Baidu Inc Ads
INTERNET - Internet Information Providers
|
$372.45
|
+8.85
|
2,056,877
116% DAV
1,768,400
|
9/8/2009
(Date
Featured) |
$351.80
(Price
Featured) |
PP = $368.59 |
Y |
| MB = $387.02 |
Most Recent Note - 9/10/2009 4:46:33 PM
Y - Gain today with only +16% above average volume extended its winning streak to 6 days as it rose above its pivot point on the right side of its 6-week flat base. However, proper technical buy signals require at least +50% above average volume, preferably more. BIDU was featured again in yellow in the 9/08/09 Mid-Day BreakOuts Report (read here). This high-ranked leader has a solid quarterly and annual earnings history, but a clear sequential deceleration in its increases is a concern. Based on weak technical action it was dropped from the Featured Stocks list on 1/11/08, when it was trading at $329, and it has rebounded very impressively from its January 2009 lows near $100.
>>> The latest Featured Stock Update with an annotated graph appeared on 9/8/2009. click here.
|
|
C
A
S
I |
News |
Chart |
SEC
View all notes Alert
me of new notes
Company
Profile
|
CPLA
- NASDAQ
Capella Education Co
DIVERSIFIED SERVICES - Education and Training Services
|
$63.44
|
-0.72
|
117,899
67% DAV
176,000
|
7/9/2009
(Date
Featured) |
$59.69
(Price
Featured) |
PP = $62.06 |
Y |
| MB = $65.16 |
Most Recent Note - 9/10/2009 4:48:24 PM
Y - Quietly consolidating above support offered by its 50 DMA line and prior chart highs. Still trading in a tight range on light volume near its pivot point, within close striking range of its 52-week high. The Commercial Services-Schools Group has shown some isolated leadership which is somewhat reassuring for the L criteria, but the groups still has low ranks and CPLA's Relative Strength rank has slumped to 61, under the 80+ guideline. Its small supply of only 13.9 million shares in the float could contribute to greater price volatility in the event of institutional accumulation or distribution. The number of top-rated funds owning an interest rose from 91 in Sept '08, to 138 as of June '09, which is reassuring with respect to the I criteria. It has a very good earnings history that satisfies the C & A criteria.
>>> The latest Featured Stock Update with an annotated graph appeared on 9/3/2009. click here.
|
|
C
A
S
I |
News |
Chart |
SEC
View all notes Alert
me of new notes
Company
Profile
|
CRM
- NYSE
Salesforce.com Inc
INTERNET - Internet Software & Services
|
$56.42
|
+0.94
|
2,246,222
115% DAV
1,945,600
|
8/16/2009
(Date
Featured) |
$47.12
(Price
Featured) |
PP = $45.59 |
G |
| MB = $47.87 |
Most Recent Note - 9/10/2009 4:52:40 PM
G - Today's gain on average volume was its 6th consecutive gain and another new high close for 2009. Quietly rising from a "3-weeks tight" type pattern of consolidation following its "breakaway gap" for a considerable gain on 8/21/09 with more than 5 times average volume. Prior to its latest earnings news and powerful technical breakout, members were alerted with detailed analysis and an annotated graph in a Stock Bulletin published on 8/16/09 (read here).
>>> The latest Featured Stock Update with an annotated graph appeared on 8/31/2009. click here.
|
|
C
A
S
I |
News |
Chart |
SEC
View all notes Alert
me of new notes
Company
Profile
|
EBIX
- NASDAQ
Ebix Inc
COMPUTER SOFTWARE & SERVICES - Business Software & Services
|
$53.61
|
+3.54
|
463,599
435% DAV
106,600
|
8/28/2009
(Date
Featured) |
$45.86
(Price
Featured) |
PP = $45.35 |
G |
| MB = $47.62 |
Most Recent Note - 9/10/2009 5:27:04 PM
G - After a considerable loss on heavy volume on the prior session, today it fell as low as $46.25, briefly trading under its $47.62 "max buy" level, then positively reversed for a big gain on 4 times average volume and its second best close ever. EBIX rallied as much as +19.76% since featured in yellow in the 8/28/09 Mid-Day BreakOuts Report (read here).
>>> The latest Featured Stock Update with an annotated graph appeared on 8/28/2009. click here.
|
|
C
A
S
I |
News |
Chart |
SEC
View all notes Alert
me of new notes
Company
Profile
|
GMCR
- NASDAQ
Green Mtn Coffee Roastrs
FOOD & BEVERAGE - Processed & Packaged Goods
|
$59.62
|
+0.20
|
371,902
25% DAV
1,495,100
|
7/17/2009
(Date
Featured) |
$60.15
(Price
Featured) |
PP = $63.79 |
G |
| MB = $66.98 |
Most Recent Note - 9/10/2009 5:32:23 PM
G - Hovering in a tight trading range for the past 4 weeks under its 50 DMA line with volume drying up. As previously noted, "a violation of its prior chart low ($54.32 on 8/18/09) would complete a bearish 'head-and-shoulders' pattern and may trigger more worrisome technical sell signals." GMCR traded up more than +168% since appearing with an annotated graph under the headline "It May Soon Be Time To Go Green" when featured in the January 2009 CANSLIM.net News (read here).
>>> The latest Featured Stock Update with an annotated graph appeared on 9/10/2009. click here.
|
|
C
A
S
I |
News |
Chart |
SEC
View all notes Alert
me of new notes
Company
Profile
|
NTES
- NASDAQ
Netease Inc Adr
INTERNET - Internet Information Providers
|
$44.43
|
-0.52
|
790,228
37% DAV
2,138,700
|
7/17/2009
(Date
Featured) |
$39.29
(Price
Featured) |
PP = $38.74 |
G |
| MB = $40.68 |
Most Recent Note - 9/10/2009 5:34:26 PM
G - Still quietly consolidating above support at its 50 DMA line and above prior chart highs in the $38 area. Deterioration below those levels would raise more serious concerns and triggger additional sell signals.
>>> The latest Featured Stock Update with an annotated graph appeared on 8/27/2009. click here.
|
|
C
A
S
I |
News |
Chart |
SEC
View all notes Alert
me of new notes
Company
Profile
|
NVEC
- NASDAQ
N V E Corp
ELECTRONICS - Semiconductor - Specialized
|
$61.78
|
+4.57
|
193,137
232% DAV
83,100
|
8/26/2009
(Date
Featured) |
$55.32
(Price
Featured) |
PP = $57.60 |
G |
| MB = $60.48 |
Most Recent Note - 9/10/2009 5:40:15 PM
G - A considerable gain today with more that 2 times average volume for this high-ranked leader from the Electronics industry group helped it quickly rise beyond its "max buy" level, and its color code was changed to green. The breakout above its latest pivot point triggered a convincing new technical buy signal. Keep in mind its small supply (the S criteria) of shares outstanding which can contribute to greater than usual volatility. Be mindful of its still rather minuscule sales revenues. These concerns heighten the need for great discipline in trading (buying AND selling).
>>> The latest Featured Stock Update with an annotated graph appeared on 9/1/2009. click here.
|
|
C
A
S
I |
News |
Chart |
SEC
View all notes Alert
me of new notes
Company
Profile
|
PEGA
- NASDAQ
Pegasystems Inc
COMPUTER SOFTWARE & SERVICES - Business Software & Services
|
$31.05
|
-0.09
|
223,449
61% DAV
368,700
|
9/9/2009
(Date
Featured) |
$31.14
(Price
Featured) |
PP = $33.35 |
Y |
| MB = $35.02 |
Most Recent Note - 9/10/2009 5:42:32 PM
Y - This high-ranked Computer Software - Financial firm may be forming an "ascending base" pattern. Its color code was changed to yellow with new pivot point and max buy levels noted. It has been consolidating above the previously cited upward trendline connecting its July-August lows, considered an initial technical support level above its 50 DMA line and prior chart highs. Disciplined investors will watch for a proper new technical buy signal before making initial buys or add-on buys after this 4th stage base.
>>> The latest Featured Stock Update with an annotated graph appeared on 9/9/2009. click here.
|
|
C
A
S
I |
News |
Chart |
SEC
View all notes Alert
me of new notes
Company
Profile
|
|
|
|
THESE ARE NOT BUY RECOMMENDATIONS!
Comments contained in the body of this report are technical
opinions only. The material herein has been obtained
from sources believed to be reliable and accurate, however,
its accuracy and completeness cannot be guaranteed.
This site is not an investment advisor, hence it does
not endorse or recommend any securities or other investments.
Any recommendation contained in this report may not
be suitable for all investors and it is not to be deemed
an offer or solicitation on our part with respect to
the purchase or sale of any securities. All trademarks,
service marks and trade names appearing in this report
are the property of their respective owners, and are
likewise used for identification purposes only.
This report is a service available
only to active Paid Premium Members.
You may opt-out of receiving report notifications
at any time. Questions or comments may be submitted
by writing to Premium Membership Services 665 S.E. 10 Street, Suite 201 Deerfield Beach, FL 33441-5634 or by calling 1-800-965-8307
or 954-785-1121.
|
|
|

