You are not logged in.
This means you
CAN ONLY VIEW reports that were published prior to Tuesday, April 15, 2025.
You
MUST UPGRADE YOUR MEMBERSHIP if you want to see any current reports.
AFTER MARKET UPDATE - WEDNESDAY, SEPTEMBER 9TH, 2009
Previous After Market Report Next After Market Report >>>
|
|
|
|
DOW |
+49.88 |
9,547.22 |
+0.53% |
|
Volume |
1,242,470,220 |
-6% |
|
Volume |
2,509,614,850 |
+22% |
|
NASDAQ |
+22.62 |
2,060.39 |
+1.11% |
|
Advancers |
2,184 |
70% |
|
Advancers |
1,929 |
68% |
|
S&P 500 |
+7.98 |
1,033.37 |
+0.78% |
|
Decliners |
839 |
27% |
|
Decliners |
794 |
28% |
|
Russell 2000 |
+10.02 |
586.40 |
+1.74% |
|
52 Wk Highs |
172 |
|
|
52 Wk Highs |
89 |
|
|
S&P 600 |
+4.27 |
308.24 |
+1.40% |
|
52 Wk Lows |
1 |
|
|
52 Wk Lows |
4 |
|
|
 |
S&P 500 and Nasdaq Composite Indexes Mark New 2009 High Closes
Adam Sarhan, Contributing Writer,
The major averages rallied on Wednesday as the US dollar continued its free fall and the Fed released its Beige Book. Volume totals compared to the prior session were reported higher on the Nasdaq and lower on the NYSE. The S&P 500 Index and the Nasdaq Composite Index both marked fresh 2009 highs. Advancers trumped decliners by over a 2-to-1 ratio on the NYSE and the Nasdaq exchange. There were 36 high-ranked companies from the CANSLIM.net Leaders List that made a new 52-week high and appeared on the CANSLIM.net BreakOuts Page, up solidly from the 22 issues that appeared on the prior session. New 52-week highs still outnumbered new 52-week lows on both exchanges while new lows were in the single digits yet again.
The US dollar slid to a fresh one-year low against six major currencies including the euro, which sent most dollar denominated assets higher. Remember that there tends to be an inverse relationship between a weak dollar and dollar denominated assets since they become more attractive to foreign investors due to favorable exchange rates. A weaker dollar played a pivotal role in the massive increase in commodity prices several years ago.
The Federal Reserve released its Beige Book business survey which is published two weeks before an official meeting and shows how businesses are performing across the country. The survey showed that 11 out of 12 regional banks reported signs of a stable or improving economy in July and August while retail sales were "flat" and labor markets remained "weak." 5 regions "mentioned signs of improvement," which helped support the notion that the economy is recovering.
The S&P 500 Index has rallied +52% from its 12-year low set in early March, and it hit another new 2009 closing high. The Nasdaq Composite Index also charged higher and hit another new 2009 closing high, illustrating that all sell-offs have been nominal and "contained." In more bullish news, famous investor Michael Price, said that today's US stock market resembles 1975-1982, when the S&P 500 doubled. Price said, “We made very good returns from ‘75 to ‘82,” and managed some of the best performing mutual funds during the 1980s and 1990s. He now runs New York-based MFP Investors LLC. Price said in an interview on Bloomberg to "Pick your spots, pick your stocks, do your work, and somebody’s going to be selling something too cheaply." However, high-ranked leadership still remains selective, which is a concern. Ideally, one would like to see a new batch of high-ranked stocks with superior fundamentals trigger fresh technical buy signals as they break out of sound bases in the days and weeks ahead.
PICTURED: The S&P 500 Index enjoyed a fresh high close for 2009!
|
|
|
 |
Tech And Financial Groups Underpin Gains
Kenneth J. Gruneisen - Passed the CAN SLIM® Master's Exam
Technology and financial shares led the market higher as the Semiconductor Index ($SOX +1.08%), Biotechnology Index ($BTK +1.33%), Internet Index ($IIX +1.42%), and Networking Index ($NWX +2.48%) tallied solid gains along with the Bank Index ($BKX +1.38%) and Broker/Dealer Index ($XBD +1.40%). The Retail Index ($RLX +0.64%) also posted a modest gain, helping underpin the major averages' gains. The Oil Services Index ($OSX -0.31%) edged lower while the Integrated Oil Index ($XOI +0.83%) posted a small gain. The Gold & Silver Index ($XAU -2.76%) backpedaled and was a standout laggard group on Wednesday.
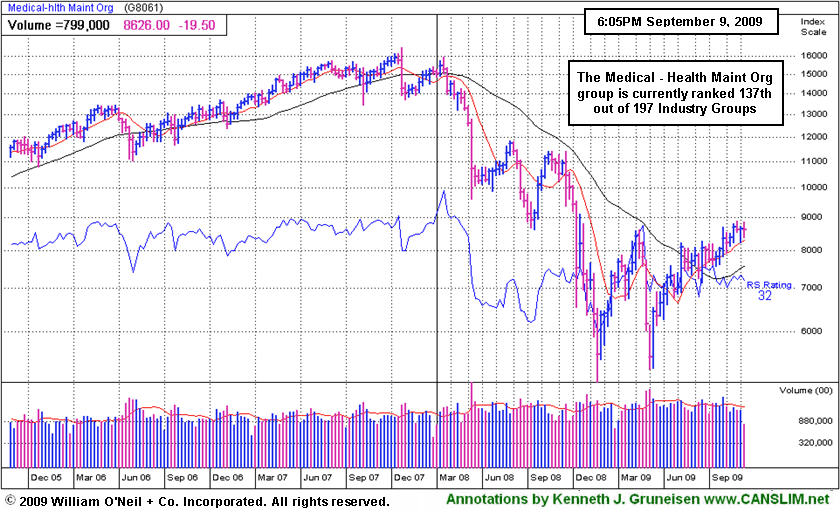
PICTURED: The Medical - Health Maint Org group is currently ranked 137th out of 197 Industry Groups recognized by the newspaper, which indicates that many other industry groups are showing better relative strength. The Healthcare Index ($HMO +2.02%) was among Wednesday's better gainers, but disciplined investors always focus their buying efforts on stocks residing in the top quartile of all industry groups. Historic studies have proven that is where the odds are normally most favorable.
| Oil Services |
$OSX |
180.72 |
-0.57 |
-0.31% |
+48.88% |
| Healthcare |
$HMO |
1,231.13 |
+24.34 |
+2.02% |
+28.22% |
| Integrated Oil |
$XOI |
1,010.89 |
+8.36 |
+0.83% |
+3.19% |
| Semiconductor |
$SOX |
320.13 |
+3.41 |
+1.08% |
+50.88% |
| Networking |
$NWX |
220.02 |
+5.33 |
+2.48% |
+52.91% |
| Internet |
$IIX |
208.28 |
+2.92 |
+1.42% |
+55.70% |
| Broker/Dealer |
$XBD |
114.79 |
+1.58 |
+1.40% |
+48.17% |
| Retail |
$RLX |
373.31 |
+2.39 |
+0.64% |
+33.68% |
| Gold & Silver |
$XAU |
161.88 |
-4.60 |
-2.76% |
+30.71% |
| Bank |
$BKX |
45.71 |
+0.62 |
+1.38% |
+3.14% |
| Biotech |
$BTK |
936.61 |
+12.32 |
+1.33% |
+44.72% |
|
|
|
 |
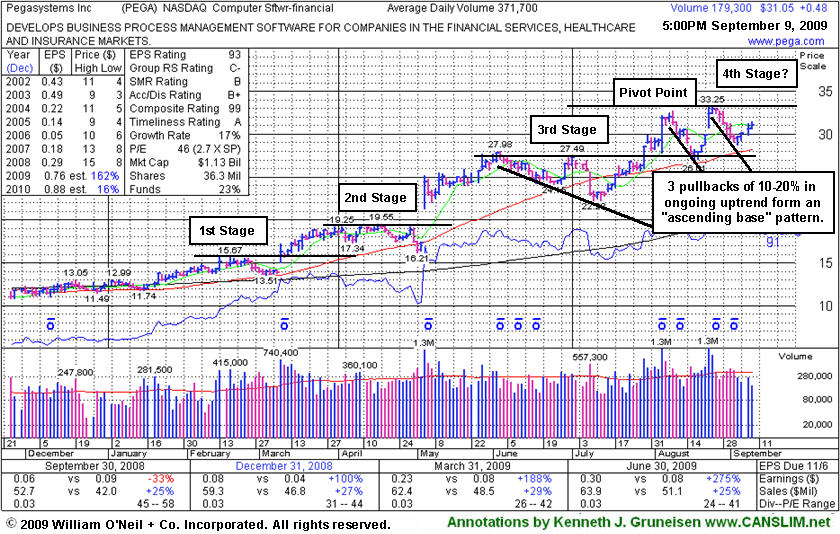
Ascending Base A Possible 4th Stage Set-Up To Watch
Kenneth J. Gruneisen - Passed the CAN SLIM® Master's Exam
Pegasystems Inc (PEGA +$0.57 or +1.86% to $31.14) has been quietly consolidating above its 50-day moving average line, with volume totals drying up since its big 8/24/09 gain. It promptly stalled after clearing its early-August highs and fell back near its short-term average again, yet it proved resilient and found great support during a brief market correction which recently led many leading stocks to break down at key chart support levels. Now an upward trendline (not shown) connecting its July-September chart lows may be watched as an initial chart support level above additional support that might be expected at its 50 DMA line and its recent low ($26.61 on 8/18/09). PEGA may be forming an "ascending base" pattern, so its color code is changed to yellow with new pivot point and max buy levels noted. Ascending bases are formed when an upward trending stock endures 3 pullbacks of 10-20%, each pullback followed by higher highs and higher lows. This analysis is considering the previously cited "double bottom" as the first of three pullbacks, followed by two more recent pullbacks. Therefore, a powerful breakout with volume conviction could trigger a fresh technical buy signal. However, this may also be considered a 4th stage base, and experienced investors know that late stage bases can be more failure prone.
PEGA first triggered a technical buy signal when rising from the "double bottom" base on the day it was featured in the 7/29/09 mid-day report (read here). The Computer Software - Financial firm has shown solid sales revenues increases and +25% earnings increases in the 3 last quarterly comparisons versus the year ago period. The previously noted downturn in annual earnings (the A criteria) from 2003 to 2006 has been followed by a solid turn around and big earnings increases in '07 and '08, and Street expectations for '09 are calling for well above +25% growth.
|
|
|
Color Codes Explained :
Y - Better candidates highlighted by our
staff of experts.
G - Previously featured
in past reports as yellow but may no longer be buyable under the
guidelines.
***Last / Change / Volume quote data in this table corresponds with the timestamp on the note***
Symbol/Exchange
Company Name
Industry Group |
Last |
Chg. |
Vol
% DAV |
Date Featured |
Price Featured |
Latest Pivot Point
Featured |
Status |
| Latest Max Buy Price |
ARO
- NYSE
Aeropostale Inc
RETAIL - Apparel Stores
|
$42.22
|
+0.45
|
2,656,590
87% DAV
3,062,100
|
8/21/2009
(Date
Featured) |
$39.21
(Price
Featured) |
PP = $38.84 |
G |
| MB = $40.78 |
Most Recent Note - 9/9/2009 4:16:37 PM
G - This high-ranked leader in the Retail - Clothing/shoe group posted another small gain today on average volume for a new high close. It found support at prior highs in the $38 area on a healthy pullback after first triggering a technical buy signal when featured in yellow with new pivot point and max buy levels noted in the 8/21/09 Mid-Day BreakOuts Report (read here).
>>> The latest Featured Stock Update with an annotated graph appeared on 9/2/2009. click here.
|
|
C
A
S
I |
News |
Chart |
SEC
View all notes Alert
me of new notes
Company
Profile
|
ARST
-
|
$22.90
|
-0.07
|
735,890
96% DAV
768,900
|
9/1/2009
(Date
Featured) |
$19.91
(Price
Featured) |
PP = $20.90 |
G |
| MB = $21.95 |
Most Recent Note - 9/9/2009 4:18:42 PM
G - Held its ground today after gains with above average volume lifted it to new all-time highs beyond its max buy level. A considerable gain on 9/04/09 with nearly 3 times average volume triggered a technical buy signal after reporting results for the quarter ended July 31, 2009. Featured in yellow in the 9/01/09 Mid-Day BreakOuts Report with an annotated daily graph (read here) and it was also featured with more detailed analysis in the September 2009 CANSLIM.net News with an annotated weekly graph (read here).
>>> The latest Featured Stock Update with an annotated graph appeared on 9/4/2009. click here.
|
|
C
A
S
I |
News |
Chart |
SEC
View all notes Alert
me of new notes
Company
Profile
|
BIDU
- NASDAQ
Baidu Inc Ads
INTERNET - Internet Information Providers
|
$363.60
|
+6.45
|
2,008,716
115% DAV
1,748,700
|
9/8/2009
(Date
Featured) |
$351.80
(Price
Featured) |
PP = $368.59 |
Y |
| MB = $387.02 |
Most Recent Note - 9/9/2009 4:25:17 PM
Y - Gain today with near average volume extended its winning streak to 5 days, rallying near its 52 week high on the right side of its 6-week flat base. The latest test of its 50 DMA line acted as firm support again, as it did in July. BIDU was featured again in yellow in the 9/08/09 Mid-Day BreakOuts Report (read here). This high-ranked leader has a solid quarterly and annual earnings history, but a clear sequential deceleration in its increases is a concern. Based on weak technical action it was dropped from the Featured Stocks list on 1/11/08, when it was trading at $329, and it has rebounded very impressively from its January 2009 lows near $100.
>>> The latest Featured Stock Update with an annotated graph appeared on 9/8/2009. click here.
|
|
C
A
S
I |
News |
Chart |
SEC
View all notes Alert
me of new notes
Company
Profile
|
CPLA
- NASDAQ
Capella Education Co
DIVERSIFIED SERVICES - Education and Training Services
|
$64.16
|
+1.00
|
106,152
58% DAV
183,500
|
7/9/2009
(Date
Featured) |
$59.69
(Price
Featured) |
PP = $62.06 |
Y |
| MB = $65.16 |
Most Recent Note - 9/9/2009 4:26:38 PM
Y - Second consecutive gain on light volume, staying above support offered by its 50 DMA line and prior chart highs. Still trading in a tight range on light volume near its pivot point, within close striking range of its 52-week high. The Commercial Services-Schools Group has shown some isolated leadership which is somewhat reassuring for the L criteria, but the groups still has low ranks and CPLA's Relative Strength rank has slumped to 59, under the 80+ guideline. Its small supply of only 13.9 million shares in the float could contribute to greater price volatility in the event of institutional accumulation or distribution. The number of top-rated funds owning an interest rose from 91 in Sept '08, to 138 as of June '09, which is reassuring with respect to the I criteria. It has a very good earnings history that satisfies the C & A criteria.
>>> The latest Featured Stock Update with an annotated graph appeared on 9/3/2009. click here.
|
|
C
A
S
I |
News |
Chart |
SEC
View all notes Alert
me of new notes
Company
Profile
|
CRM
- NYSE
Salesforce.com Inc
INTERNET - Internet Software & Services
|
$55.48
|
+1.03
|
2,196,040
115% DAV
1,909,900
|
8/16/2009
(Date
Featured) |
$47.12
(Price
Featured) |
PP = $45.59 |
G |
| MB = $47.87 |
Most Recent Note - 9/9/2009 4:32:28 PM
G - Gain on average volume again today for another new high close for 2009, quietly rising from a "3-weeks tight" type pattern of consolidation following its "breakaway gap" for a considerable gain on 8/21/09 with more than 5 times average volume. Prior to its latest earnings news and powerful technical breakout, members were alerted with detailed analysis and an annotated graph in a Stock Bulletin published on 8/16/09 (read here).
>>> The latest Featured Stock Update with an annotated graph appeared on 8/31/2009. click here.
|
|
C
A
S
I |
News |
Chart |
SEC
View all notes Alert
me of new notes
Company
Profile
|
EBIX
- NASDAQ
Ebix Inc
COMPUTER SOFTWARE & SERVICES - Business Software & Services
|
$50.07
|
-3.98
|
450,853
460% DAV
98,100
|
8/28/2009
(Date
Featured) |
$45.86
(Price
Featured) |
PP = $45.35 |
G |
| MB = $47.62 |
Most Recent Note - 9/9/2009 4:34:42 PM
G - Considerable loss on heavy volume today broke its 12-session winning streak that was noted as "very extended from its latest base." Prior chart highs near $46 are an important support level to watch on pullbacks. EBIX rallied as much as +19.76% since featured in yellow in the 8/28/09 Mid-Day BreakOuts Report (read here).
>>> The latest Featured Stock Update with an annotated graph appeared on 8/28/2009. click here.
|
|
C
A
S
I |
News |
Chart |
SEC
View all notes Alert
me of new notes
Company
Profile
|
GMCR
- NASDAQ
Green Mtn Coffee Roastrs
FOOD & BEVERAGE - Processed & Packaged Goods
|
$59.42
|
+0.05
|
845,706
53% DAV
1,584,300
|
7/17/2009
(Date
Featured) |
$60.15
(Price
Featured) |
PP = $63.79 |
G |
| MB = $66.98 |
Most Recent Note - 9/9/2009 4:39:09 PM
G - Still trading under its 50 DMA line, with recent gains lacking volume conviction. As previously noted, "a violation of its prior chart low ($54.32 on 8/18/09) would complete a bearish 'head-and-shoulders' pattern and trigger more worrisome technical sell signals." GMCR traded up more than +168% since appearing with an annotated graph under the headline "It May Soon Be Time To Go Green" when featured in the January 2009 CANSLIM.net News (read here).
>>> The latest Featured Stock Update with an annotated graph appeared on 8/26/2009. click here.
|
|
C
A
S
I |
News |
Chart |
SEC
View all notes Alert
me of new notes
Company
Profile
|
NTES
- NASDAQ
Netease Inc Adr
INTERNET - Internet Information Providers
|
$44.95
|
+0.72
|
1,405,051
65% DAV
2,154,700
|
7/17/2009
(Date
Featured) |
$39.29
(Price
Featured) |
PP = $38.74 |
G |
| MB = $40.68 |
Most Recent Note - 9/9/2009 4:40:54 PM
G - Posted a 3rd consecutive gain today on lighter than average volume. It has been quietly consolidating above support at its 50 DMA line and above prior chart highs in the $38 area. Deterioration below those levels would raise more serious concerns and triggger additional sell signals.
>>> The latest Featured Stock Update with an annotated graph appeared on 8/27/2009. click here.
|
|
C
A
S
I |
News |
Chart |
SEC
View all notes Alert
me of new notes
Company
Profile
|
NVEC
- NASDAQ
N V E Corp
ELECTRONICS - Semiconductor - Specialized
|
$57.21
|
+2.32
|
82,226
94% DAV
87,500
|
8/26/2009
(Date
Featured) |
$55.32
(Price
Featured) |
PP = $57.60 |
Y |
| MB = $60.48 |
Most Recent Note - 9/9/2009 4:46:48 PM
Y - Posted a 5th consecutive gain today with average volume for a new high close just shy of its pivot point. Disciplined investors will resist the urge to more "early" and watch for the stock to produce solid gains above its latest pivot point backed by heavy volume to trigger a convincing new technical buy signal and break out from its latest orderly base above its 50 DMA line. Quarterly sales revenues in the 6 million dollar range are still rather minuscule, leaving concerns.
>>> The latest Featured Stock Update with an annotated graph appeared on 9/1/2009. click here.
|
|
C
A
S
I |
News |
Chart |
SEC
View all notes Alert
me of new notes
Company
Profile
|
PEGA
- NASDAQ
Pegasystems Inc
COMPUTER SOFTWARE & SERVICES - Business Software & Services
|
$31.14
|
+0.57
|
181,492
49% DAV
373,700
|
9/9/2009
(Date
Featured) |
$31.14
(Price
Featured) |
PP = $33.35 |
Y |
| MB = $35.02 |
Most Recent Note - 9/9/2009 4:58:03 PM
Y - This high-ranked Computer Software - Financial firm may be forming an "ascending base" pattern, so its color code is changed to yellow with new pivot point and max buy levels noted. It has been consolidating above the previously cited upward trendline connecting its July-August lows that is considered an initial technical support level above its 50 DMA line and prior chart highs. Disciplined investors will watch for a proper new technical buy signal before making initial buys or add-on buys after this 4th stage base.
>>> The latest Featured Stock Update with an annotated graph appeared on 9/9/2009. click here.
|
|
C
A
S
I |
News |
Chart |
SEC
View all notes Alert
me of new notes
Company
Profile
|
|
|
|
THESE ARE NOT BUY RECOMMENDATIONS!
Comments contained in the body of this report are technical
opinions only. The material herein has been obtained
from sources believed to be reliable and accurate, however,
its accuracy and completeness cannot be guaranteed.
This site is not an investment advisor, hence it does
not endorse or recommend any securities or other investments.
Any recommendation contained in this report may not
be suitable for all investors and it is not to be deemed
an offer or solicitation on our part with respect to
the purchase or sale of any securities. All trademarks,
service marks and trade names appearing in this report
are the property of their respective owners, and are
likewise used for identification purposes only.
This report is a service available
only to active Paid Premium Members.
You may opt-out of receiving report notifications
at any time. Questions or comments may be submitted
by writing to Premium Membership Services 665 S.E. 10 Street, Suite 201 Deerfield Beach, FL 33441-5634 or by calling 1-800-965-8307
or 954-785-1121.
|
|
|


