You are not logged in.
This means you
CAN ONLY VIEW reports that were published prior to Thursday, May 1, 2025.
You
MUST UPGRADE YOUR MEMBERSHIP if you want to see any current reports.
AFTER MARKET UPDATE - MONDAY, SEPTEMBER 9TH, 2013
Previous After Market Report Next After Market Report >>>
|
|
|
|
DOW |
+140.62 |
15,063.12 |
+0.94% |
|
Volume |
638,731,440 |
-5% |
|
Volume |
1,616,880,830 |
-3% |
|
NASDAQ |
+46.19 |
3,706.20 |
+1.26% |
|
Advancers |
2,413 |
78% |
|
Advancers |
1,929 |
74% |
|
S&P 500 |
+16.54 |
1,671.71 |
+1.00% |
|
Decliners |
603 |
19% |
|
Decliners |
621 |
24% |
|
Russell 2000 |
+16.53 |
1,046.08 |
+1.61% |
|
52 Wk Highs |
150 |
|
|
52 Wk Highs |
150 |
|
|
S&P 600 |
+8.87 |
590.24 |
+1.53% |
|
52 Wk Lows |
26 |
|
|
52 Wk Lows |
16 |
|
|
 |
Breadth Positive as Nasdaq Leads Gains Confirming Market Rally
Kenneth J. Gruneisen - Passed the CAN SLIM® Master's Exam
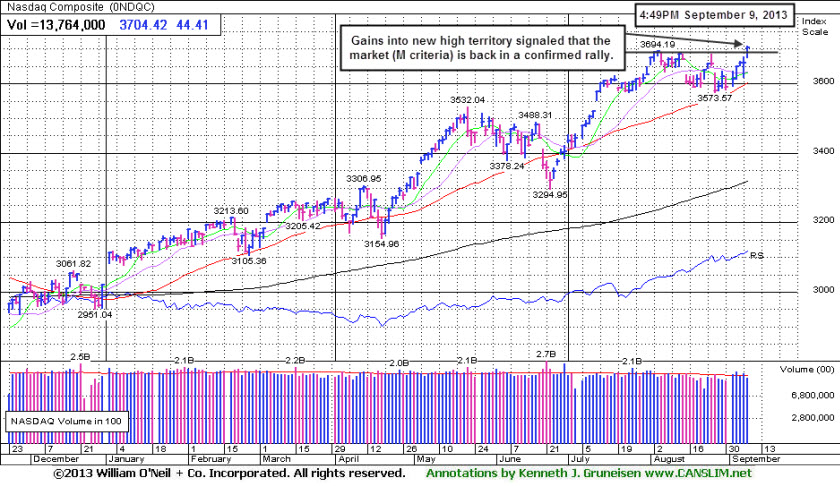
The major averages finished Monday's session with gains and the Nasdaq Composite Index ended higher by 46 points at 3,706, surging to new 2013 highs, signaling an encouraging shift as the market (M criteria) returned to a confirmed rally. The volume totals were reported lighter than the prior session totals on the NYSE and on the Nasdaq exchange, however, still leaving some questions as to the level of fresh institutional buying conviction. Breadth was clearly positive as advancers led decliners by nearly a 4-1 margin on the NYSE and by more than 3-1 on the Nasdaq exchange. There were 52 high-ranked companies from the CANSLIM.net Leaders List that made new 52-week highs and appeared on the CANSLIM.net BreakOuts Page, a fair expansion in leadership from a total of 37 stocks on the prior session. The list of stocks hitting new 52-week highs outnumbered new lows on the NYSE and on the Nasdaq exchange. There were gains for 13 of the 18 high-ranked companies currently included on the Featured Stocks Page.
As the major averages held their gains into the closing bell, the Dow Jones Industrial Average advanced 140 points to close the session at 15,063, its best level since mid-August. It remains below its 50-day moving average (DMA) line while the other major indices are both in healthier shape. The S&P 500 Index rebounded above its 50-day moving average (DMA) line, improving its technical stance on Monday. Equity markets steadily climbed throughout the session as investors overlooked ongoing tensions surrounding Syria. A better-than-expected report on Chinese exports helped boost sentiment.
All 10 sectors on the S&P closed higher, led by gains in material stocks. Freeport-McMoRan Copper & Gold Inc (FCX +2.1%) rose as copper prices edged higher. Shares of Apple Inc (AAPL +1.6%) were active in the session, rising ahead of their highly anticipated product event Tuesday. On the M&A front, Molex Inc (MOLX +31.6%) rallied after the company announced that it was being acquired by Koch Industries in a $7.2 billion deal.
Turning to fixed income markets, Treasuries were higher along the curve. The benchmark 10-year note was up 7/32 to yield 2.92% and the 30-year bond added about 1/4 of a point to yield 3.86%.
New buying efforts in stocks are justified under the fact-based system. Stay familiar with companies listed on the CANSLIM.net Featured Stocks Page - a page showing the most action-worthy candidates' latest notes and links to additional resources including detailed analysis with data-packed graphs which are annotated by a Certified expert. The Premium Member Homepage - includes "dynamic archives" to all prior pay reports published. Watch for an announcement via email concerning the next WEBCAST.
PICTURED: The Nasdaq Composite Index surged to new 2013 highs, signaling that the market (M criteria) is again in a confirmed rally.
|
 Kenneth J. Gruneisen started out as a licensed stockbroker in August 1987, a couple of months prior to the historic stock market crash that took the Dow Jones Industrial Average down -22.6% in a single day. He has published daily fact-based fundamental and technical analysis on high-ranked stocks online for two decades. Through FACTBASEDINVESTING.COM, Kenneth provides educational articles, news, market commentary, and other information regarding proven investment systems that work in good times and bad.
Comments contained in the body of this report are technical opinions only and are not necessarily those of Gruneisen Growth Corp. The material herein has been obtained from sources believed to be reliable and accurate, however, its accuracy and completeness cannot be guaranteed. Our firm, employees, and customers may effect transactions, including transactions contrary to any recommendation herein, or have positions in the securities mentioned herein or options with respect thereto. Any recommendation contained in this report may not be suitable for all investors and it is not to be deemed an offer or solicitation on our part with respect to the purchase or sale of any securities. |
|
 |
Financial, Tech, Retail, and Energy-Related Groups Rose
Kenneth J. Gruneisen - Passed the CAN SLIM® Master's Exam
Gains from the Broker/Dealer Index ($XBD +1.52%) and the Bank Index ($BKX +0.51%) underpinned the major averages gains on Monday. The Retail Index ($RLX +1.09%) rose and the tech sector saw unanimous gains from the Networking Index ($NWX +1.69%), Biotechnology Index ($BTK +2.49%), Semiconductor Index ($SOX +1.33%), and the Internet Index ($IIX +1.42%). Energy-related shares had a positive bias as the Oil Services Index ($OSX +1.52%) and the Integrated Oil Index ($XOI +0.79%) ratcheted higher. Meanwhile, defensive groups lagged as the Gold & Silver Index ($XAU -0.80%) and the Healthcare Index ($HMO -0.29%) both ended with small losses on Monday.
Charts courtesy www.stockcharts.com

PICTURED: The Biotechnology Index ($BTK +2.49%) rallied to new 2013 highs.
| Oil Services |
$OSX |
271.48 |
+4.07 |
+1.52% |
+23.31% |
| Healthcare |
$HMO |
3,465.67 |
-10.08 |
-0.29% |
+37.84% |
| Integrated Oil |
$XOI |
1,400.25 |
+11.04 |
+0.79% |
+12.76% |
| Semiconductor |
$SOX |
481.42 |
+6.32 |
+1.33% |
+25.35% |
| Networking |
$NWX |
297.25 |
+4.95 |
+1.69% |
+31.21% |
| Internet |
$IIX |
411.92 |
+5.78 |
+1.42% |
+25.97% |
| Broker/Dealer |
$XBD |
138.35 |
+2.08 |
+1.52% |
+46.67% |
| Retail |
$RLX |
828.23 |
+8.89 |
+1.09% |
+26.82% |
| Gold & Silver |
$XAU |
102.19 |
-0.82 |
-0.80% |
-38.29% |
| Bank |
$BKX |
63.48 |
+0.32 |
+0.51% |
+23.79% |
| Biotech |
$BTK |
2,213.40 |
+53.78 |
+2.49% |
+43.07% |
|
|
|
 |
Following Technical Breakout Broader Market Confirms Rally
Kenneth J. Gruneisen - Passed the CAN SLIM® Master's Exam
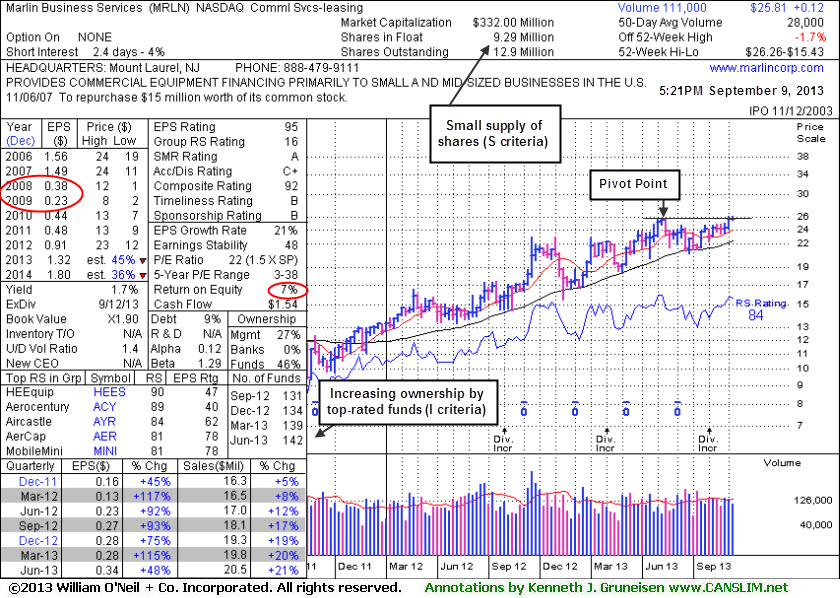
Marlin Business Services (MRLN +$0.12 or +0.47% to $25.81) was highlighted in yellow with an annotated daily graph showing the new pivot point cited based on its May '13 highs plus 10 cents in the earlier mid-day report (read here) while noted - "Technically, it broke out with a volume-driven gain on 9/05/13." Disciplined investors always avoid chasing stocks after they rise more than +5% above prior highs.
MRLN's fundamentals remain strong and it found support near its 200-day moving average (DMA) line since dropped from the Featured Stocks list on 6/21/13. Recent quarterly comparisons through Jun '13 show strong earnings increases above the +25% minimum guideline satisfying the C criteria. Annual earnings (A criteria) growth has improved following the downturn in FY '08 and '09 (see red circle). It was last shown in this FSU section on 6/11/13 under the headline, "Found Support After Undercutting 50-Day Moving Average", but subsequent losses undercut a noted low ($21.49 on 5/23/13) raising more serious concerns.
The broader market (M criteria) has technically shifted into a confirmed rally, arguing in favor of new buying efforts again - see more in today's Market Commentary section. However, MRLN hails from the Commercial Services - Leasing group which now has a 16 Group Relative Strength Rating, not a good sign concerning the L criteria. Return-On-Equity (see small red circle) is below the 17% minimum guideline.
With only 9.29 million shares (S criteria) in the publicly traded float it may be particularly volatile in the event of any institutional buying or selling. The number of top-rated funds owning its shares rose from 111 in Mar '12 to 142 in Jun '13, a reassuring sign concerning the I criteria. Its current Up/Down Volume Ratio of 1.4 is an unbiased indication that its shares have been under accumulation over the past 50 days. The weekly graph below gives investors a longer term perspective, and shows it facing no resistance due to overhead supply.
|
|
|
Color Codes Explained :
Y - Better candidates highlighted by our
staff of experts.
G - Previously featured
in past reports as yellow but may no longer be buyable under the
guidelines.
***Last / Change / Volume data in this table is the closing quote data***
Symbol/Exchange
Company Name
Industry Group |
PRICE |
CHANGE
(%Change) |
Day High |
Volume
(% DAV)
(% 50 day avg vol) |
52 Wk Hi
% From Hi |
Featured
Date |
Price
Featured |
Pivot Featured |
|
Max Buy |
BITA
-
NYSE
Bitauto Hldgs Ltd Ads
INTERNET - Internet Information Providers
|
$16.10
|
+0.54
3.47% |
$17.21
|
813,567
295.52% of 50 DAV
50 DAV is 275,300
|
$18.10
-11.05%
|
8/7/2013
|
$12.01
|
PP = $13.30
|
|
MB = $13.97
|
 Most Recent Note - 9/9/2013 12:10:39 PM
G - Gapped up today, rallying for a 3rd consecutive volume-driven gain and poised for a best-ever close. During its choppy consolidation it found support above its 50 DMA line and prior highs.
>>> The latest Featured Stock Update with an annotated graph appeared on 9/3/2013. Click here.
View all notes |
Alert me of new notes |
CANSLIM.net Company Profile |
SEC |
Zacks Reports |
StockTalk |
News |
Chart |
Request a new note
C
A N
S L
I M


|
CELG
-
NASDAQ
Celgene Corp
DRUGS - Drug Manufacturers - Major
|
$148.47
|
+1.50
1.02% |
$148.72
|
2,415,851
97.71% of 50 DAV
50 DAV is 2,472,400
|
$149.92
-0.96%
|
7/11/2013
|
$133.25
|
PP = $131.92
|
|
MB = $138.52
|
Most Recent Note - 9/4/2013 11:55:25 AM
Y - Building a base-on-base type pattern, it recently found support above prior highs in the $131 area and above its 50 DMA line, important chart support levels.
>>> The latest Featured Stock Update with an annotated graph appeared on 8/21/2013. Click here.
View all notes |
Alert me of new notes |
CANSLIM.net Company Profile |
SEC |
Zacks Reports |
StockTalk |
News |
Chart |
Request a new note
C
A N
S L
I M
|
FLT
-
NYSE
Fleetcor Technologies
DIVERSIFIED SERVICES - Business/Management Services
|
$103.21
|
-0.12
-0.12% |
$104.10
|
575,133
93.90% of 50 DAV
50 DAV is 612,500
|
$108.38
-4.77%
|
8/19/2013
|
$99.01
|
PP = $100.97
|
|
MB = $106.02
|
Most Recent Note - 9/6/2013 6:22:32 PM
Y- Consolidating above prior highs after recently rising from an advanced "3-weeks tight" base, albeit a riskier "late stage" base. See the latest FSU analysis for more details and a new annotated graph. Keep in mind the M criteria argues against new buying efforts until a new confirmed rally.
>>> The latest Featured Stock Update with an annotated graph appeared on 9/6/2013. Click here.
View all notes |
Alert me of new notes |
CANSLIM.net Company Profile |
SEC |
Zacks Reports |
StockTalk |
News |
Chart |
Request a new note
C
A N
S L
I M
|
GNRC
-
NYSE
Generac Hldgs Inc
CONSUMER DURABLES - Electronic Equipment
|
$39.99
|
+0.30
0.76% |
$40.04
|
760,383
81.26% of 50 DAV
50 DAV is 935,700
|
$44.30
-9.73%
|
7/30/2013
|
$42.60
|
PP = $42.10
|
|
MB = $44.21
|
Most Recent Note - 9/5/2013 6:51:21 PM
G - Lingering below its 50 DMA line, its color code is changed to green as deterioration raised concerns. Stalled after a recent rally from an advanced "3-weeks tight" base as it priced a Secondary Offering. Disciplined investors always limit losses by selling if any stock falls more than -7% from its purchase price.
>>> The latest Featured Stock Update with an annotated graph appeared on 8/22/2013. Click here.
View all notes |
Alert me of new notes |
CANSLIM.net Company Profile |
SEC |
Zacks Reports |
StockTalk |
News |
Chart |
Request a new note
C
A N
S L
I M
|
KORS
-
NYSE
Michael Kors Hldgs Ltd
RETAIL - Apparel Stores
|
$75.62
|
-0.08
-0.11% |
$76.74
|
3,131,129
87.96% of 50 DAV
50 DAV is 3,559,600
|
$76.22
-0.78%
|
8/6/2013
|
$69.66
|
PP = $66.28
|
|
MB = $69.59
|
Most Recent Note - 9/5/2013 6:52:31 PM
G - Finished at another new high close today with its 6th consecutive gain, getting very extended from any sound base. Prior highs in the $66 area define initial support to watch on pullbacks.
>>> The latest Featured Stock Update with an annotated graph appeared on 8/29/2013. Click here.
View all notes |
Alert me of new notes |
CANSLIM.net Company Profile |
SEC |
Zacks Reports |
StockTalk |
News |
Chart |
Request a new note
C
A N
S L
I M
|
Symbol/Exchange
Company Name
Industry Group |
PRICE |
CHANGE
(%Change) |
Day High |
Volume
(% DAV)
(% 50 day avg vol) |
52 Wk Hi
% From Hi |
Featured
Date |
Price
Featured |
Pivot Featured |
|
Max Buy |
LOPE
-
NASDAQ
Grand Canyon Education
DIVERSIFIED SERVICES - Education and; Training Services
|
$36.10
|
+0.59
1.66% |
$36.49
|
246,684
58.44% of 50 DAV
50 DAV is 422,100
|
$37.17
-2.88%
|
6/19/2013
|
$31.47
|
PP = $34.17
|
|
MB = $35.88
|
Most Recent Note - 9/5/2013 6:53:55 PM
G - Rose to a best-ever close today and inched nearer to its 52-week high with another gain on light volume. Earnings +15% on +19% sales for the Jun '13 quarter, below the +25% minimum earnings guideline (C criteria), raised fundamental concerns, yet technical action has been somewhat reassuring.
>>> The latest Featured Stock Update with an annotated graph appeared on 8/14/2013. Click here.
View all notes |
Alert me of new notes |
CANSLIM.net Company Profile |
SEC |
Zacks Reports |
StockTalk |
News |
Chart |
Request a new note
C
A N
S L
I M
|
MRLN
-
NASDAQ
Marlin Business Services
DIVERSIFIED SERVICES - Rental and Leasing Services
|
$25.81
|
+0.12
0.47% |
$26.24
|
111,011
396.47% of 50 DAV
50 DAV is 28,000
|
$26.26
-1.71%
|
9/9/2013
|
$25.75
|
PP = $26.07
|
|
MB = $27.37
|
Most Recent Note - 9/9/2013 5:56:52 PM
Y - Highlighted in yellow with new pivot point cited based on its May '13 highs plus 10 cents. Technically, it broke out with a volume-driven gain on 9/05/13. The broader market (M criteria) justifies selective new buying efforts with the market shifting to a confirmed rally. Fundamentals remain strong and it found support near its 200 DMA line since dropped from the Featured Stocks list on 6/21/13. See the latest FSU analysis for more details and a new annotated weekly graph.

>>> The latest Featured Stock Update with an annotated graph appeared on 9/9/2013. Click here.
View all notes |
Alert me of new notes |
CANSLIM.net Company Profile |
SEC |
Zacks Reports |
StockTalk |
News |
Chart |
Request a new note
C
A N
S L
I M
|
PCLN
-
NASDAQ
Priceline.Com Inc
INTERNET - Internet Software and Services
|
$965.66
|
+6.51
0.68% |
$968.44
|
389,380
60.07% of 50 DAV
50 DAV is 648,200
|
$994.98
-2.95%
|
7/8/2013
|
$878.28
|
PP = $847.43
|
|
MB = $889.80
|
Most Recent Note - 9/6/2013 6:15:20 PM
G - Consolidating in an orderly fashion above prior highs, building a new base. Reported earnings +24% on +27% sales revenues for the Jun '13 quarter, just under the +25% minimum earnings guideline (C criteria).
>>> The latest Featured Stock Update with an annotated graph appeared on 8/19/2013. Click here.
View all notes |
Alert me of new notes |
CANSLIM.net Company Profile |
SEC |
Zacks Reports |
StockTalk |
News |
Chart |
Request a new note
C
A N
S L
I M
|
PRAA
-
NASDAQ
Portfolio Recovery Assoc
DIVERSIFIED SERVICES - Business/Management Services
|
$57.53
|
+0.84
1.48% |
$57.54
|
441,977
81.20% of 50 DAV
50 DAV is 544,300
|
$57.57
-0.07%
|
7/31/2013
|
$51.43
|
PP = $54.72
|
|
MB = $57.46
|
Most Recent Note - 9/4/2013 1:18:10 PM
Y - Rebounding after a slump below its old high close ($53.86 on 6/17/13) led to a close back in the prior base which raised concerns. Halted its slide above important support at its 50 DMA line.
>>> The latest Featured Stock Update with an annotated graph appeared on 8/28/2013. Click here.
View all notes |
Alert me of new notes |
CANSLIM.net Company Profile |
SEC |
Zacks Reports |
StockTalk |
News |
Chart |
Request a new note
C
A N
S L
I M
|
PRLB
-
NYSE
Proto Labs Inc
MANUFACTURING - Small Tools and Accessories
|
$73.83
|
+1.43
1.98% |
$75.20
|
461,624
109.62% of 50 DAV
50 DAV is 421,100
|
$75.76
-2.55%
|
7/29/2013
|
$64.86
|
PP = $67.50
|
|
MB = $70.88
|
Most Recent Note - 9/9/2013 5:51:21 PM
G - Hovering near its all-time high after rallying beyond its "max buy" level. Support to watch is at prior highs and above its 50 DMA line.
>>> The latest Featured Stock Update with an annotated graph appeared on 8/27/2013. Click here.
View all notes |
Alert me of new notes |
CANSLIM.net Company Profile |
SEC |
Zacks Reports |
StockTalk |
News |
Chart |
Request a new note
C
A N
S L
I M
|
Symbol/Exchange
Company Name
Industry Group |
PRICE |
CHANGE
(%Change) |
Day High |
Volume
(% DAV)
(% 50 day avg vol) |
52 Wk Hi
% From Hi |
Featured
Date |
Price
Featured |
Pivot Featured |
|
Max Buy |
QCOR
-
NASDAQ
Questcor Pharmaceuticals
DRUGS - Biotechnology
|
$67.53
|
+0.74
1.11% |
$67.99
|
584,516
34.55% of 50 DAV
50 DAV is 1,691,700
|
$74.76
-9.67%
|
7/31/2013
|
$66.46
|
PP = $59.01
|
|
MB = $61.96
|
Most Recent Note - 9/9/2013 5:52:49 PM
G - Still holding its ground, extended from any sound base. Recent lows in the $64 area define near-term support to watch above its 50 DMA line.
>>> The latest Featured Stock Update with an annotated graph appeared on 8/26/2013. Click here.
View all notes |
Alert me of new notes |
CANSLIM.net Company Profile |
SEC |
Zacks Reports |
StockTalk |
News |
Chart |
Request a new note
C
A N
S L
I M
|
SFUN
-
NYSE
Soufun Hldgs Ltd Ads A
INTERNET - Internet Information Providers
|
$48.27
|
-1.26
-2.54% |
$50.46
|
640,713
90.45% of 50 DAV
50 DAV is 708,400
|
$50.99
-5.33%
|
7/16/2013
|
$29.54
|
PP = $27.90
|
|
MB = $29.30
|
Most Recent Note - 9/9/2013 5:54:29 PM
G - Pulling back from all-time highs with below average volume following a streak of 5 consecutive gains with above average volume. Very extended from any sound base. Recent highs near $42 define initial support to watch on pullbacks.
>>> The latest Featured Stock Update with an annotated graph appeared on 8/30/2013. Click here.
View all notes |
Alert me of new notes |
CANSLIM.net Company Profile |
SEC |
Zacks Reports |
StockTalk |
News |
Chart |
Request a new note
C
A N
S L
I M
|
SSNC
-
NASDAQ
S S & C Technologies
COMPUTER SOFTWARE and SERVICES - Application Software
|
$36.50
|
+0.55
1.53% |
$36.99
|
352,193
84.58% of 50 DAV
50 DAV is 416,400
|
$38.80
-5.93%
|
9/5/2013
|
$36.01
|
PP = $38.90
|
|
MB = $40.85
|
Most Recent Note - 9/5/2013 6:49:32 PM
Y - New pivot point cited based on its 8/02/13 high plus 10 cents. Subsequent volume-driven gains may trigger a new buy signal. See the latest FSU analysis for more details and a new annotated graph.
>>> The latest Featured Stock Update with an annotated graph appeared on 9/5/2013. Click here.
View all notes |
Alert me of new notes |
CANSLIM.net Company Profile |
SEC |
Zacks Reports |
StockTalk |
News |
Chart |
Request a new note
C
A N
S L
I M
|
SSYS
-
NASDAQ
Stratasys Ltd
COMPUTER HARDWARE - Computer Peripherals
|
$105.22
|
-1.16
-1.09% |
$107.96
|
840,896
98.42% of 50 DAV
50 DAV is 854,400
|
$113.49
-7.29%
|
7/8/2013
|
$91.44
|
PP = $95.00
|
|
MB = $99.75
|
Most Recent Note - 9/4/2013 1:07:15 PM
G - Pulling back today from its all-time high. Repeatedly noted - "Extended from its prior base. Prior highs in the $96 area define initial support to watch on pullbacks."
>>> The latest Featured Stock Update with an annotated graph appeared on 8/16/2013. Click here.
View all notes |
Alert me of new notes |
CANSLIM.net Company Profile |
SEC |
Zacks Reports |
StockTalk |
News |
Chart |
Request a new note
C
A N
S L
I M
|
STMP
-
NASDAQ
Stamps.Com Inc
INTERNET - Internet Software and Services
|
$43.82
|
-0.20
-0.45% |
$44.56
|
175,765
133.97% of 50 DAV
50 DAV is 131,200
|
$46.47
-5.70%
|
7/31/2013
|
$40.00
|
PP = $42.98
|
|
MB = $45.13
|
Most Recent Note - 9/6/2013 6:19:38 PM
Y - Posted a 7th consecutive gain today and ended at a best-ever close. Recently found encouraging support at its 50 DMA line.
>>> The latest Featured Stock Update with an annotated graph appeared on 8/23/2013. Click here.
View all notes |
Alert me of new notes |
CANSLIM.net Company Profile |
SEC |
Zacks Reports |
StockTalk |
News |
Chart |
Request a new note
C
A N
S L
I M
|
Symbol/Exchange
Company Name
Industry Group |
PRICE |
CHANGE
(%Change) |
Day High |
Volume
(% DAV)
(% 50 day avg vol) |
52 Wk Hi
% From Hi |
Featured
Date |
Price
Featured |
Pivot Featured |
|
Max Buy |
TBBK
-
NASDAQ
Bancorp Inc
BANKING - Regional - Mid-Atlantic Banks
|
$17.37
|
+0.19
1.11% |
$17.51
|
195,765
127.37% of 50 DAV
50 DAV is 153,700
|
$17.46
-0.52%
|
9/4/2013
|
$16.26
|
PP = $16.79
|
|
MB = $17.63
|
Most Recent Note - 9/6/2013 6:21:23 PM
Y - Hit another new 52-week high today with its 7th consecutive gain. Triggered a technical buy signal with a breakout gain on 3 times average volume on the prior session, rising from an 8-week base. Prior highs define important near-term support to watch on pullbacks. An annotated graph and more details were included in the FSU section on 9/04/13 under the headline, "Forming Sound Set-Up While "M" Correction Remains Overriding Concern".
>>> The latest Featured Stock Update with an annotated graph appeared on 9/4/2013. Click here.
View all notes |
Alert me of new notes |
CANSLIM.net Company Profile |
SEC |
Zacks Reports |
StockTalk |
News |
Chart |
Request a new note
C
A N
S L
I M
|
VRX
-
NYSE
Valeant Pharmaceuticals
DRUGS - Drug Manufacturers - Other
|
$101.33
|
+1.09
1.09% |
$101.46
|
715,428
55.58% of 50 DAV
50 DAV is 1,287,100
|
$105.40
-3.86%
|
4/30/2013
|
$60.24
|
PP = $76.66
|
|
MB = $80.49
|
Most Recent Note - 9/4/2013 6:22:29 PM
G- Holding its ground -5.2% off its 52-week high and recent insider buying while trading near its highs has been noted as an encouraging sign. Reported earnings +33% on +34% sales revenues for the Jun '13 quarter, above the +25% minimum earnings guideline (C criteria).
>>> The latest Featured Stock Update with an annotated graph appeared on 8/15/2013. Click here.
View all notes |
Alert me of new notes |
CANSLIM.net Company Profile |
SEC |
Zacks Reports |
StockTalk |
News |
Chart |
Request a new note
C
A N
S L
I M
|
YNDX
-
NASDAQ
Yandex N V Class A
INTERNET - Internet Information Providers
|
$35.17
|
+0.93
2.72% |
$35.36
|
1,989,726
81.32% of 50 DAV
50 DAV is 2,446,900
|
$35.24
-0.20%
|
9/5/2013
|
$34.24
|
PP = $34.79
|
|
MB = $36.53
|
Most Recent Note - 9/9/2013 5:48:44 PM
Y - Rallied to a best-ever close and a new 52-week high with today's gain lacking great volume conviction. Found support at its 50 DMA line, important near-term support to watch. It did not form a base of sufficient length, however its color code was changed to yellow while a valid secondary buy point exists up to +5% above its prior high.
>>> The latest Featured Stock Update with an annotated graph appeared on 8/20/2013. Click here.
View all notes |
Alert me of new notes |
CANSLIM.net Company Profile |
SEC |
Zacks Reports |
StockTalk |
News |
Chart |
Request a new note
C
A N
S L
I M
|
|
|
|
THESE ARE NOT BUY RECOMMENDATIONS!
Comments contained in the body of this report are technical
opinions only. The material herein has been obtained
from sources believed to be reliable and accurate, however,
its accuracy and completeness cannot be guaranteed.
This site is not an investment advisor, hence it does
not endorse or recommend any securities or other investments.
Any recommendation contained in this report may not
be suitable for all investors and it is not to be deemed
an offer or solicitation on our part with respect to
the purchase or sale of any securities. All trademarks,
service marks and trade names appearing in this report
are the property of their respective owners, and are
likewise used for identification purposes only.
This report is a service available
only to active Paid Premium Members.
You may opt-out of receiving report notifications
at any time. Questions or comments may be submitted
by writing to Premium Membership Services 665 S.E. 10 Street, Suite 201 Deerfield Beach, FL 33441-5634 or by calling 1-800-965-8307
or 954-785-1121.
|
|
|

