You are not logged in.
This means you
CAN ONLY VIEW reports that were published prior to Monday, April 14, 2025.
You
MUST UPGRADE YOUR MEMBERSHIP if you want to see any current reports.
AFTER MARKET UPDATE - FRIDAY, SEPTEMBER 9TH, 2011
Previous After Market Report Next After Market Report >>>
|
|
|
|
DOW |
-303.68 |
10,992.13 |
-2.69% |
|
Volume |
1,222,064,670 |
+29% |
|
Volume |
2,017,457,720 |
+5% |
|
NASDAQ |
-61.15 |
2,467.99 |
-2.42% |
|
Advancers |
450 |
15% |
|
Advancers |
410 |
15% |
|
S&P 500 |
-31.67 |
1,154.23 |
-2.67% |
|
Decliners |
2,577 |
83% |
|
Decliners |
2,143 |
81% |
|
Russell 2000 |
-20.96 |
673.96 |
-3.02% |
|
52 Wk Highs |
16 |
|
|
52 Wk Highs |
6 |
|
|
S&P 600 |
-11.59 |
369.26 |
-3.04% |
|
52 Wk Lows |
162 |
|
|
52 Wk Lows |
191 |
|
|
 |
Market Sinks Under More Pressure From Financial Group
Kenneth J. Gruneisen - Passed the CAN SLIM® Master's Exam
The rough start to September on Wall Street bears the distinction of being the worst September since S&P began tracking and reporting the data for its benchmark index. The major averages sold off deeply at the open and remained sharply lower throughout Friday's session. For the week, the Dow Jones Industrial Average fell -2.2%, S&P 500 Index lost -1.7%, and the Nasdaq Composite Index finished -0.5% lower. Friday's reported volume totals were heavier on the NYSE and on the Nasdaq exchange, a clear indication of distributional selling from the institutional crowd. Winners were few as declining issues buried advancers by 5-1 on the NYSE and on the Nasdaq exchange. New 52-week lows expanded and substantially outnumbered new 52-week highs on both major exchanges. There were 10 high-ranked companies from the CANSLIM.net Leaders List that made new 52-week highs and appeared on the CANSLIM.net BreakOuts Page, up from the prior session total of 6 stocks. Any sustainable rally requires a healthy crop of strong leaders hitting new 52-week highs, as this commentary has repeated! The contraction in leadership raises some questions about the current rally's strength and its ability to be sustained for a meaningful advance. There was only 1 gainer out of the 8 high-ranked leaders currently included on the Featured Stocks Page.

Stocks were sharply lower after President Obama's jobs plan failed to reassure the markets. Doubts about the impact increased as some in Congress questioned how the plan will be funded. The 10-year Treasury note advanced 16/32 to yield 1.92%, after hitting a record low of 1.89% earlier in the session.
A terrorism threat may have weighed on stocks as well as the possibility of a Greek default. Financial stocks were hit by another round of selling and the euro fell to a six month low against the dollar after German officials said the government was preparing plans to shore up German banks in the event that Greece does default. Disarray among top officials was evident when a key member of the European Central Bank's Executive Board quit after protesting its program of buying stressed government bonds.
Dow component McDonald's Corp (MCD -4.04%) gapped down and violated its 50-day moving average after global sales in August missed forecasts. Chevron Corp (CVX -3.3%) and Alcoa Inc (AA -3.74%) slumped as the rising dollar undermined the appeal of commodities. AOL Inc (AOL -5.28%) is reportedly talking with advisers to Yahoo! Inc (YHOO +0.28%) about combining the companies.
The market environment (M criteria) can barely be considered an uptrend that is under pressure, meanwhile the major averages are at least still sputtering above their Day 1 (8/09/11) lows. Disciplined investors may only want to carefully consider new buying efforts when all key criteria are satisfied, and they may be wise to wait and see more evidence of new leadership before committing sidelined cash to substantial new positions.
The September 2011 issue of CANSLIM.net News will be available soon. The Q3 2011 Webcast has also been scheduled for Wednesday, September 28th at 8PM EST. Links to all prior reports and webcasts are available on the Premium Member Homepage.
PICTURED: Friday's session marked the nineteenth triple-digit move for the Dow in the past 24 sessions. Volume increases behind recent losses have been indicative of distributional pressure as opposed to any meaningful accumulation of shares by large and influential fund managers.
|
 Kenneth J. Gruneisen started out as a licensed stockbroker in August 1987, a couple of months prior to the historic stock market crash that took the Dow Jones Industrial Average down -22.6% in a single day. He has published daily fact-based fundamental and technical analysis on high-ranked stocks online for two decades. Through FACTBASEDINVESTING.COM, Kenneth provides educational articles, news, market commentary, and other information regarding proven investment systems that work in good times and bad.
Comments contained in the body of this report are technical opinions only and are not necessarily those of Gruneisen Growth Corp. The material herein has been obtained from sources believed to be reliable and accurate, however, its accuracy and completeness cannot be guaranteed. Our firm, employees, and customers may effect transactions, including transactions contrary to any recommendation herein, or have positions in the securities mentioned herein or options with respect thereto. Any recommendation contained in this report may not be suitable for all investors and it is not to be deemed an offer or solicitation on our part with respect to the purchase or sale of any securities. |
|
 |
Broker/Dealer Index Sinks to New 2011 Low
Kenneth J. Gruneisen - Passed the CAN SLIM® Master's Exam
The Bank Index ($BKX -3.36%), Broker/Dealer Index ($XBD -2.73%), and Retail Index ($RLX -2.13%) were negative influences while widespread pressure weighed on all industry groups on Friday. The tech sector ended unanimously lower yet the Semiconductor Index ($SOX -1.06%) held up better than the Networking Index ($NWX -3.60%), Biotechnology Index ($BTK -3.52%), and the Internet Index ($IIX -3.25%). Weakness in energy-related shares pressured the Oil Services Index ($OSX -3.48%) and Integrated Oil Index ($XOI -2.98%) to large losses. The Healthcare Index ($HMO -3.76%) and Gold & Silver Index ($XAU -1.68%) also gave defensive investors no reward.
Charts courtesy www.stockcharts.com

PICTURED: The Broker/Dealer Index ($XBD -2.73%) hit a new 2011 low, and slumped to its lows not seen since April 2009.
| Oil Services |
$OSX |
224.61 |
-8.10 |
-3.48% |
-8.37% |
| Healthcare |
$HMO |
1,945.71 |
-76.08 |
-3.76% |
+15.00% |
| Integrated Oil |
$XOI |
1,102.41 |
-33.84 |
-2.98% |
-9.13% |
| Semiconductor |
$SOX |
348.40 |
-3.75 |
-1.06% |
-15.40% |
| Networking |
$NWX |
227.77 |
-8.51 |
-3.60% |
-18.82% |
| Internet |
$IIX |
275.01 |
-9.25 |
-3.25% |
-10.63% |
| Broker/Dealer |
$XBD |
83.30 |
-2.33 |
-2.73% |
-31.45% |
| Retail |
$RLX |
495.75 |
-10.81 |
-2.13% |
-2.48% |
| Gold & Silver |
$XAU |
223.21 |
-3.82 |
-1.68% |
-1.49% |
| Bank |
$BKX |
36.23 |
-1.26 |
-3.36% |
-30.61% |
| Biotech |
$BTK |
1,147.95 |
-41.88 |
-3.52% |
-11.53% |
|
|
|
 |
Hovering Near Highs Well Above Support
Kenneth J. Gruneisen - Passed the CAN SLIM® Master's Exam
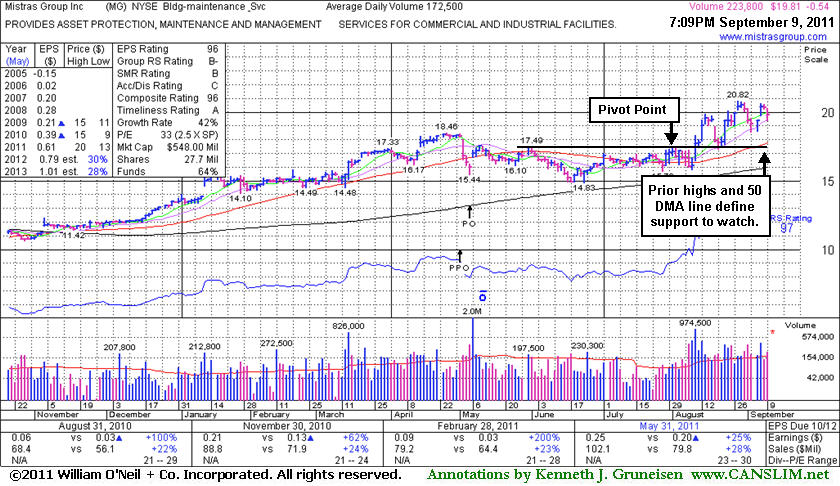
Mistras Group Inc (MG -$0.54 or -2.65% to $19.81) is holding its ground stubbornly near its 52-week high. Prior resistance in the $18 area and its 50-day moving average (DMA) line define important chart support to watch on pullbacks. Its last appearance in the FSU section was on 8/24/11 with an annotated graph included below the headline, "Hit New High After Prior Resistance Acted as Support", and we then observed - "Typically about 40% of successful breakouts pull back and test support at prior resistance before continuing higher."
The Building - Maintenance Services group has a Group Relative Strength Rating (56) that is mediocre, whereas the L criteria calls for leadership in the industry group. The chart below shows the previously noted Public Offering on 5/05/11, and it illustrates how MG found support well above its 200 DMA line. It has maintained its solid earnings history concerning the C and A criteria. The number of top-rated funds owning its shares rose from 99 in Sep '10 to 150 in Jun '11, a very reassuring sign concerning the I criteria. Management's large 59% ownership interest keeps them very motivated to look after and build shareholder value. The small supply (S criteria) of only 27.7 million shares outstanding and 11.3 million in the public float can contribute to greater price volatility in the event of institutional buying or selling. Disciplined investors avoid chasing extended stocks more than +5% above their pivot point, and always limit losses at 7-8% if ever a stock falls that much after purchased. If the market environment is favorable, leading stocks often offer disciplined investors multiple opportunities to accumulate shares within the fact-based system's guidelines.
 |
|
|
Color Codes Explained :
Y - Better candidates highlighted by our
staff of experts.
G - Previously featured
in past reports as yellow but may no longer be buyable under the
guidelines.
***Last / Change / Volume data in this table is the closing quote data***
Symbol/Exchange
Company Name
Industry Group |
PRICE |
CHANGE
(%Change) |
Day High |
Volume
(% DAV)
(% 50 day avg vol) |
52 Wk Hi
% From Hi |
Featured
Date |
Price
Featured |
Pivot Featured |
|
Max Buy |
ATHN
-
NASDAQ
Athenahealth Inc
DIVERSIFIED SERVICES - Business/Management Services
|
$59.08
|
-3.88
-6.16% |
$62.46
|
874,003
127.67% of 50 DAV
50 DAV is 684,600
|
$63.74
-7.31%
|
9/8/2011
|
$61.93
|
PP = $61.78
|
|
MB = $64.87
|
 Most Recent Note - 9/9/2011 4:13:34 PM
Y - Broader market weakness weighed on this high-ranked leader as it abruptly reversed from its all-time high. It erased its prior gain with a loss on lighter but above average volume, finishing below a prior high close ($60.00 on 8/03/11). See the latest FSU analysis for more details and a new annotated weekly graph.
>>> The latest Featured Stock Update with an annotated graph appeared on 9/8/2011. Click here.
View all notes |
Alert me of new notes |
CANSLIM.net Company Profile |
SEC |
Zacks Reports |
StockTalk |
News |
Chart |
Request a new note
C
A N
S L
I M


|
EXLS
-
NASDAQ
Exlservice Holdings Inc
DIVERSIFIED SERVICES - Business/Management Services
|
$24.87
|
-0.62
-2.43% |
$25.27
|
119,895
123.48% of 50 DAV
50 DAV is 97,100
|
$26.55
-6.33%
|
8/2/2011
|
$24.85
|
PP = $24.85
|
|
MB = $26.09
|
Most Recent Note - 9/9/2011 4:19:12 PM
Y - Loss today with higher volume after a gap down was indicative of mild distributional pressure as it slumped to a close near its prior pivot point. Its 50 DMA line defines important chart support to watch on pullbacks, where a violation would raise concerns and may trigger a technical sell signal.
>>> The latest Featured Stock Update with an annotated graph appeared on 9/7/2011. Click here.
View all notes |
Alert me of new notes |
CANSLIM.net Company Profile |
SEC |
Zacks Reports |
StockTalk |
News |
Chart |
Request a new note
C
A N
S L
I M
|
FCFS
-
NASDAQ
First Cash Financial Svs
SPECIALTY RETAIL - Specialty Retail, Other
|
$48.37
|
-0.01
-0.02% |
$48.83
|
276,091
77.64% of 50 DAV
50 DAV is 355,600
|
$49.13
-1.55%
|
5/31/2011
|
$42.00
|
PP = $40.23
|
|
MB = $42.24
|
Most Recent Note - 9/9/2011 4:20:46 PM
G - Holding its ground stubbornly near its all-time high, extended from its prior base. Its 50 DMA line defines supports to watch.
>>> The latest Featured Stock Update with an annotated graph appeared on 9/6/2011. Click here.
View all notes |
Alert me of new notes |
CANSLIM.net Company Profile |
SEC |
Zacks Reports |
StockTalk |
News |
Chart |
Request a new note
C
A N
S L
I M
|
JCOM
-
NASDAQ
J 2 Global Communication
INTERNET - Internet Software and Services
|
$30.19
|
-1.58
-4.97% |
$31.45
|
1,103,053
284.95% of 50 DAV
50 DAV is 387,100
|
$32.64
-7.51%
|
8/8/2011
|
$30.38
|
PP = $29.31
|
|
MB = $30.78
|
Most Recent Note - 9/9/2011 12:27:01 PM
G - Gapped down today, now slumping -7.4% off its 52-week high. Previous highs in the $30-31 area define initial chart support to watch.
>>> The latest Featured Stock Update with an annotated graph appeared on 8/29/2011. Click here.
View all notes |
Alert me of new notes |
CANSLIM.net Company Profile |
SEC |
Zacks Reports |
StockTalk |
News |
Chart |
Request a new note
C
A N
S L
I M
|
MA
-
NYSE
Mastercard Inc Cl A
DIVERSIFIED SERVICES - Business/Management Services
|
$322.02
|
-15.89
-4.70% |
$337.61
|
1,767,045
113.33% of 50 DAV
50 DAV is 1,559,200
|
$345.13
-6.70%
|
8/3/2011
|
$324.82
|
PP = $322.38
|
|
MB = $338.50
|
Most Recent Note - 9/9/2011 4:28:17 PM
Y - Color code is changed to yellow after its slump to a close near important support at its 50 DMA line and near its prior pivot point. It finished near the session low with a loss on higher volume indicative of distributional pressure. A damaging violation of its 50 DMA would raise concerns and may trigger a technical sell signal.
>>> The latest Featured Stock Update with an annotated graph appeared on 8/26/2011. Click here.
View all notes |
Alert me of new notes |
CANSLIM.net Company Profile |
SEC |
Zacks Reports |
StockTalk |
News |
Chart |
Request a new note
C
A N
S L
I M
|
Symbol/Exchange
Company Name
Industry Group |
PRICE |
CHANGE
(%Change) |
Day High |
Volume
(% DAV)
(% 50 day avg vol) |
52 Wk Hi
% From Hi |
Featured
Date |
Price
Featured |
Pivot Featured |
|
Max Buy |
MG
-
NYSE
Mistras Group Inc
DIVERSIFIED SERVICES - Bulding and Faci;ity Management Services
|
$19.81
|
-0.54
-2.65% |
$20.28
|
223,833
129.76% of 50 DAV
50 DAV is 172,500
|
$20.82
-4.85%
|
8/10/2011
|
$17.89
|
PP = $17.58
|
|
MB = $18.46
|
Most Recent Note - 9/9/2011 4:29:44 PM
G - Holding its ground stubbornly near its 52-week high. Prior resistance in the $18 area and its 50 DMA line define important chart support to watch on pullbacks.
>>> The latest Featured Stock Update with an annotated graph appeared on 9/9/2011. Click here.
View all notes |
Alert me of new notes |
CANSLIM.net Company Profile |
SEC |
Zacks Reports |
StockTalk |
News |
Chart |
Request a new note
C
A N
S L
I M
|
MKTX
-
NASDAQ
Marketaxess Holdings Inc
FINANCIAL SERVICES - Investment Brokerage - Nationa
|
$29.40
|
-0.61
-2.03% |
$29.76
|
439,687
181.99% of 50 DAV
50 DAV is 241,600
|
$30.95
-5.01%
|
7/29/2011
|
$25.87
|
PP = $26.35
|
|
MB = $27.67
|
Most Recent Note - 9/9/2011 4:33:05 PM
G - Loss on higher volume today was indicative of distributional pressure, but its close in the upper third of its intra-day range was a sign it found encouraging support. It is extended from its prior base. Prior resistance in the $26 area and its 50 DMA line define important chart support to watch.
>>> The latest Featured Stock Update with an annotated graph appeared on 9/2/2011. Click here.
View all notes |
Alert me of new notes |
CANSLIM.net Company Profile |
SEC |
Zacks Reports |
StockTalk |
News |
Chart |
Request a new note
C
A N
S L
I M
|
PSMT
-
NASDAQ
Pricesmart Inc
RETAIL - Drug Stores
|
$67.00
|
+0.30
0.45% |
$67.51
|
473,456
170.61% of 50 DAV
50 DAV is 277,500
|
$68.05
-1.54%
|
8/30/2011
|
$63.01
|
PP = $62.37
|
|
MB = $65.49
|
Most Recent Note - 9/9/2011 4:45:53 PM
G - Inched higher today for a 4th consecutive gain backed by above average volume, bucking a widely negative market. Prior highs and its 50 DMA line define support levels to watch on pullbacks.
>>> The latest Featured Stock Update with an annotated graph appeared on 8/30/2011. Click here.
View all notes |
Alert me of new notes |
CANSLIM.net Company Profile |
SEC |
Zacks Reports |
StockTalk |
News |
Chart |
Request a new note
C
A N
S L
I M
|
|
|
|
THESE ARE NOT BUY RECOMMENDATIONS!
Comments contained in the body of this report are technical
opinions only. The material herein has been obtained
from sources believed to be reliable and accurate, however,
its accuracy and completeness cannot be guaranteed.
This site is not an investment advisor, hence it does
not endorse or recommend any securities or other investments.
Any recommendation contained in this report may not
be suitable for all investors and it is not to be deemed
an offer or solicitation on our part with respect to
the purchase or sale of any securities. All trademarks,
service marks and trade names appearing in this report
are the property of their respective owners, and are
likewise used for identification purposes only.
This report is a service available
only to active Paid Premium Members.
You may opt-out of receiving report notifications
at any time. Questions or comments may be submitted
by writing to Premium Membership Services 665 S.E. 10 Street, Suite 201 Deerfield Beach, FL 33441-5634 or by calling 1-800-965-8307
or 954-785-1121.
|
|
|

