You are not logged in.
This means you
CAN ONLY VIEW reports that were published prior to Tuesday, April 15, 2025.
You
MUST UPGRADE YOUR MEMBERSHIP if you want to see any current reports.
AFTER MARKET UPDATE - THURSDAY, SEPTEMBER 8TH, 2011
Previous After Market Report Next After Market Report >>>
|
|
|
|
DOW |
-118.90 |
11,295.96 |
-1.04% |
|
Volume |
946,713,570 |
-1% |
|
Volume |
1,922,570,540 |
+12% |
|
NASDAQ |
-19.80 |
2,529.14 |
-0.78% |
|
Advancers |
647 |
21% |
|
Advancers |
614 |
23% |
|
S&P 500 |
-12.74 |
1,185.88 |
-1.06% |
|
Decliners |
2,379 |
77% |
|
Decliners |
1,934 |
73% |
|
Russell 2000 |
-14.55 |
694.92 |
-2.05% |
|
52 Wk Highs |
33 |
|
|
52 Wk Highs |
25 |
|
|
S&P 600 |
-7.69 |
380.84 |
-1.98% |
|
52 Wk Lows |
19 |
|
|
52 Wk Lows |
35 |
|
|
 |
Major Averages Erase Gains While Awaiting President's New Jobs Plan
Kenneth J. Gruneisen - Passed the CAN SLIM® Master's Exam
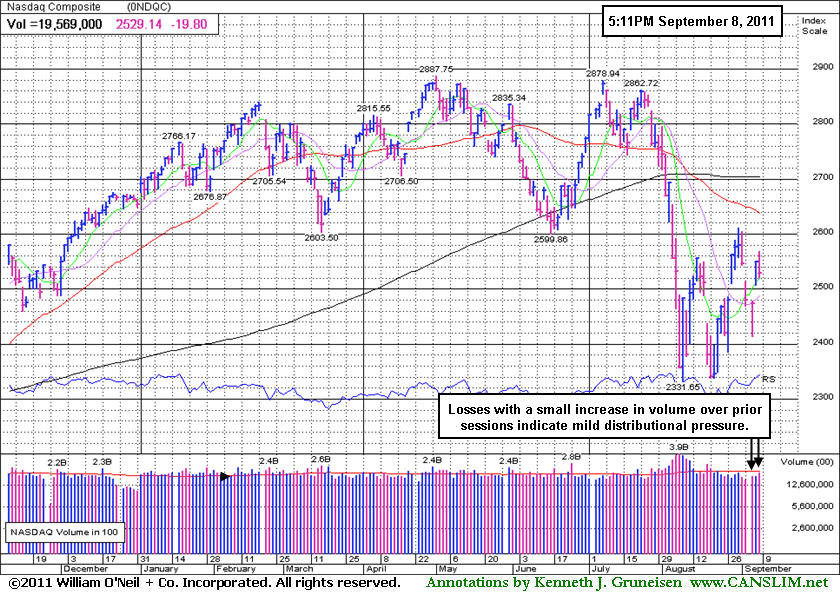
Investors appeared to be in a wait-and-see mode on Thursday after economic reports failed to impress, and the major indices erased their morning gains and collectively slumped into the red. The volume totals were reported mixed, slightly lower again on the NYSE and higher on the Nasdaq exchange. Declining issues outnumbered advancers by almost 4-1 on the NYSE and by more than 3-1 on the Nasdaq exchange. The new 52-week highs total outnumbered new lows on the NYSE while new lows outnumbered new highs on the Nasdaq exchange. There were 19 high-ranked companies from the CANSLIM.net Leaders List that made new 52-week highs and appeared on the CANSLIM.net BreakOuts Page, up from the prior session total of 9 stocks. A further expansion in leadership would be a welcome reassurance for the current rally, and leadership will be critical factor in determining if stocks can extend the rally for a meaningful advance. Any sustainable rally requires a healthy crop of strong leaders hitting new 52-week highs, as this commentary has repeated! There were 3 gains out of the 8 high-ranked leaders currently included on the Featured Stocks Page.
Initial jobless claims increased in the latest week, surprising analysts who were looking for a slight decline. The U.S. trade deficit narrowed more than forecast in July, reaching a three-month low as exports climbed to a record and crude oil imports eased.
The head of the European Central bank warned that risks to the economic recovery have intensified. Federal Reserve Chairman Ben Bernanke gave no hint on new stimulus action at the Fed's meeting later this month. Meanwhile, President Obama was set to unveil his much-anticipated jobs program in an evening speech to Congress.
Technology companies gave the market some initial support while the financial sector lagged, but tech shares were dragged lower in the afternoon as a broadly negative bias prevailed. Google Inc (GOOG +0.17%) announced it will buy review and ratings service Zagat to add features aimed at local businesses and advertisers. Yahoo! Inc (YHOO +6.1%) added to Wednesday’s advance after a New York investment firm said it bought a 5.2% stake in the company and urged board members to resign.
Disciplined investors may carefully consider new buying efforts when all key criteria are satisfied, as the market environment (M criteria) may currently be described as an uptrend under pressure. However, the indices remain well below their respective 200-day moving average (DMA) lines, while to be considered truly "healthy" they would need to rebound above their long-term averages.
The September 2011 issue of CANSLIM.net News will be available soon. The Q3 2011 Webcast has also been scheduled for Wednesday, September 28th at 8PM EST. Links to all prior reports and webcasts are available on the Premium Member Homepage.
PICTURED: The Nasdaq Composite Index's recent losses with a small increase in volume over prior sessions indicate mild distributional pressure.
|
 Kenneth J. Gruneisen started out as a licensed stockbroker in August 1987, a couple of months prior to the historic stock market crash that took the Dow Jones Industrial Average down -22.6% in a single day. He has published daily fact-based fundamental and technical analysis on high-ranked stocks online for two decades. Through FACTBASEDINVESTING.COM, Kenneth provides educational articles, news, market commentary, and other information regarding proven investment systems that work in good times and bad.
Comments contained in the body of this report are technical opinions only and are not necessarily those of Gruneisen Growth Corp. The material herein has been obtained from sources believed to be reliable and accurate, however, its accuracy and completeness cannot be guaranteed. Our firm, employees, and customers may effect transactions, including transactions contrary to any recommendation herein, or have positions in the securities mentioned herein or options with respect thereto. Any recommendation contained in this report may not be suitable for all investors and it is not to be deemed an offer or solicitation on our part with respect to the purchase or sale of any securities. |
|
 |
Financial, Healthcare, Retail, and Tech Shares Decline
Kenneth J. Gruneisen - Passed the CAN SLIM® Master's Exam
The Gold & Silver Index ($XAU +1.13%) posted a gain while most groups ended lower on Thursday. The Broker/Dealer Index ($XBD -2.99%) and Bank Index ($BKX -2.67%) led declining groups while the Retail Index ($RLX -1.16%) also added a negative influence on the major averages. The Healthcare Index ($HMO -2.36%) slumped and weakness in energy-related shares pressured the Integrated Oil Index ($XOI -1.12%) and Oil Services Index ($OSX -1.10%). The tech sector finished with unanimous small losses from the Biotechnology Index ($BTK -0.75%), Semiconductor Index ($SOX -0.60%), Networking Index ($NWX -0.47%), and Internet Index ($IIX -0.40%).
Charts courtesy www.stockcharts.com
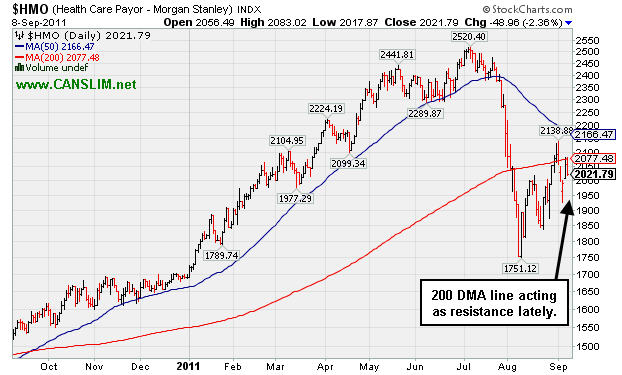
PICTURED: The Healthcare Index ($HMO -2.36%) has recently encountered resistance after slumping below its longer-term 200 DMA line.
| Oil Services |
$OSX |
232.71 |
-2.59 |
-1.10% |
-5.06% |
| Healthcare |
$HMO |
2,021.79 |
-48.96 |
-2.36% |
+19.49% |
| Integrated Oil |
$XOI |
1,136.25 |
-12.88 |
-1.12% |
-6.34% |
| Semiconductor |
$SOX |
352.15 |
-2.11 |
-0.60% |
-14.49% |
| Networking |
$NWX |
236.22 |
-1.17 |
-0.49% |
-15.80% |
| Internet |
$IIX |
284.23 |
-1.16 |
-0.41% |
-7.64% |
| Broker/Dealer |
$XBD |
85.67 |
-2.60 |
-2.95% |
-29.50% |
| Retail |
$RLX |
507.37 |
-5.16 |
-1.01% |
-0.20% |
| Gold & Silver |
$XAU |
227.03 |
+2.54 |
+1.13% |
+0.20% |
| Bank |
$BKX |
37.67 |
-0.85 |
-2.21% |
-27.85% |
| Biotech |
$BTK |
1,189.55 |
-9.33 |
-0.78% |
-8.33% |
|
|
|
 |
Secondary Buy Point After Choppy Consolidation
Kenneth J. Gruneisen - Passed the CAN SLIM® Master's Exam
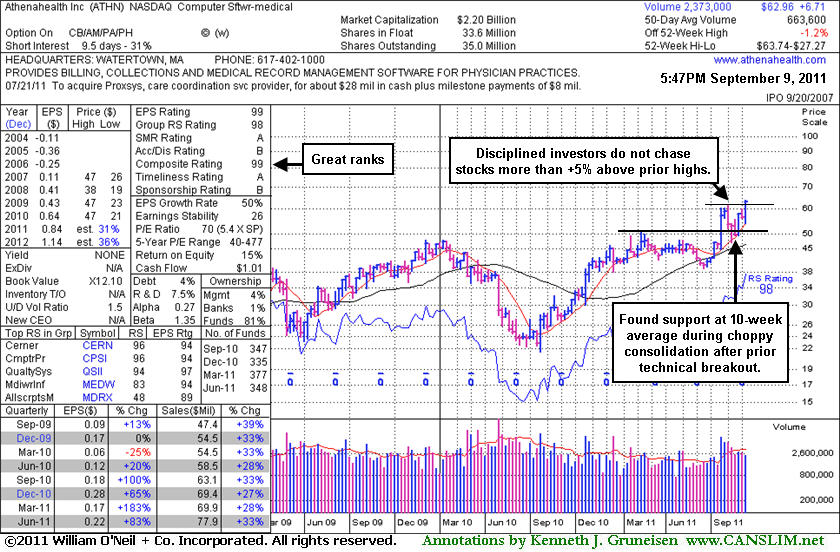
Athenahealth Inc (ATHN +$3.88 or +6.57% to $62.96) finished strong with a solid gain today backed nearly 2 times average volume as it rallied to a new 52-week and all-time high. While rising from a choppy 5-week consolidation, in the mid-day report earlier today its color code was changed to yellow while it was noted - "It may be accumulated under the investment system guidelines up to +5% above its prior high after finding support near its 10-week moving average following an earlier breakout." In the Certification program they teach followers of the fact-based investment system that following a technical breakout, a secondary buy point can be considered valid anywhere between a stock's first successful test of its 10-week moving average and up to +5% above its latest chart high. The recent consolidation was slightly too deep to be recognized as a very ideal or orderly base pattern, however, the stock's resilience after its earlier breakaway gap could warrant giving it consideration again now. Strength and leadership (L criteria) in the other Computer Software - Medical issues is also a very reassuring sign. The broader market's (M criteria) tentative action of late remains an overhanging concern, while an expansion in leadership (new highs) would be a welcome improvement to watch for in the near-term.
The weekly graph below illustrates how ATHN found support near prior highs in the $50 area and its 50 -day moving average (DMA) line after it was dropped from the Featured Stocks list on 8/08/11. Its last appearance in this FSU section was on 7/27/11 with an annotated graph under the headline, "Holding Gains Following Breakaway Gap". It had recently been highlighted in yellow in the 7/22/11 mid-day report (read here), a session marked by 11 times average volume as its considerable "breakaway gap" cleared previously noted resistance in the $50 area. It reported earnings +83% on +33% sales revenues for the quarter ended June 30, 2011 versus the year ago period. The C criteria is satisfied by the past 4 quarterly comparisons showing solid sales and earnings increases above the +25% guideline. Its strong annual earnings satisfies the A criteria. Always limit losses if a stock falls -7% from your buy price. You may be wise to be willing to buy the stock back later when strength returns, but you should never leave yourself open to greater losses.
|
|
|
Color Codes Explained :
Y - Better candidates highlighted by our
staff of experts.
G - Previously featured
in past reports as yellow but may no longer be buyable under the
guidelines.
***Last / Change / Volume data in this table is the closing quote data***
Symbol/Exchange
Company Name
Industry Group |
PRICE |
CHANGE
(%Change) |
Day High |
Volume
(% DAV)
(% 50 day avg vol) |
52 Wk Hi
% From Hi |
Featured
Date |
Price
Featured |
Pivot Featured |
|
Max Buy |
ATHN
-
NASDAQ
Athenahealth Inc
DIVERSIFIED SERVICES - Business/Management Services
|
$62.96
|
+3.88
6.57% |
$63.74
|
1,310,869
197.54% of 50 DAV
50 DAV is 663,600
|
$61.78
1.91%
|
9/8/2011
|
$61.93
|
PP = $61.78
|
|
MB = $64.87
|
 Most Recent Note - 9/8/2011 6:04:43 PM
Y - Finished strong today with a solid gain backed by nearly 2 times average volume as it hit new 52-week and all-time highs. Rising from a choppy 5-week consolidation, its color code was changed to yellow in the earlier mid-day report while noted - "It may be accumulated under the investment system guidelines up to +5% above its prior high after finding support near its 10-week moving average following an earlier breakout. It found support near prior highs in the $50 area and its 50 DMA line after it was dropped from the Featured Stocks list on 8/08/11." See the latest FSU analysis for more details and a new annotated weekly graph.
>>> The latest Featured Stock Update with an annotated graph appeared on 9/8/2011. Click here.
View all notes |
Alert me of new notes |
CANSLIM.net Company Profile |
SEC |
Zacks Reports |
StockTalk |
News |
Chart |
Request a new note
C
A N
S L
I M


|
EXLS
-
NASDAQ
Exlservice Holdings Inc
DIVERSIFIED SERVICES - Business/Management Services
|
$25.49
|
-0.94
-3.56% |
$26.42
|
81,114
84.14% of 50 DAV
50 DAV is 96,400
|
$26.55
-3.99%
|
8/2/2011
|
$24.85
|
PP = $24.85
|
|
MB = $26.09
|
Most Recent Note - 9/8/2011 6:00:13 PM
Y - Pulled back today with lighter volume, dipping back under its "max buy" level, and its color code is changed to yellow again. Its 50 DMA line defines important chart support to watch on pullbacks.
>>> The latest Featured Stock Update with an annotated graph appeared on 9/7/2011. Click here.
View all notes |
Alert me of new notes |
CANSLIM.net Company Profile |
SEC |
Zacks Reports |
StockTalk |
News |
Chart |
Request a new note
C
A N
S L
I M
|
FCFS
-
NASDAQ
First Cash Financial Svs
SPECIALTY RETAIL - Specialty Retail, Other
|
$48.38
|
-0.46
-0.94% |
$49.13
|
216,093
60.73% of 50 DAV
50 DAV is 355,800
|
$49.07
-1.41%
|
5/31/2011
|
$42.00
|
PP = $40.23
|
|
MB = $42.24
|
Most Recent Note - 9/7/2011 12:23:30 PM
G - Touched another new all-time high today after a strong finish on the prior session. It has not formed a sound new base pattern. Its 50 DMA line defines supports to watch.
>>> The latest Featured Stock Update with an annotated graph appeared on 9/6/2011. Click here.
View all notes |
Alert me of new notes |
CANSLIM.net Company Profile |
SEC |
Zacks Reports |
StockTalk |
News |
Chart |
Request a new note
C
A N
S L
I M
|
JCOM
-
NASDAQ
J 2 Global Communication
INTERNET - Internet Software and Services
|
$31.77
|
+0.04
0.13% |
$32.29
|
471,403
123.66% of 50 DAV
50 DAV is 381,200
|
$32.64
-2.67%
|
8/8/2011
|
$30.38
|
PP = $29.31
|
|
MB = $30.78
|
Most Recent Note - 9/7/2011 4:20:02 PM
G - Solid gain today broke a streak of 4 consecutive losses since reaching a new 52-week high on 8/30/11. Previous highs in the $30-31 area now define initial chart support on pullbacks.
>>> The latest Featured Stock Update with an annotated graph appeared on 8/29/2011. Click here.
View all notes |
Alert me of new notes |
CANSLIM.net Company Profile |
SEC |
Zacks Reports |
StockTalk |
News |
Chart |
Request a new note
C
A N
S L
I M
|
MA
-
NYSE
Mastercard Inc Cl A
DIVERSIFIED SERVICES - Business/Management Services
|
$337.91
|
-1.19
-0.35% |
$345.13
|
1,601,200
103.45% of 50 DAV
50 DAV is 1,547,800
|
$340.42
-0.74%
|
8/3/2011
|
$324.82
|
PP = $322.38
|
|
MB = $338.50
|
Most Recent Note - 9/7/2011 4:22:20 PM
G - Gapped up today and rallied beyond its previously cited "max buy" level. Color code is changed to green. Important support at its 50 DMA line.
>>> The latest Featured Stock Update with an annotated graph appeared on 8/26/2011. Click here.
View all notes |
Alert me of new notes |
CANSLIM.net Company Profile |
SEC |
Zacks Reports |
StockTalk |
News |
Chart |
Request a new note
C
A N
S L
I M
|
Symbol/Exchange
Company Name
Industry Group |
PRICE |
CHANGE
(%Change) |
Day High |
Volume
(% DAV)
(% 50 day avg vol) |
52 Wk Hi
% From Hi |
Featured
Date |
Price
Featured |
Pivot Featured |
|
Max Buy |
MG
-
NYSE
Mistras Group Inc
DIVERSIFIED SERVICES - Bulding and Faci;ity Management Services
|
$20.35
|
-0.03
-0.15% |
$20.56
|
143,701
84.28% of 50 DAV
50 DAV is 170,500
|
$20.82
-2.26%
|
8/10/2011
|
$17.89
|
PP = $17.58
|
|
MB = $18.46
|
Most Recent Note - 9/7/2011 12:30:31 PM
G - Consolidating well above prior highs, perched within close striking distance of its 52-week high today. Prior resistance in the $18 area and its 50 DMA line define important chart support to watch on pullbacks.
>>> The latest Featured Stock Update with an annotated graph appeared on 8/24/2011. Click here.
View all notes |
Alert me of new notes |
CANSLIM.net Company Profile |
SEC |
Zacks Reports |
StockTalk |
News |
Chart |
Request a new note
C
A N
S L
I M
|
MKTX
-
NASDAQ
Marketaxess Holdings Inc
FINANCIAL SERVICES - Investment Brokerage - Nationa
|
$30.01
|
-0.23
-0.76% |
$30.83
|
176,800
73.39% of 50 DAV
50 DAV is 240,900
|
$30.95
-3.03%
|
7/29/2011
|
$25.87
|
PP = $26.35
|
|
MB = $27.67
|
Most Recent Note - 9/7/2011 1:22:45 PM
G - Gapped up today, rallying within close striking distance of its 52-week high following 5 consecutive small losses since reaching its high. It is extended from its prior base. Prior resistance in the $26 area and its 50 DMA line define important chart support to watch.
>>> The latest Featured Stock Update with an annotated graph appeared on 9/2/2011. Click here.
View all notes |
Alert me of new notes |
CANSLIM.net Company Profile |
SEC |
Zacks Reports |
StockTalk |
News |
Chart |
Request a new note
C
A N
S L
I M
|
PSMT
-
NASDAQ
Pricesmart Inc
RETAIL - Drug Stores
|
$66.70
|
+0.57
0.86% |
$67.00
|
405,931
147.56% of 50 DAV
50 DAV is 275,100
|
$68.05
-1.98%
|
8/30/2011
|
$63.01
|
PP = $62.37
|
|
MB = $65.49
|
Most Recent Note - 9/7/2011 4:26:34 PM
G - Gap up gain today with above average volume helped it rally above its "max buy" level, and its color code is changed to green. On its pullback following last week's technical breakout the prior highs acted as support. A subsequent close under its old high close ($61.54 on 8/03/11) would completely negate the recent technical breakout.
>>> The latest Featured Stock Update with an annotated graph appeared on 8/30/2011. Click here.
View all notes |
Alert me of new notes |
CANSLIM.net Company Profile |
SEC |
Zacks Reports |
StockTalk |
News |
Chart |
Request a new note
C
A N
S L
I M
|
|
|
|
THESE ARE NOT BUY RECOMMENDATIONS!
Comments contained in the body of this report are technical
opinions only. The material herein has been obtained
from sources believed to be reliable and accurate, however,
its accuracy and completeness cannot be guaranteed.
This site is not an investment advisor, hence it does
not endorse or recommend any securities or other investments.
Any recommendation contained in this report may not
be suitable for all investors and it is not to be deemed
an offer or solicitation on our part with respect to
the purchase or sale of any securities. All trademarks,
service marks and trade names appearing in this report
are the property of their respective owners, and are
likewise used for identification purposes only.
This report is a service available
only to active Paid Premium Members.
You may opt-out of receiving report notifications
at any time. Questions or comments may be submitted
by writing to Premium Membership Services 665 S.E. 10 Street, Suite 201 Deerfield Beach, FL 33441-5634 or by calling 1-800-965-8307
or 954-785-1121.
|
|
|

