You are not logged in.
This means you
CAN ONLY VIEW reports that were published prior to Monday, April 14, 2025.
You
MUST UPGRADE YOUR MEMBERSHIP if you want to see any current reports.
AFTER MARKET UPDATE - TUESDAY, SEPTEMBER 8TH, 2009
Previous After Market Report Next After Market Report >>>
|
|
|
|
DOW |
+56.07 |
9,497.34 |
+0.59% |
|
Volume |
1,317,678,680 |
+29% |
|
Volume |
2,050,697,820 |
+15% |
|
NASDAQ |
+18.99 |
2,037.77 |
+0.94% |
|
Advancers |
2,282 |
74% |
|
Advancers |
1,635 |
58% |
|
S&P 500 |
+8.99 |
1,025.39 |
+0.88% |
|
Decliners |
746 |
24% |
|
Decliners |
1,040 |
37% |
|
Russell 2000 |
+5.88 |
576.38 |
+1.03% |
|
52 Wk Highs |
154 |
|
|
52 Wk Highs |
69 |
|
|
S&P 600 |
+3.10 |
303.97 |
+1.03% |
|
52 Wk Lows |
1 |
|
|
52 Wk Lows |
3 |
|
|
 |
Post-Holiday Gains Come While US Dollar Falls
Adam Sarhan, Contributing Writer,
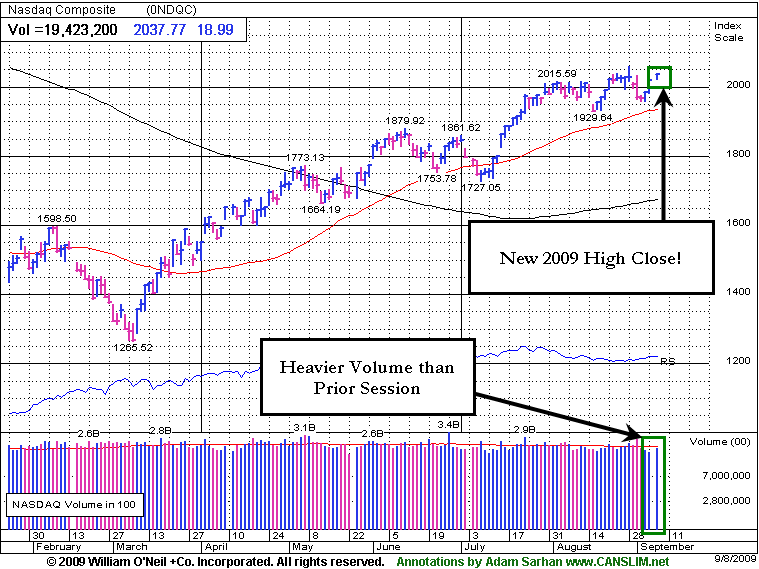
Stocks rallied around the world after shares in China posted gains considered by certain analysts as a "follow-through day" confirming their latest rally attempt. This may be very important, since China led the world markets higher in early March, and the immensely populous country continues to be a strong engine for economic growth. In the US, volume was higher than Friday's light pre-holiday levels which is a sign of accumulation for the major averages. Advancers trumped decliners by nearly a 3-to-1 ratio on the NYSE and by about a 3-to-2 ratio on the Nasdaq exchange. There were 22 high-ranked companies from the CANSLIM.net Leaders List that made a new 52-week high and appeared on the CANSLIM.net BreakOuts Page, up from the 11 issues that appeared on the prior session. New 52-week highs still outnumbered new 52-week lows on both exchanges while new lows were in the single digits again.
Stocks rallied as the US dollar dove to a new 2009 low against the euro and a slew of other world currencies. This sent the price of commodities higher, which helped gold rise above the psychologically important $1,000 per ounce level. The falling dollar sent a slew of other commodities higher on the news. Goldman Sachs Group Inc. (GS +2.61%) raised its forecasts on the metals complex because of "increasing evidence of a stronger-than- anticipated recovery in global industrial activity." On Tuesday, Gold futures rose to the highest price since March 2008 (when Bear Stearns failed), before pulling back to close off the session highs. Bullion reached an intra-day record high of $1,033.90 approximately 18 months ago, in March 2008, and has been advancing for the past nine consecutive years.
Interestingly, in a somewhat negative divergence, a flurry of gold stocks negatively reversed (opened higher and closed lower) on the news. Many gold and silver related stocks blasted higher last Wednesday and Thursday, making a pullback expected. Watchful traders will be measuring the pullback to gauge whether it is a short-term pullback which will eventually lead to higher prices, or if there is a material pullback which effectively ends the recent run in gold shares. Remember that gold stocks broke out before gold broke out, so the fact that the stocks in the group are pulling back before gold pulls back bodes somewhat poorly for the the yellow metal.
The International Monetary Fund’s Dominique Strauss-Kahn said the crisis phase that toppled Lehman Brothers Holdings Inc. in September 2008 is "almost certainly behind us" which was a strong vote of confidence in the current recovery. Ministers from the Organization of Petroleum Exporting Countries (OPEC) are scheduled to meet tomorrow in Vienna to set production targets. Saudi Arabian Oil Minister Ali al-Naimi, who has been very vocal in recent months about his view on oil, said the market is in "good shape," with crude priced near $70 per barrel.
PICTURED: The Nasdaq Composite Index enjoyed a fresh high close for 2009!
|
|
|
 |
Energy Group Rallying Near Recent Chart Highs
Kenneth J. Gruneisen - Passed the CAN SLIM® Master's Exam
Energy-related shares were among Tuesday's standout gainers as the Oil Services Index ($OSX +3.16%) and Integrated Oil Index ($XOI +2.10%) both powered higher. Tech shares were too. Solid gainers amid the session's mostly positive group action included the Semiconductor Index ($SOX +2.25%), Networking Index ($NWX +1.81%), and Internet Index ($IIX +0.90%) posting respectable gains. influential contributors on the plus side also included the Retail Index ($RLX +1.34%) and Broker/Dealer Index ($XBD +2.13%) helping to underpin the unanimous gains for the major market averages. Meanwhile, the Healthcare Index ($HMO -1.55%) slumped worst, and the Bank Index ($BKX -0.33%) and Biotechnology Index ($BTK -0.05%) finished with minor losses. The Gold & Silver Index ($XAU +0.14%) edged higher, which was relatively tame action following the prior week's big gains.
Charts courtesy www.stockcharts.com
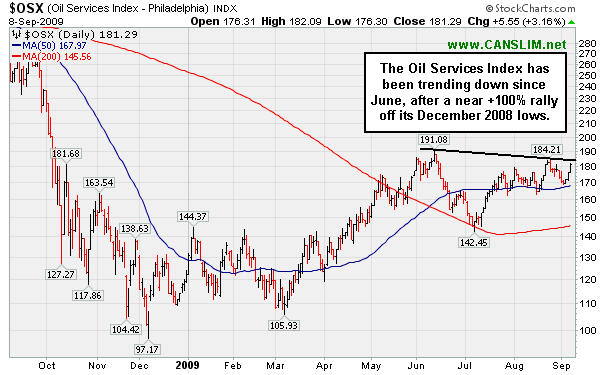
PICTURED: The Oil Services Index ($OSX +3.16%) was a standout gainer on Tuesday as traders returned from the long holiday weekend. After an impressive rally from its December 2008 lows, the OSX has been consolidating. Gains above the downward trendline connecting its June -August chart highs, and clearing either chart high, would be a bullish indicators for the whole group of energy-related stocks.
| Oil Services |
$OSX |
181.29 |
+5.55 |
+3.16% |
+49.35% |
| Healthcare |
$HMO |
1,206.79 |
-19.02 |
-1.55% |
+25.68% |
| Integrated Oil |
$XOI |
1,002.53 |
+20.65 |
+2.10% |
+2.33% |
| Semiconductor |
$SOX |
316.72 |
+6.98 |
+2.25% |
+49.28% |
| Networking |
$NWX |
214.69 |
+3.81 |
+1.81% |
+49.20% |
| Internet |
$IIX |
205.36 |
+1.84 |
+0.90% |
+53.52% |
| Broker/Dealer |
$XBD |
113.21 |
+2.36 |
+2.13% |
+46.13% |
| Retail |
$RLX |
370.92 |
+4.92 |
+1.34% |
+32.82% |
| Gold & Silver |
$XAU |
166.48 |
+0.23 |
+0.14% |
+34.42% |
| Bank |
$BKX |
45.09 |
-0.15 |
-0.33% |
+1.74% |
| Biotech |
$BTK |
924.18 |
-0.54 |
-0.06% |
+42.80% |
|
|
|
 |
Baidu Near Multi-Year Highs, But Decelerating Growth Is A Concern
Kenneth J. Gruneisen - Passed the CAN SLIM® Master's Exam
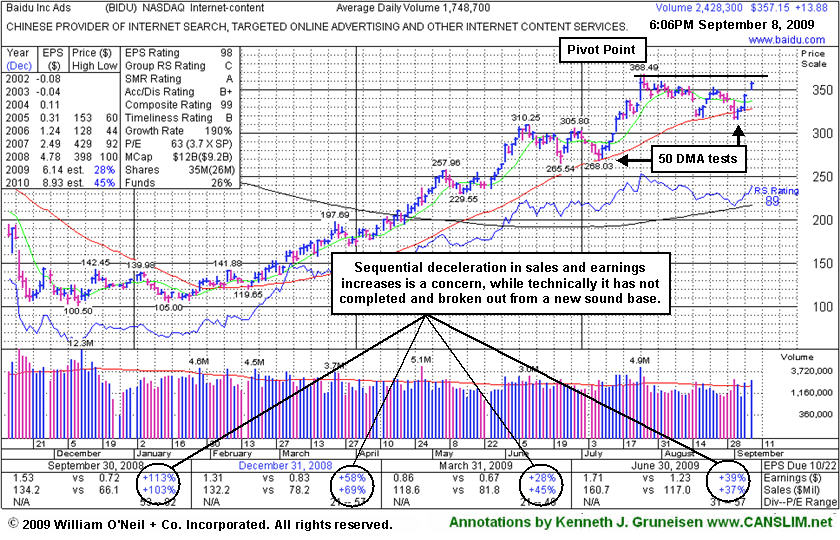
Baidu.com, Inc. (BIDU +$13.88 or +3.89% to $357.15) gapped up today and was featured in yellow in the mid-day report with new pivot point and max buy levels cited (read here). It is setting up on the right side of a near 6-week flat base while rising toward its 52 week high after its latest test of support at its 50-day moving average (DMA) line. That important short-term average line acted as firm support in July. The latest consolidation is shorter than the minimum 8-week length of a proper "double bottom" pattern. This high-ranked leader has a solid quarterly and annual earnings history, but its clear sequential deceleration in its increases is a concern which has been cited in recent reports. It could deserve the benefit of the doubt is a fresh technical buy signal is triggered. Remember that the investment system's guidelines require for a proper technical breakout to rise above its pivot point with heavy volume that is a minimum of +50% above average, preferably much more.
Based on weak technical action it was dropped from the Featured Stocks list on 1/11/08, when it was trading at $329, and it has rebounded very impressively from its January 2009 lows near $100. An annotated graph showed a vivid picture of the stock's weakness then under the headline, "Weakness Hurting Chances For Featured Favorite" (read here). Take a look back at that now! BIDU had rallied +356% since it first featured on Monday, October 30, 2006 in the CANSLIM.net Mid Day Breakouts Report (read here) with a $94.05 pivot point. Along the way it went through a multi-month consolidation under its 50 and 20 DMA lines, then later returned as a noteworthy leader featured in CANSLIM.net reports." Remember that a dropped stock can be featured again in a future CANSLIM.net report if it repairs its technical damage and forms a new pivot point. After its initial appearance, in fact, BIDU was featured again in yellow at $225.58 in the 09/11/07 CANSLIM.net Mid-Day BreakOuts Report as it was hitting new highs from an 8-week base period (read here). It may have looked "expensive" then, yet it subsequently zoomed to $429 by November of that year before beginning a very deep consolidation (coupled with a Bear Market).
|
|
|
Color Codes Explained :
Y - Better candidates highlighted by our
staff of experts.
G - Previously featured
in past reports as yellow but may no longer be buyable under the
guidelines.
***Last / Change / Volume quote data in this table corresponds with the timestamp on the note***
Symbol/Exchange
Company Name
Industry Group |
Last |
Chg. |
Vol
% DAV |
Date Featured |
Price Featured |
Latest Pivot Point
Featured |
Status |
| Latest Max Buy Price |
ARO
- NYSE
Aeropostale Inc
RETAIL - Apparel Stores
|
$41.77
|
+0.11
|
2,172,032
71% DAV
3,062,100
|
8/21/2009
(Date
Featured) |
$39.21
(Price
Featured) |
PP = $38.84 |
G |
| MB = $40.78 |
Most Recent Note - 9/8/2009 6:54:15 PM
G - Posted another small gain today on light volume for a new high. Gapped up on 9/03/09 after raising guidance, closing near the session high with a gain on above average volume. Color code was changed to green after its rally above the previously cited max buy level. High-ranked leader in the Retail - Clothing/shoe group found support at prior highs in the $38 area. A gap up gain for a new all-time high on 8/21/09 helped trigger a technical buy signal as it rose from a flat base pattern with almost 3 times average volume. It was featured in yellow with new pivot point and max buy levels noted in the 8/21/09 Mid-Day BreakOuts Report (read here).
>>> The latest Featured Stock Update with an annotated graph appeared on 9/2/2009. click here.
|
|
C
A
S
I |
News |
Chart |
SEC
View all notes Alert
me of new notes
Company
Profile
|
ARST
-
|
$22.97
|
+1.00
|
1,154,121
150% DAV
768,900
|
9/1/2009
(Date
Featured) |
$19.91
(Price
Featured) |
PP = $20.90 |
G |
| MB = $21.95 |
Most Recent Note - 9/8/2009 6:57:18 PM
G - Gain today with above average volume for another new all-time high. Its color code is changed to green after rising beyond its max buy level. A considerable gain on 9/04/09 with nearly 3 times average volume triggered a technical buy signal after reporting results for the quarter ended July 31, 2009. Featured in yellow in the 9/01/09 mid-day report with an annotated daily graph (read here) and it was also featured with more detailed analysis in the September 2009 CANSLIM.net News with an annotated weekly graph (read here).
>>> The latest Featured Stock Update with an annotated graph appeared on 9/4/2009. click here.
|
|
C
A
S
I |
News |
Chart |
SEC
View all notes Alert
me of new notes
Company
Profile
|
BIDU
- NASDAQ
Baidu Inc Ads
INTERNET - Internet Information Providers
|
$357.15
|
+13.88
|
2,444,504
140% DAV
1,748,700
|
9/8/2009
(Date
Featured) |
$351.80
(Price
Featured) |
PP = $368.59 |
Y |
| MB = $387.02 |
Most Recent Note - 9/8/2009 7:00:59 PM
Y - Gapped up today, posting a gain backed by +39% above average volume while rallying on the right side of a near 6-week flat base toward its 52 week high after its latest test of support at its 50 DMA line which acted as firm support in July. It was featured in yellow in the 9/08/09 mid-day report (today's report) with new pivot point and max buy levels cited (read here). The latest consolidation is shorter than the minimum 8-week length of a proper "double bottom" pattern. This high-ranked leader has a solid quarterly and annual earnings history but a clear sequential deceleration in its increases is a concern. Based on weak technical action it was dropped from the Featured Stocks list on 1/11/08, when it was trading at $329, and it has rebounded very impressively from its January 2009 lows near $100.
>>> The latest Featured Stock Update with an annotated graph appeared on 9/8/2009. click here.
|
|
C
A
S
I |
News |
Chart |
SEC
View all notes Alert
me of new notes
Company
Profile
|
CPLA
- NASDAQ
Capella Education Co
DIVERSIFIED SERVICES - Education and Training Services
|
$63.16
|
+0.90
|
122,907
67% DAV
183,500
|
7/9/2009
(Date
Featured) |
$59.69
(Price
Featured) |
PP = $62.06 |
Y |
| MB = $65.16 |
Most Recent Note - 9/8/2009 7:02:43 PM
Y - Gain today on light volume was an encouraging sign of support offered by its 50 DMA line and prior chart highs. Still trading in a tight range on light volume near its pivot point, within close striking range of its 52-week high. The Commercial Services-Schools Group has shown some isolated leadership which is somewhat reassuring for the L criteria, but the groups still has low ranks and CPLA's Relative Strength rank has slumped to 55, under the 80+ guideline. Its small supply of only 13.9 million shares in the float could contribute to greater price volatility in the event of institutional accumulation or distribution. The number of top-rated funds owning an interest rose from 91 in Sept '08, to 139 as of June '09, which is reassuring with respect to the I criteria. It has a very good earnings history that satisfies the C & A criteria.
>>> The latest Featured Stock Update with an annotated graph appeared on 9/3/2009. click here.
|
|
C
A
S
I |
News |
Chart |
SEC
View all notes Alert
me of new notes
Company
Profile
|
CRM
- NYSE
Salesforce.com Inc
INTERNET - Internet Software & Services
|
$54.45
|
+1.65
|
1,901,674
100% DAV
1,909,900
|
8/16/2009
(Date
Featured) |
$47.12
(Price
Featured) |
PP = $45.59 |
G |
| MB = $47.87 |
Most Recent Note - 9/8/2009 7:05:45 PM
G - Gain on average volume today for a new high close for 2009, and its color code is changed to green. Consolidated in a tight trading range for a couple of weeks after its "breakaway gap" for a considerable gain on 8/21/09 with more than 5 times average volume. A Stock Bulletin was published with detailed analysis and an annotated graph on 8/16/09 (read here).
>>> The latest Featured Stock Update with an annotated graph appeared on 8/31/2009. click here.
|
|
C
A
S
I |
News |
Chart |
SEC
View all notes Alert
me of new notes
Company
Profile
|
EBIX
- NASDAQ
Ebix Inc
COMPUTER SOFTWARE & SERVICES - Business Software & Services
|
$54.05
|
+1.56
|
191,906
196% DAV
98,100
|
8/28/2009
(Date
Featured) |
$45.86
(Price
Featured) |
PP = $45.35 |
G |
| MB = $47.62 |
Most Recent Note - 9/8/2009 7:06:33 PM
G - Gain today with above average volume was its 12th consecutive gain, and it is very extended from its latest base. Prior chart highs near $46 are an important support level to watch on pullbacks. Featured in yellow in the 8/28/09 Mid-Day BreakOuts Report (read here). This high-ranked leader had traded up more than +59% after it was first featured in the March 2008 CANSLIM.net News (read here), but weak action later in the year subsequently prompted it to be dropped from the Featured Stocks list. Do not be confused by the 3:1 split that took effect on 10/09/08.
>>> The latest Featured Stock Update with an annotated graph appeared on 8/28/2009. click here.
|
|
C
A
S
I |
News |
Chart |
SEC
View all notes Alert
me of new notes
Company
Profile
|
GMCR
- NASDAQ
Green Mtn Coffee Roastrs
FOOD & BEVERAGE - Processed & Packaged Goods
|
$59.37
|
+0.77
|
985,477
62% DAV
1,584,300
|
7/17/2009
(Date
Featured) |
$60.15
(Price
Featured) |
PP = $63.79 |
G |
| MB = $66.98 |
Most Recent Note - 9/8/2009 7:08:24 PM
G - Small gain today on quiet volume, still trading under its 50 DMA line. As previously noted, "a violation of its prior chart low ($54.32 on 8/18/09) would complete a bearish 'head-and-shoulders' pattern and trigger more worrisome technical sell signals." GMCR traded up more than +168% since appearing with an annotated graph under the headline "It May Soon Be Time To Go Green" when featured in the January 2009 CANSLIM.net News (read here).
>>> The latest Featured Stock Update with an annotated graph appeared on 8/26/2009. click here.
|
|
C
A
S
I |
News |
Chart |
SEC
View all notes Alert
me of new notes
Company
Profile
|
NTES
- NASDAQ
Netease Inc Adr
INTERNET - Internet Information Providers
|
$44.23
|
+1.71
|
1,689,169
78% DAV
2,154,700
|
7/17/2009
(Date
Featured) |
$39.29
(Price
Featured) |
PP = $38.74 |
G |
| MB = $40.68 |
Most Recent Note - 9/8/2009 7:09:47 PM
G - Considerable gain today on lighter than average volume. It has been quietly consolidating in a tight range above support at its 50 DMA line and above prior chart highs in the $38 area. Deterioration below those levels would raise more serious concerns and triggger additional sell signals.
>>> The latest Featured Stock Update with an annotated graph appeared on 8/27/2009. click here.
|
|
C
A
S
I |
News |
Chart |
SEC
View all notes Alert
me of new notes
Company
Profile
|
NVEC
- NASDAQ
N V E Corp
ELECTRONICS - Semiconductor - Specialized
|
$54.89
|
+0.89
|
33,212
38% DAV
87,500
|
8/26/2009
(Date
Featured) |
$55.32
(Price
Featured) |
PP = $57.60 |
Y |
| MB = $60.48 |
Most Recent Note - 9/8/2009 7:13:20 PM
Y - Posted a 4th consecutive gain today on light volume, basing above important support at its 50 DMA line and prior chart highs. Color code is changed to yellow while its recently cited pivot point still stands, however disciplined investors will watch for the stock to produce solid gains above its latest pivot point backed by heavy volume to trigger a new buy signal. Quarterly sales revenues in the 6 million dollar range are still rather minuscule, leaving concerns.
>>> The latest Featured Stock Update with an annotated graph appeared on 9/1/2009. click here.
|
|
C
A
S
I |
News |
Chart |
SEC
View all notes Alert
me of new notes
Company
Profile
|
PEGA
- NASDAQ
Pegasystems Inc
COMPUTER SOFTWARE & SERVICES - Business Software & Services
|
$30.57
|
+0.48
|
267,177
71% DAV
373,700
|
7/29/2009
(Date
Featured) |
$27.53
(Price
Featured) |
PP = $27.49 |
G |
| MB = $28.86 |
Most Recent Note - 9/8/2009 7:14:55 PM
G - Today it posted a 3rd consecutive gain on light volume while consolidating above the previously cited upward trendline connecting its July-August lows. That trendline may be considered an initial technical support level above its 50 DMA line and prior chart highs.
>>> The latest Featured Stock Update with an annotated graph appeared on 8/24/2009. click here.
|
|
C
A
S
I |
News |
Chart |
SEC
View all notes Alert
me of new notes
Company
Profile
|
|
|
|
THESE ARE NOT BUY RECOMMENDATIONS!
Comments contained in the body of this report are technical
opinions only. The material herein has been obtained
from sources believed to be reliable and accurate, however,
its accuracy and completeness cannot be guaranteed.
This site is not an investment advisor, hence it does
not endorse or recommend any securities or other investments.
Any recommendation contained in this report may not
be suitable for all investors and it is not to be deemed
an offer or solicitation on our part with respect to
the purchase or sale of any securities. All trademarks,
service marks and trade names appearing in this report
are the property of their respective owners, and are
likewise used for identification purposes only.
This report is a service available
only to active Paid Premium Members.
You may opt-out of receiving report notifications
at any time. Questions or comments may be submitted
by writing to Premium Membership Services 665 S.E. 10 Street, Suite 201 Deerfield Beach, FL 33441-5634 or by calling 1-800-965-8307
or 954-785-1121.
|
|
|


