You are not logged in.
This means you
CAN ONLY VIEW reports that were published prior to Monday, April 14, 2025.
You
MUST UPGRADE YOUR MEMBERSHIP if you want to see any current reports.
AFTER MARKET UPDATE - WEDNESDAY, SEPTEMBER 7TH, 2011
Previous After Market Report Next After Market Report >>>
|
|
|
|
DOW |
+275.34 |
11,414.64 |
+2.47% |
|
Volume |
954,519,890 |
-15% |
|
Volume |
1,723,052,900 |
+2% |
|
NASDAQ |
+75.11 |
2,548.94 |
+3.04% |
|
Advancers |
2,720 |
88% |
|
Advancers |
2,209 |
82% |
|
S&P 500 |
+33.34 |
1,198.58 |
+2.86% |
|
Decliners |
333 |
11% |
|
Decliners |
392 |
15% |
|
Russell 2000 |
+28.60 |
709.47 |
+4.20% |
|
52 Wk Highs |
19 |
|
|
52 Wk Highs |
18 |
|
|
S&P 600 |
+15.20 |
388.44 |
+4.07% |
|
52 Wk Lows |
16 |
|
|
52 Wk Lows |
33 |
|
|
 |
Major Indices Rally With Positive Breadth But Scant New Leadership
Kenneth J. Gruneisen - Passed the CAN SLIM® Master's Exam
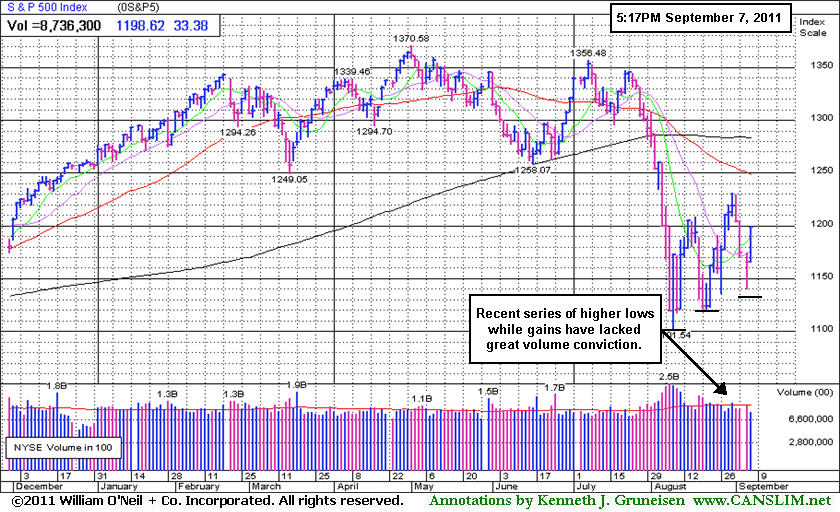
On Wednesday's session the market rebounded from three days of losses while investors anticipated a federal plan to create jobs. The volume totals were reported mixed, lower on the NYSE and higher on the Nasdaq exchange. Advancing issues outnumbered decliners by about 8-1 on the NYSE and by more than 5-1 on the Nasdaq exchange. The new 52-week lows list contracted considerably and new 52-week highs outnumbered new lows on the NYSE. There were only 9 high-ranked companies from the CANSLIM.net Leaders List that made new 52-week highs and appeared on the CANSLIM.net BreakOuts Page, down from the prior session total of 13 stocks. A further expansion in leadership would be a welcome reassurance for the current rally, and leadership will be critical factor in determining if stocks can extend the rally for a meaningful advance. Any sustainable rally requires a healthy crop of strong leaders hitting new 52-week highs, as this commentary has repeated! There were unanimous gains from the 7 high-ranked leaders currently included on the Featured Stocks Page.
Reports said that President Obama will propose a $300 billion plan during Thursday's much anticipated presentation, using a mixture of tax cuts, spending on infrastructure, and aid to local governments. Wednesday afternoon the market appeared relieved when the Federal Reserve's Beige Book survey said the economy continued to expand at a modest pace, even though it grew more slowly in some regions of the country.
A positive tone in Europe helped sentiment on Wall Street. A German court approved that country's participation in euro area rescue funds, and the Italian Senate approved the Prime Minister's austerity package. The German equity benchmark rallied +4%.
Management shake-ups helped boost shares of Bank of America Corp (BAC +7%) after the bank announced the departure of two senior executives. Also, Yahoo! Inc (YHOO +5.42%) fired its chief executive and announced a strategic review to revive growth. Nvidia Corp (NVDA +8.12%) rallied after the company forecast 2013 revenue above analyst estimates. Meanwhile, on the down side, Darden Restaurants Inc (DRI -3.55%) fell to the lowest in almost 11 months after reporting first-quarter profit below analysts' projections.
Energy stocks lifted along with oil prices. Crude oil climbed more than $3 per barrel in New York, the most in 3 weeks, as a weather system threatened to reduce U.S. production from the Gulf of Mexico. Meanwhile, gold futures slumped more than $50 per ounce.
Disciplined investors may carefully consider new buying efforts when all key criteria are satisfied, as the market environment (M criteria) may currently be described as an uptrend under pressure. However, the indices remain well below their respective 200-day moving average (DMA) lines, while to be considered truly "healthy" they would need to rebound above their long-term averages.
The September 2011 issue of CANSLIM.net News will be available soon. The Q3 2011 Webcast has also been scheduled for Wednesday, September 28th at 8PM EST. Links to all prior reports and webcasts are available on the Premium Member Homepage.
PICTURED: The S&P 500 Index has formed a recent series of higher lows while recent gains have lacked great volume conviction.
|
 Kenneth J. Gruneisen started out as a licensed stockbroker in August 1987, a couple of months prior to the historic stock market crash that took the Dow Jones Industrial Average down -22.6% in a single day. He has published daily fact-based fundamental and technical analysis on high-ranked stocks online for two decades. Through FACTBASEDINVESTING.COM, Kenneth provides educational articles, news, market commentary, and other information regarding proven investment systems that work in good times and bad.
Comments contained in the body of this report are technical opinions only and are not necessarily those of Gruneisen Growth Corp. The material herein has been obtained from sources believed to be reliable and accurate, however, its accuracy and completeness cannot be guaranteed. Our firm, employees, and customers may effect transactions, including transactions contrary to any recommendation herein, or have positions in the securities mentioned herein or options with respect thereto. Any recommendation contained in this report may not be suitable for all investors and it is not to be deemed an offer or solicitation on our part with respect to the purchase or sale of any securities. |
|
 |
Financial, Energy, and Tech Shares Led Gainers
Kenneth J. Gruneisen - Passed the CAN SLIM® Master's Exam
The Bank Index ($BKX +5.88%) and Broker/Dealer Index ($XBD +4.24%) tallied big gains on Wednesday, underpinning the major averages' gains. The Oil Services Index ($OSX +4.49%) and Integrated Oil Index ($XOI +3.36%) posted large gains as The tech sector rallied as the Semiconductor Index ($SOX +4.47%), Networking Index ($NWX +5.84%), Internet Index ($IIX +3.22%), and Biotechnology Index ($BTK +3.50%) finished unanimously higher. The Retail Index ($RLX +2.63%) was a positive influence and the Healthcare Index ($HMO +4.00%) also posted a solid gain, meanwhile the Gold & Silver Index ($XAU +0.64%).
Charts courtesy www.stockcharts.com
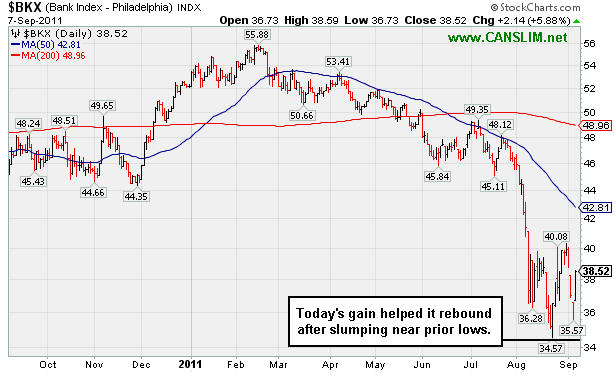
PICTURED: The Bank Index ($BKX +5.88%) posted a solid gain today, rebounding after slumping near prior lows.
| Oil Services |
$OSX |
235.30 |
+10.12 |
+4.49% |
-4.01% |
| Healthcare |
$HMO |
2,070.74 |
+79.62 |
+4.00% |
+22.39% |
| Integrated Oil |
$XOI |
1,149.13 |
+37.37 |
+3.36% |
-5.28% |
| Semiconductor |
$SOX |
354.26 |
+15.17 |
+4.47% |
-13.98% |
| Networking |
$NWX |
237.39 |
+13.10 |
+5.84% |
-15.38% |
| Internet |
$IIX |
285.39 |
+8.90 |
+3.22% |
-7.26% |
| Broker/Dealer |
$XBD |
88.27 |
+3.59 |
+4.24% |
-27.36% |
| Retail |
$RLX |
512.53 |
+13.13 |
+2.63% |
+0.82% |
| Gold & Silver |
$XAU |
224.49 |
+1.42 |
+0.64% |
-0.92% |
| Bank |
$BKX |
38.52 |
+2.14 |
+5.88% |
-26.22% |
| Biotech |
$BTK |
1,198.88 |
+40.49 |
+3.50% |
-7.61% |
|
|
|
 |
Gain With Twice Average Volume Lifts Firm Above "Max Buy" Level
Kenneth J. Gruneisen - Passed the CAN SLIM® Master's Exam
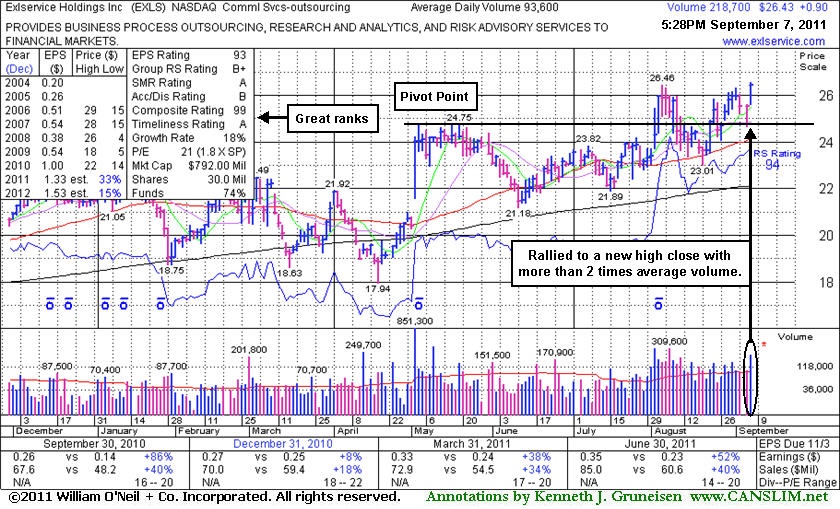
Exlservice Holdings Inc's (EXLS +$0.90 or +3.53% to $26.43) solid volume-driven gain today and strong finish helped it rally above its previously cited "max buy" level and its color code was changed to green. No resistance remains due to overhead supply, however it is extended from its prior base pattern. Since it was last shown in this FSU section on 8/25/11 with an annotated graph under the headline, "Volume Light on Pullback Below Pivot Point", it has tallied several gains backed by above average volume. Meanwhile, on any subsequent pullback, the stock's 50-day moving average (DMA) line defines important chart support to watch above its recent low ($23.01 on 8/19/11) and above its 200 DMA line.
Its Accumulation/Distribution rating has still been improving, and the current Up/Down Volume Ratio of 1.3 is indicative of recent institutional accumulation. It reported earnings +52% on +40% sales revenues for the quarter ended June 30, 2011 versus the year ago period. Quarterly comparisons (C criteria) have shown mostly impressive sales and earnings increases. Downturn in its FY '08 earnings was previously noted as a small flaw with respect to the A criteria of the fact-based investment system.
|
|
|
Color Codes Explained :
Y - Better candidates highlighted by our
staff of experts.
G - Previously featured
in past reports as yellow but may no longer be buyable under the
guidelines.
***Last / Change / Volume data in this table is the closing quote data***
Symbol/Exchange
Company Name
Industry Group |
PRICE |
CHANGE
(%Change) |
Day High |
Volume
(% DAV)
(% 50 day avg vol) |
52 Wk Hi
% From Hi |
Featured
Date |
Price
Featured |
Pivot Featured |
|
Max Buy |
EXLS
-
NASDAQ
Exlservice Holdings Inc
DIVERSIFIED SERVICES - Business/Management Services
|
$26.43
|
+0.90
3.53% |
$26.55
|
219,547
234.56% of 50 DAV
50 DAV is 93,600
|
$26.46
-0.11%
|
8/2/2011
|
$24.85
|
PP = $24.85
|
|
MB = $26.09
|
 Most Recent Note - 9/7/2011 4:24:04 PM
G - Solid volume-driven gain today helped it rally above its "max buy" level and its color code is changed to green. Its 50 DMA line defines important chart support to watch on pullbacks.
>>> The latest Featured Stock Update with an annotated graph appeared on 9/7/2011. Click here.
View all notes |
Alert me of new notes |
CANSLIM.net Company Profile |
SEC |
Zacks Reports |
StockTalk |
News |
Chart |
Request a new note
C
A N
S L
I M


|
FCFS
-
NASDAQ
First Cash Financial Svs
SPECIALTY RETAIL - Specialty Retail, Other
|
$48.84
|
+0.63
1.31% |
$49.07
|
488,987
140.11% of 50 DAV
50 DAV is 349,000
|
$48.30
1.12%
|
5/31/2011
|
$42.00
|
PP = $40.23
|
|
MB = $42.24
|
Most Recent Note - 9/7/2011 12:23:30 PM
G - Touched another new all-time high today after a strong finish on the prior session. It has not formed a sound new base pattern. Its 50 DMA line defines supports to watch.
>>> The latest Featured Stock Update with an annotated graph appeared on 9/6/2011. Click here.
View all notes |
Alert me of new notes |
CANSLIM.net Company Profile |
SEC |
Zacks Reports |
StockTalk |
News |
Chart |
Request a new note
C
A N
S L
I M
|
JCOM
-
NASDAQ
J 2 Global Communication
INTERNET - Internet Software and Services
|
$31.73
|
+1.04
3.39% |
$31.79
|
427,598
113.21% of 50 DAV
50 DAV is 377,700
|
$32.64
-2.79%
|
8/8/2011
|
$30.38
|
PP = $29.31
|
|
MB = $30.78
|
Most Recent Note - 9/7/2011 4:20:02 PM
G - Solid gain today broke a streak of 4 consecutive losses since reaching a new 52-week high on 8/30/11. Previous highs in the $30-31 area now define initial chart support on pullbacks.
>>> The latest Featured Stock Update with an annotated graph appeared on 8/29/2011. Click here.
View all notes |
Alert me of new notes |
CANSLIM.net Company Profile |
SEC |
Zacks Reports |
StockTalk |
News |
Chart |
Request a new note
C
A N
S L
I M
|
MA
-
NYSE
Mastercard Inc Cl A
DIVERSIFIED SERVICES - Business/Management Services
|
$339.10
|
+16.10
4.98% |
$339.34
|
1,643,642
107.35% of 50 DAV
50 DAV is 1,531,100
|
$340.42
-0.39%
|
8/3/2011
|
$324.82
|
PP = $322.38
|
|
MB = $338.50
|
Most Recent Note - 9/7/2011 4:22:20 PM
G - Gapped up today and rallied beyond its previously cited "max buy" level. Color code is changed to green. Important support at its 50 DMA line.
>>> The latest Featured Stock Update with an annotated graph appeared on 8/26/2011. Click here.
View all notes |
Alert me of new notes |
CANSLIM.net Company Profile |
SEC |
Zacks Reports |
StockTalk |
News |
Chart |
Request a new note
C
A N
S L
I M
|
MG
-
NYSE
Mistras Group Inc
DIVERSIFIED SERVICES - Bulding and Faci;ity Management Services
|
$20.38
|
+1.00
5.16% |
$20.64
|
408,204
249.06% of 50 DAV
50 DAV is 163,900
|
$20.82
-2.11%
|
8/10/2011
|
$17.89
|
PP = $17.58
|
|
MB = $18.46
|
Most Recent Note - 9/7/2011 12:30:31 PM
G - Consolidating well above prior highs, perched within close striking distance of its 52-week high today. Prior resistance in the $18 area and its 50 DMA line define important chart support to watch on pullbacks.
>>> The latest Featured Stock Update with an annotated graph appeared on 8/24/2011. Click here.
View all notes |
Alert me of new notes |
CANSLIM.net Company Profile |
SEC |
Zacks Reports |
StockTalk |
News |
Chart |
Request a new note
C
A N
S L
I M
|
Symbol/Exchange
Company Name
Industry Group |
PRICE |
CHANGE
(%Change) |
Day High |
Volume
(% DAV)
(% 50 day avg vol) |
52 Wk Hi
% From Hi |
Featured
Date |
Price
Featured |
Pivot Featured |
|
Max Buy |
MKTX
-
NASDAQ
Marketaxess Holdings Inc
FINANCIAL SERVICES - Investment Brokerage - Nationa
|
$30.24
|
+1.65
5.77% |
$30.33
|
225,272
93.40% of 50 DAV
50 DAV is 241,200
|
$30.95
-2.29%
|
7/29/2011
|
$25.87
|
PP = $26.35
|
|
MB = $27.67
|
Most Recent Note - 9/7/2011 1:22:45 PM
G - Gapped up today, rallying within close striking distance of its 52-week high following 5 consecutive small losses since reaching its high. It is extended from its prior base. Prior resistance in the $26 area and its 50 DMA line define important chart support to watch.
>>> The latest Featured Stock Update with an annotated graph appeared on 9/2/2011. Click here.
View all notes |
Alert me of new notes |
CANSLIM.net Company Profile |
SEC |
Zacks Reports |
StockTalk |
News |
Chart |
Request a new note
C
A N
S L
I M
|
PSMT
-
NASDAQ
Pricesmart Inc
RETAIL - Drug Stores
|
$66.13
|
+2.32
3.64% |
$66.25
|
362,388
131.06% of 50 DAV
50 DAV is 276,500
|
$68.05
-2.82%
|
8/30/2011
|
$63.01
|
PP = $62.37
|
|
MB = $65.49
|
Most Recent Note - 9/7/2011 4:26:34 PM
G - Gap up gain today with above average volume helped it rally above its "max buy" level, and its color code is changed to green. On its pullback following last week's technical breakout the prior highs acted as support. A subsequent close under its old high close ($61.54 on 8/03/11) would completely negate the recent technical breakout.
>>> The latest Featured Stock Update with an annotated graph appeared on 8/30/2011. Click here.
View all notes |
Alert me of new notes |
CANSLIM.net Company Profile |
SEC |
Zacks Reports |
StockTalk |
News |
Chart |
Request a new note
C
A N
S L
I M
|
|
|
|
THESE ARE NOT BUY RECOMMENDATIONS!
Comments contained in the body of this report are technical
opinions only. The material herein has been obtained
from sources believed to be reliable and accurate, however,
its accuracy and completeness cannot be guaranteed.
This site is not an investment advisor, hence it does
not endorse or recommend any securities or other investments.
Any recommendation contained in this report may not
be suitable for all investors and it is not to be deemed
an offer or solicitation on our part with respect to
the purchase or sale of any securities. All trademarks,
service marks and trade names appearing in this report
are the property of their respective owners, and are
likewise used for identification purposes only.
This report is a service available
only to active Paid Premium Members.
You may opt-out of receiving report notifications
at any time. Questions or comments may be submitted
by writing to Premium Membership Services 665 S.E. 10 Street, Suite 201 Deerfield Beach, FL 33441-5634 or by calling 1-800-965-8307
or 954-785-1121.
|
|
|

