You are not logged in.
This means you
CAN ONLY VIEW reports that were published prior to Monday, February 26, 2024.
You
MUST UPGRADE YOUR MEMBERSHIP if you want to see any current reports.
AFTER MARKET UPDATE - THURSDAY, SEPTEMBER 5TH, 2019
Previous After Market Report Next After Market Report >>>
|
|
|
|
DOW |
+372.68 |
26,728.15 |
+1.41% |
|
Volume |
878,432,280 |
+17% |
|
Volume |
2,062,496,499 |
+11% |
|
NASDAQ |
+139.95 |
8,116.83 |
+1.75% |
|
Advancers |
1,895 |
66% |
|
Advancers |
2,259 |
73% |
|
S&P 500 |
+38.22 |
2,976.00 |
+1.30% |
|
Decliners |
956 |
34% |
|
Decliners |
828 |
27% |
|
Russell 2000 |
+25.99 |
1,510.75 |
+1.75% |
|
52 Wk Highs |
178 |
|
|
52 Wk Highs |
103 |
|
|
S&P 600 |
+17.93 |
932.40 |
+1.96% |
|
52 Wk Lows |
11 |
|
|
52 Wk Lows |
52 |
|
|
 |
Major Indices Rebounded Above Respective 50-Day Moving Averages
Kenneth J. Gruneisen - Passed the CAN SLIM® Master's Exam
The Dow advanced 372 points, while the S&P 500 gained 1.3%. The Nasdaq Composite climbed by 1.8%. All three major indices rebounded above their respective 50-day moving average lines. Volume totals reported were heavier than the prior session totals on the NYSE and on the Nasdaq exchange, revealing an encouraging increase in institutional buying demand. Breadth was positive as advancers led decliners by a 2-1 margin on the NYSE and by 11-4 on the Nasdaq exchange. Leadership improved as 74 high-ranked companies from the Leaders List hit new 52-week highs and were listed on the BreakOuts Page, versus the total of 53 on the prior session. New 52-week highs totals expanded and outnumbered shrinking new 52-week lows totals on the NYSE and on the Nasdaq exchange. Concerning the M criteria of the fact-based investment system, investors have a green light to make carefully selected new buying efforts. Subsequent losses below prior low for the Nasdaq Composite Index would technically kill the new rally. The Featured Stocks Page provides the most timely analysis on high-ranked leaders. Charts used courtesy of www.stockcharts.com
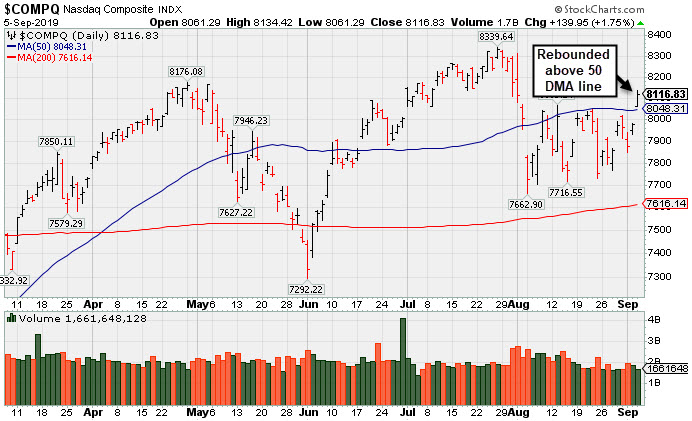
PICTURED: The Nasdaq Composite Index rebounded above its 50-day moving average (DMA) line with Thursday's gain helping its technical stance. The recent low defines important support. More damaging losses would raise concerns and prompt investors to reduce their exposure to stocks.
The major averages extended gains Thursday as positive trade developments and better than expected economic updates boosted investor sentiment. According to the Chinese Ministry of Commerce, the United States and Beijing reached an agreement to hold in person negotiations in October.
On the data front, the ADP employment report showed that 195,000 jobs were added in the month of August, topping expectations of 148,000. Initial jobless claims rose slightly to 217,000 in the most recent week, while the prior period was upwardly revised to 216,000. Separately, ISM’s gauge of service sector activity came in at 56.4 for August, above consensus estimates of 54.0 and the prior months’ 53.7 figure. Treasuries weakened along the curve with the yield on the benchmark 10-year note climbing 10 basis points to 1.56%. On the short end of the curve, the yield on the two-year note jumped 11 basis points 1.54%.
Eight of 11 S&P 500 sectors finished in positive territory with Technology shares pacing the gains. Financials and Industrials also outperformed as the groups added 1.9% and 1.8% respectively. The perceived “defensive” Utilities, Consumer Staples, and Real Estate sectors were the laggards. In M&A news, CVS (CVS +1.80%) roe after a judge ruled in favor of allowing healthcare company to acquire insurer Aetna . In commodities, WTI crude finished essentially unchanged after a bigger-than-expected U.S. inventory build-up wiped out strong early session gains. COMEX gold slipped 2.2% to $1519.20/ounce, its worst session since June 2018.
|
 Kenneth J. Gruneisen started out as a licensed stockbroker in August 1987, a couple of months prior to the historic stock market crash that took the Dow Jones Industrial Average down -22.6% in a single day. He has published daily fact-based fundamental and technical analysis on high-ranked stocks online for two decades. Through FACTBASEDINVESTING.COM, Kenneth provides educational articles, news, market commentary, and other information regarding proven investment systems that work in good times and bad.
Comments contained in the body of this report are technical opinions only and are not necessarily those of Gruneisen Growth Corp. The material herein has been obtained from sources believed to be reliable and accurate, however, its accuracy and completeness cannot be guaranteed. Our firm, employees, and customers may effect transactions, including transactions contrary to any recommendation herein, or have positions in the securities mentioned herein or options with respect thereto. Any recommendation contained in this report may not be suitable for all investors and it is not to be deemed an offer or solicitation on our part with respect to the purchase or sale of any securities. |
|
 |
Financial, Retail, Tech and Energy-Linked Groups Rose
Kenneth J. Gruneisen - Passed the CAN SLIM® Master's Exam
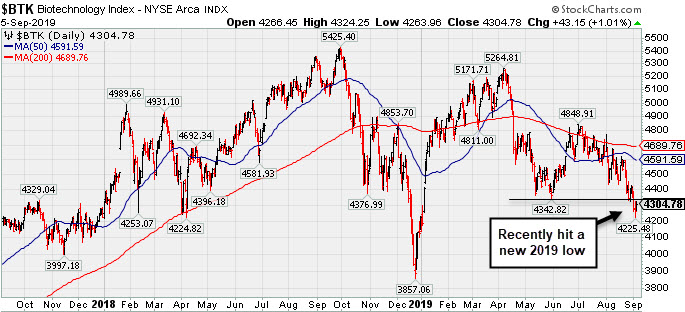
The Bank Index ($BKX +2.59%) and the Broker/Dealer Index ($XBD +2.33%) both posted solid gains along with the Retail Index ($RLX +2.15%). The tech sector had a positive bias as the Semiconductor Index ($SOX +3.07%), Networking Index ($NWX +1.85%), and Biotech Index ($BTK +1.01%) rose. Commodity-linked groups were mixed as the Integrated Oil Index ($XOI +1.03%) and the Oil Services Index ($OSX +4.414%) rose, meanwhile, the Gold & Silver Index ($XAU -4.41%) was a standout decliner.
PICTURED: The Biotech Index ($BTK +1.01%) is in weak technical shape, below its 50 and 200 DMA lines, and it recently fell to a new 2019 low.
| Oil Services |
$OSX |
66.29 |
+2.63 |
+4.13% |
-17.75% |
| Integrated Oil |
$XOI |
1,188.37 |
+12.07 |
+1.03% |
+2.53% |
| Semiconductor |
$SOX |
1,566.21 |
+46.66 |
+3.07% |
+35.58% |
| Networking |
$NWX |
557.64 |
+10.14 |
+1.85% |
+14.11% |
| Broker/Dealer |
$XBD |
263.10 |
+5.96 |
+2.32% |
+10.86% |
| Retail |
$RLX |
2,405.74 |
+50.63 |
+2.15% |
+23.28% |
| Gold & Silver |
$XAU |
97.27 |
-4.49 |
-4.41% |
+37.66% |
| Bank |
$BKX |
94.90 |
+2.40 |
+2.59% |
+10.62% |
| Biotech |
$BTK |
4,304.78 |
+43.15 |
+1.01% |
+1.99% |
|
|
|
 |
Heavy Volume Behind Breakout Gain After Earnings Report
Kenneth J. Gruneisen - Passed the CAN SLIM® Master's Exam
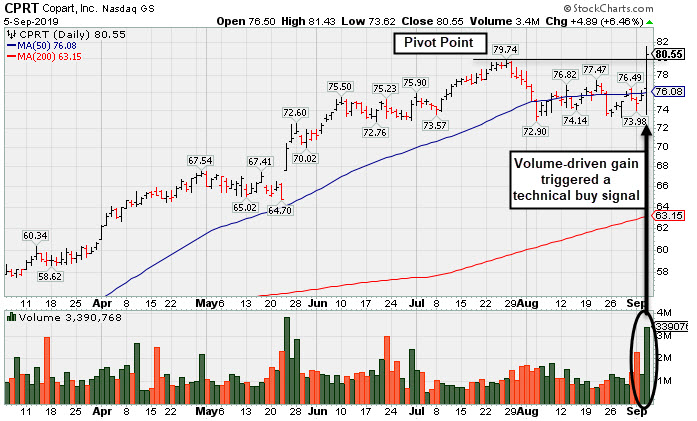
Copart Inc (CPRT +$4.95 or +6.54% to $80.61) finished strong after highlighted in yellow with pivot point cited based on its 7/26/19 high plus 10 cents in the earlier mid-day report (read here). It hit a new all-time high with today's big volume-driven gain, rallying from below its 50-day moving average (DMA) line. The gain and strong close above the pivot point backed by +217% above average volume clinched a technical buy signal.
Bullish action came after it reported earnings +43% on +21% sales revenues for the Jul '19 quarter. Three of the past 4 quarterly earnings increases were above the +25% minimum guideline (C criteria) and its sales revenues growth rate has accelerated. Annual earnings (A criteria) history has been strong and steady since a downturn in FY '13.
The number of top-rated funds owning its shares rose from 1,120 in Sep '18 to 1,269 in Jun '19, a reassuring sign concerning the I criteria. It has a Timeliness Rating of B and Sponsorship Rating of B.
|
|
|
Color Codes Explained :
Y - Better candidates highlighted by our
staff of experts.
G - Previously featured
in past reports as yellow but may no longer be buyable under the
guidelines.
***Last / Change / Volume data in this table is the closing quote data***
Symbol/Exchange
Company Name
Industry Group |
PRICE |
CHANGE
(%Change) |
Day High |
Volume
(% DAV)
(% 50 day avg vol) |
52 Wk Hi
% From Hi |
Featured
Date |
Price
Featured |
Pivot Featured |
|
Max Buy |
 EPAM
-
NYSE
EPAM
-
NYSE
Epam Systems Inc
COMPUTER SOFTWARE and SERVICES - Information Technology Service
|
$194.82
|
+3.38
1.77% |
$195.79
|
305,039
77.03% of 50 DAV
50 DAV is 396,000
|
$201.00
-3.07%
|
5/9/2019
|
$169.25
|
PP = $180.55
|
|
MB = $189.58
|
Most Recent Note - 9/4/2019 1:14:32 PM
G - Faces some resistance due to overhead supply up to the $201 level. Quietly consolidating near its 50 DMA line ($188.31) which defines support above the recent low ($175.33 on 8/07/19). Reported earnings +27% on +24% sales revenues for the Jun '19 quarter. See the latest FSU analysis for more details and an annotated graph.
>>> FEATURED STOCK ARTICLE : Volume Light During Brief Consolidation Above 50-Day Average - 8/29/2019 |
View all notes |
Set NEW NOTE alert |
Company Profile |
SEC
News |
Chart |
Request a new note
C
A
S
I |
AUDC
-
NASDAQ
Audiocodes Ltd
ELECTRONICS - Scientific and Technical Instrum
|
$17.43
|
+0.00
0.00% |
$17.54
|
204,031
119.32% of 50 DAV
50 DAV is 171,000
|
$19.74
-11.70%
|
7/15/2019
|
$17.10
|
PP = $17.54
|
|
MB = $18.42
|
 Most Recent Note - 9/5/2019 12:54:41 PM
Y - Consolidating near important support defined by its 50 DMA line ($17.27) and recent low ($16.51 on 8/14/19). More damaging losses would raise concerns and trigger technical sell signals. Reported earnings +57% on +14% sales revenues for the Jun '19 quarter, continuing its strong earnings track record.
>>> FEATURED STOCK ARTICLE : Volume Cooling While Consolidating Above Support Levels - 8/30/2019 |
View all notes |
Set NEW NOTE alert |
Company Profile |
SEC
News |
Chart |
Request a new note
C
A
S
I |
LHCG
-
NASDAQ
L H C Group Inc
HEALTH SERVICES - Home Health Care
|
$120.17
|
+0.27
0.23% |
$121.47
|
241,018
109.55% of 50 DAV
50 DAV is 220,000
|
$129.37
-7.11%
|
7/1/2019
|
$110.94
|
PP = $122.20
|
|
MB = $128.31
|
Most Recent Note - 9/5/2019 12:59:30 PM
G - Still quietly sputtering just below its 50 DMA line ($121.30) which has acted as resistance. A breach of the prior low ($116.67 on 8/13/19) would raise more serious concerns and trigger a worrisome technical sell signal.
>>> FEATURED STOCK ARTICLE : Sputtering Below 50-Day Average and Below Pivot Point - 8/20/2019 |
View all notes |
Set NEW NOTE alert |
Company Profile |
SEC
News |
Chart |
Request a new note
C
A
S
I |
CHDN
-
NASDAQ
Churchill Downs Inc
LEISURE - Gaming Activities
|
$124.02
|
+1.19
0.97% |
$126.34
|
259,075
114.13% of 50 DAV
50 DAV is 227,000
|
$132.73
-6.56%
|
7/22/2019
|
$118.45
|
PP = $118.89
|
|
MB = $124.83
|
Most Recent Note - 9/4/2019 5:37:23 PM
Y - Its 50 DMA line ($119) and prior low ($113.88 on 8/05/19) define important near-term support to watch. Jun '19 earnings +10% on +26% sales revenues versus the year ago period were below the +25% minimum earnings guideline (C criteria), noted recently raising fundamental concerns. See the latest FSU analysis for more details and a new annotated graph.
>>> FEATURED STOCK ARTICLE : Found Support After Making Limited Progress - 9/4/2019 |
View all notes |
Set NEW NOTE alert |
Company Profile |
SEC
News |
Chart |
Request a new note
C
A
S
I |
LULU
-
NASDAQ
Lululemon Athletica
MANUFACTURING - Textile Manufacturing
|
$188.41
|
+7.71
4.27% |
$188.95
|
4,697,359
318.90% of 50 DAV
50 DAV is 1,473,000
|
$194.25
-3.01%
|
6/13/2019
|
$174.48
|
PP = $179.60
|
|
MB = $188.58
|
Most Recent Note - 9/5/2019 12:38:16 PM
G - Rebounding above its 50 DMA line ($183.82) with today's 2nd consecutive gain with above average volume. Faces little near-term resistance due to overhead supply up to the $194 level. Due to report earnings news after the close. Volume and volatility often increase near earnings news. See the latest FSU analysis for more details and an annotated graph.
>>> FEATURED STOCK ARTICLE : Sank Below 50-Day Average Toward Prior Lows With High Volume - 9/3/2019 |
View all notes |
Set NEW NOTE alert |
Company Profile |
SEC
News |
Chart |
Request a new note
C
A
S
I |
Symbol/Exchange
Company Name
Industry Group |
PRICE |
CHANGE
(%Change) |
Day High |
Volume
(% DAV)
(% 50 day avg vol) |
52 Wk Hi
% From Hi |
Featured
Date |
Price
Featured |
Pivot Featured |
|
Max Buy |
CPRT
-
NASDAQ
Copart Inc
SPECIALTY RETAIL - Auto Dealerships
|
$80.61
|
+4.95
6.54% |
$81.43
|
3,668,818
316.82% of 50 DAV
50 DAV is 1,158,000
|
$79.74
1.09%
|
9/5/2019
|
$79.13
|
PP = $79.84
|
|
MB = $83.83
|
Most Recent Note - 9/5/2019 4:45:39 PM
Y - Finished strong today after highlighted in yellow with pivot point cited based on its 7/26/19 high plus 10 cents. The big volume-driven gain above the pivot point clinched a technical buy signal. Reported earnings +43% on +21% sales revenues for the Jul '19 quarter. Three of the past 4 quarterly earnings increases were above the +25% minimum guideline (C criteria) and its sales revenues growth rate has accelerated. Annual earnings (A criteria) history has been strong and steady since a downturn in FY '13. See the latest FSU analysis for more details and a new annotated graph.
>>> FEATURED STOCK ARTICLE : Heavy Volume Behind Breakout Gain After Earnings Report - 9/5/2019 |
View all notes |
Set NEW NOTE alert |
Company Profile |
SEC
News |
Chart |
Request a new note
C
A
S
I |
VEEV
-
NYSE
Veeva Systems Inc Cl A
Computer Sftwr-Medical
|
$159.42
|
+2.91
1.86% |
$159.74
|
924,325
65.09% of 50 DAV
50 DAV is 1,420,000
|
$176.90
-9.88%
|
5/30/2019
|
$154.32
|
PP = $145.80
|
|
MB = $153.09
|
Most Recent Note - 9/5/2019 1:04:02 PM
G - Still sputtering below its 50 DMA line ($164.30). A convincing rebound is needed for its outlook to improve. The 50 DMA line has acted as resistance. Reported earnings +41% on +27% for the Jul '19 quarter continuing its strong earnings track record.
>>> FEATURED STOCK ARTICLE : Met Resistance After Slumping Below 50-Day Moving Average - 8/23/2019 |
View all notes |
Set NEW NOTE alert |
Company Profile |
SEC
News |
Chart |
Request a new note
C
A
S
I |
PAYC
-
NYSE
Paycom Software Inc
COMPUTER SOFTWARE and SERVICES - Application Software
|
$252.69
|
+4.81
1.94% |
$252.75
|
540,004
91.99% of 50 DAV
50 DAV is 587,000
|
$259.71
-2.70%
|
8/20/2019
|
$246.97
|
PP = $246.95
|
|
MB = $259.30
|
Most Recent Note - 9/5/2019 12:57:56 PM
Y - Volume totals still have been cooling while hovering near its all-time high. Color code was changed to yellow with new pivot point cited based on its 7/11/19 high plus 10 cents. Recent gains above the pivot point did not have the +40% above average volume necessary to trigger a proper new (or add-on) technical buy signal. Its 50 DMA line ($239) defines support above the recent low ($216.55 on 8/05/19). Fundamentals remain strong.
>>> FEATURED STOCK ARTICLE : Recently Wedged Higher Without Great Volume Conviction - 8/26/2019 |
View all notes |
Set NEW NOTE alert |
Company Profile |
SEC
News |
Chart |
Request a new note
C
A
S
I |
BLD
-
NYSE
Topbuild Corp
Bldg-Constr Prds/Misc
|
$91.42
|
-0.92
-1.00% |
$93.63
|
250,405
86.95% of 50 DAV
50 DAV is 288,000
|
$93.59
-2.32%
|
5/17/2019
|
$82.19
|
PP = $87.31
|
|
MB = $91.68
|
Most Recent Note - 9/4/2019 5:39:38 PM
G - Posted a gain today on light volume and it is perched within close striking distance of its all-time high. Earnings rose +39% on +9% sales revenues for the Jun '19 quarter versus the year ago period. Prior highs in the $86 area define initial support to watch above its 50 DMA line ($85.54) on pullbacks.
>>> FEATURED STOCK ARTICLE : Topbuild Has 4 Consecutive Weekly Gains and Stubbornly Held Ground - 8/19/2019 |
View all notes |
Set NEW NOTE alert |
Company Profile |
SEC
News |
Chart |
Request a new note
C
A
S
I |
TEAM
-
NASDAQ
Atlassian Corp Plc Cl A
Comp Sftwr-Spec Enterprs
|
$133.34
|
+3.51
2.70% |
$133.46
|
2,325,396
182.96% of 50 DAV
50 DAV is 1,271,000
|
$149.80
-10.99%
|
8/27/2019
|
$142.62
|
PP = $149.90
|
|
MB = $157.40
|
Most Recent Note - 9/5/2019 1:03:07 PM
G - On track today for a 7th consecutive loss, and this week it undercut the prior low ($130.78 on 7/23/19) triggering a more worrisome technical sell signal. Fundamentals remain strong. A rebound above the 50 DMA line ($138.08) is needed for its outlook to improve.
>>> FEATURED STOCK ARTICLE : Consolidating Near High After Recently Finding Support - 8/21/2019 |
View all notes |
Set NEW NOTE alert |
Company Profile |
SEC
News |
Chart |
Request a new note
C
A
S
I |
Symbol/Exchange
Company Name
Industry Group |
PRICE |
CHANGE
(%Change) |
Day High |
Volume
(% DAV)
(% 50 day avg vol) |
52 Wk Hi
% From Hi |
Featured
Date |
Price
Featured |
Pivot Featured |
|
Max Buy |
TTD
-
NASDAQ
The Trade Desk Inc Cl A
Comml Svcs-Advertising
|
$243.71
|
+3.52
1.47% |
$245.20
|
924,072
64.67% of 50 DAV
50 DAV is 1,429,000
|
$289.51
-15.82%
|
7/18/2019
|
$240.61
|
PP = $258.10
|
|
MB = $271.01
|
Most Recent Note - 9/3/2019 5:46:35 PM
G - Slumped below its 50 DMA line ($248) and below the recent low ($239.01 on 8/21/19) raising concerns and triggering technical sell signals. Only a prompt rebound above the 50 DMA line would help its outlook improve. Reported Jun '19 quarterly earnings +58% on +42% sales revenues.
>>> FEATURED STOCK ARTICLE : Consolidating Near 50-Day Moving Average Line - 8/16/2019 |
View all notes |
Set NEW NOTE alert |
Company Profile |
SEC
News |
Chart |
Request a new note
C
A
S
I |
PAGS
-
NYSE
Pagseguro Digital Cl A
Finance-CrdtCard/PmtPr
|
$52.88
|
+1.48
2.88% |
$53.35
|
1,352,014
61.18% of 50 DAV
50 DAV is 2,210,000
|
$53.43
-1.03%
|
6/25/2019
|
$37.69
|
PP = $40.07
|
|
MB = $42.07
|
Most Recent Note - 9/4/2019 12:51:17 PM
G - Perched within striking distance of its all-time high with today's gain on light volume. Volume totals have been cooling while stubbornly holding its ground near its all-time high. Its 50 DMA line ($45.52) and the recent low ($42.00 on 8/05/19) define important levels to watch on pullbacks. Reported earnings +35% on +39% sales revenues for the quarter ended June 30,2019 versus the year ago period.
>>> FEATURED STOCK ARTICLE : Brazil-Based Digital Payments Firm Perched at All-Time High - 8/22/2019 |
View all notes |
Set NEW NOTE alert |
Company Profile |
SEC
News |
Chart |
Request a new note
C
A
S
I |
|
|
|
THESE ARE NOT BUY RECOMMENDATIONS!
Comments contained in the body of this report are technical
opinions only. The material herein has been obtained
from sources believed to be reliable and accurate, however,
its accuracy and completeness cannot be guaranteed.
This site is not an investment advisor, hence it does
not endorse or recommend any securities or other investments.
Any recommendation contained in this report may not
be suitable for all investors and it is not to be deemed
an offer or solicitation on our part with respect to
the purchase or sale of any securities. All trademarks,
service marks and trade names appearing in this report
are the property of their respective owners, and are
likewise used for identification purposes only.
This report is a service available
only to active Paid Premium Members.
You may opt-out of receiving report notifications
at any time. Questions or comments may be submitted
by writing to Premium Membership Services 665 S.E. 10 Street, Suite 201 Deerfield Beach, FL 33441-5634 or by calling 1-800-965-8307
or 954-785-1121.
|
|
|