You are not logged in.
This means you
CAN ONLY VIEW reports that were published prior to Monday, February 26, 2024.
You
MUST UPGRADE YOUR MEMBERSHIP if you want to see any current reports.
AFTER MARKET UPDATE - WEDNESDAY, SEPTEMBER 2ND, 2020
Previous After Market Report Next After Market Report >>>
|
|
|
|
DOW |
+454.84 |
29,100.50 |
+1.59% |
|
Volume |
885,493,749 |
+9% |
|
Volume |
3,954,738,900 |
+14% |
|
NASDAQ |
+121.06 |
12,060.73 |
+1.01% |
|
Advancers |
1,920 |
65% |
|
Advancers |
1,959 |
59% |
|
S&P 500 |
+54.19 |
3,580.84 |
+1.54% |
|
Decliners |
1,014 |
35% |
|
Decliners |
1,357 |
41% |
|
Russell 2000 |
+13.71 |
1,592.29 |
+0.87% |
|
52 Wk Highs |
165 |
|
|
52 Wk Highs |
262 |
|
|
S&P 600 |
+10.86 |
920.20 |
+1.19% |
|
52 Wk Lows |
12 |
|
|
52 Wk Lows |
49 |
|
|
 |
Leadership and Volume Improved as Major Indices Rallied
Kenneth J. Gruneisen - Passed the CAN SLIM® Master's Exam
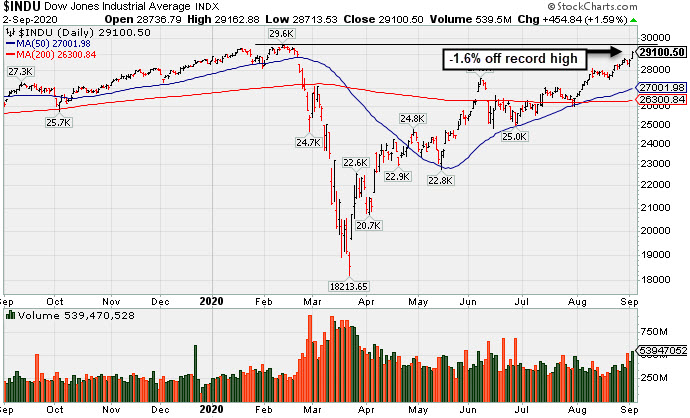
The Dow climbed 454 points, its strongest day since mid-July. The blue chip index now sits within 1.6% of its all-time high notched on February 12. The S&P 500 closed at its 22nd record level of the year, rallying 1.5%, its best day in nearly two months. The Nasdaq Composite also ended the session at a new all-time high despite Tech shares lagging on a relative basis. The reported volume totals were higher than the prior session totals on the NYSE and on the Nasdaq exchange. Breadth was positive as advancers led decliners by almost a 2-1 margin on the NYSE and 3-2 on the Nasdaq exchange. There were 102 high-ranked companies from the Leaders List that hit new 52-week highs and were listed on the BreakOuts Page, versus the total of 75 on the prior session. New 52-week highs totals expanded and easily outnumbered new 52-week lows totals on both the NYSE and Nasdaq exchange. The major indices are in a confirmed uptrend (M criteria). Any sustainable rally requires a healthy crop of new leaders, so it remains ever-important to see substantial new highs totals.
Charts used courtesy of www.stockcharts.com
PICTURED: The Dow Jones Industrial Average posted a solid gain to finish -1.6% off its record high.
Stocks powered higher on Wednesday as investors assessed economic data and found comfort in recent dovish comments from central bank policymakers. On the data front, a report from ADP showed 428,000 private jobs were added to the U.S. economy in August, missing expectations of a 1 million gain, but better than July’s disappointing 167,000 uptick. A separate update showed July factory orders matched June’s upwardly revised 6.4% reading, while the final update on durable goods orders improved to 11.4% from 11.2% in July. Longer-dated Treasuries strengthened, with the yield on the 10-year note down three basis points to 0.65%. In commodities, WTI crude lost 2.9% to $41.54/barrel, as the U.S. dollar rebounded from a two-year low.
Ten of 11 S&P 500 sectors closed in positive territory with the Energy group the sole decliner. The more cyclical and value-oriented stocks outperformed, with Utilities climbing the most, up 3.1%. In earnings, Brown-Forman (BFA +9.61%) rose following stronger-than-expected results. In other corporate news, AMC Entertainment (AMC +15.98% rose after announcing that 70% of its U.S. theaters would reopen by Friday. Elsewhere, NVIDIA (NVDA +3.8%) rose on the heels of broadly positive Wall Street analyst commentary.
|
 Kenneth J. Gruneisen started out as a licensed stockbroker in August 1987, a couple of months prior to the historic stock market crash that took the Dow Jones Industrial Average down -22.6% in a single day. He has published daily fact-based fundamental and technical analysis on high-ranked stocks online for two decades. Through FACTBASEDINVESTING.COM, Kenneth provides educational articles, news, market commentary, and other information regarding proven investment systems that work in good times and bad.
Comments contained in the body of this report are technical opinions only and are not necessarily those of Gruneisen Growth Corp. The material herein has been obtained from sources believed to be reliable and accurate, however, its accuracy and completeness cannot be guaranteed. Our firm, employees, and customers may effect transactions, including transactions contrary to any recommendation herein, or have positions in the securities mentioned herein or options with respect thereto. Any recommendation contained in this report may not be suitable for all investors and it is not to be deemed an offer or solicitation on our part with respect to the purchase or sale of any securities. |
|
 |
Retail, Financial, and Tech Indices Rose
Kenneth J. Gruneisen - Passed the CAN SLIM® Master's Exam
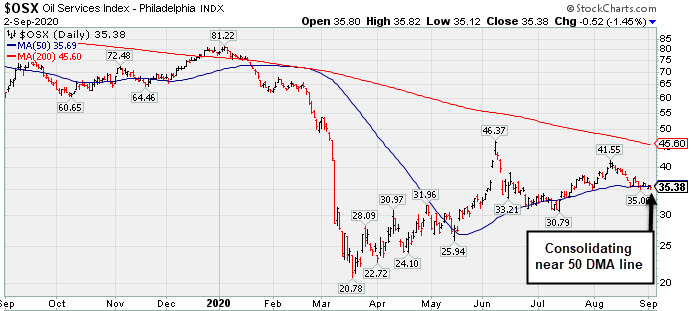
Gains from the Retail Index ($RLX +1.05%), Bank Index ($BKX +1.51%), and the Broker/Dealer Index ($XBD +0.69%) underpinned the major indices' advance. The tech sector had a positive bias as the Semiconductor Index ($SOX +2.84%), Networking Index ($NWX +1.66%), and Biotech Index ($BTK +1.89%) posted unanimous gains. The Oil Services Index ($OSX -1.44%) and Integrated Oil Index ($XOI -0.79%) both lost ground while the Gold & Silver Index ($XAU -0.00%) finished flat.
PICTURED: The Oil Services Index ($OSX -1.44%) has sputtered in recent months and found support near its 50-day moving average (DMA) line when consolidating.
| Oil Services |
$OSX |
35.39 |
-0.52 |
-1.44% |
-54.80% |
| Integrated Oil |
$XOI |
711.15 |
-5.65 |
-0.79% |
-44.03% |
| Semiconductor |
$SOX |
2,370.18 |
+65.50 |
+2.84% |
+28.14% |
| Networking |
$NWX |
606.42 |
+9.89 |
+1.66% |
+3.94% |
| Broker/Dealer |
$XBD |
298.95 |
+2.06 |
+0.69% |
+2.95% |
| Retail |
$RLX |
3,691.71 |
+38.48 |
+1.05% |
+50.73% |
| Gold & Silver |
$XAU |
152.39 |
-0.00 |
-0.00% |
+42.53% |
| Bank |
$BKX |
78.15 |
+1.16 |
+1.51% |
-31.06% |
| Biotech |
$BTK |
5,463.31 |
+101.33 |
+1.89% |
+7.81% |
|
|
|
 |
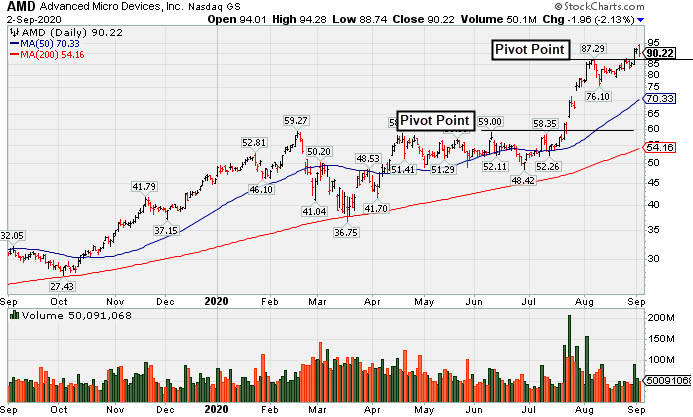
Perched at All-Time High After Another Bullish Breakout
Kenneth J. Gruneisen - Passed the CAN SLIM® Master's Exam
Advanced Micro Devices (AMD -$1.96 or -2.13% to $90.22) hit a new all-time high and traded above its "max buy" level today but reversed and ended the session slightly lower. Its color code was recently changed to yellow with new pivot point cited based on its 8/07/20 high after an advanced "3-weeks tight" base. The gain above its pivot point on 8/31/20 was backed by +44% above average volume triggering a new (or add-on) technical buy signal. On pullbacks, the recent low ($76.10 on 8/11/20) defines near-term support to watch above its 50-day moving average (DMA) line ($70.33).
Fundamentals remain strong. Bullish action came after it reported earnings +125% on +26% sales revenues for the Jun '20 quarter versus the year ago period. The 4 latest quarterly comparisons through Jun '20 showed very strong earnings increases well above the +25% minimum guideline (C criteria) with strong underlying sales revenues growth versus the year ago periods. Annual earnings growth (A criteria) has been very strong after losses in FY '15 and '16. it has a highest possible 99 Earnings Per Share Rating.
AMD hails from the Electronics - Semiconductor Fabless industry which has a Group Relative Strength Rating of 92 (L criteria). It has a large supply of 1.17 billion shares outstanding (S criteria), which makes it less likely to be a quick sprinter. However, the number of top-rated funds owning its shares rose from 1,669 in Jun '19 to 2,140 in Jun '20, a reassuring sign concerning the I criteria. Its current Up/Down Volume Ratio of 1.2 is an unbiased indication its shares have been under accumulation over the past 50 days. It has a Timeliness Rating of A, a Sponsorship Rating of B, and an Accumulation/Distribution rating of A-.
|
|
|
Color Codes Explained :
Y - Better candidates highlighted by our
staff of experts.
G - Previously featured
in past reports as yellow but may no longer be buyable under the
guidelines.
***Last / Change / Volume data in this table is the closing quote data***
Symbol/Exchange
Company Name
Industry Group |
PRICE |
CHANGE
(%Change) |
Day High |
Volume
(% DAV)
(% 50 day avg vol) |
52 Wk Hi
% From Hi |
Featured
Date |
Price
Featured |
Pivot Featured |
|
Max Buy |
 CRL
-
NYSE
CRL
-
NYSE
Charles River Labs Intl
DRUGS - Biotechnology
|
$220.11
|
+4.06
1.88% |
$220.49
|
206,422
59.83% of 50 DAV
50 DAV is 345,000
|
$221.97
-0.84%
|
7/15/2020
|
$192.66
|
PP = $189.95
|
|
MB = $199.45
|
Most Recent Note - 9/1/2020 5:43:55 PM
G - Volume was higher (near average) behind today's small loss while still hovering in a very tight range near its all-time high. The 50 DMA line ($199.65) defines initial support to watch above the prior high ($189.85 on 6/03/20). Recently reported Jun '20 quarterly earnings -3% on +4% sales revenues, below the +25% minimum guideline (C criteria), but better than expected while the company also raised its guidance.
>>> FEATURED STOCK ARTICLE : Volume Totals Cooling While Hovering in Tight Range Near Record High - 8/25/2020 |
View all notes |
Set NEW NOTE alert |
Company Profile |
SEC
News |
Chart |
Request a new note
C
A
S
I |
EBS
-
NYSE
Emergent Biosolutions
DRUGS - Biotechnology
|
$111.51
|
+0.67
0.60% |
$111.81
|
594,840
60.39% of 50 DAV
50 DAV is 985,000
|
$137.61
-18.97%
|
7/7/2020
|
$89.47
|
PP = $93.68
|
|
MB = $98.36
|
 Most Recent Note - 9/2/2020 5:36:05 PM
G - Consolidating above its prior high $107.16 on 7/20/20) and its 50 DMA line ($106.69) which define important near-term support to watch. Fundamentals remain strong.
>>> FEATURED STOCK ARTICLE : High Ranked Biomed Leader is Extended From Prior Base - 8/21/2020 |
View all notes |
Set NEW NOTE alert |
Company Profile |
SEC
News |
Chart |
Request a new note
C
A
S
I |
AMD
-
NASDAQ
Advanced Micro Devices
ELECTRONICS - Semiconductor - Broad Line
|
$90.22
|
-1.96
-2.13% |
$94.28
|
50,120,935
79.54% of 50 DAV
50 DAV is 63,017,000
|
$92.64
-2.61%
|
8/31/2020
|
$90.42
|
PP = $87.39
|
|
MB = $91.76
|
Most Recent Note - 9/2/2020 5:31:16 PM
Y - Hit a new all-time high above its "max buy" level today before reversing and ending lower. Rose from an advanced "3-weeks tight" base this week. The recent low ($76.10 on 8/11/20) defines near-term support above its 50 DMA line ($70.33). Fundamentals remain strong. See the latest FSU analysis for more details and a new annotated graph.
>>> FEATURED STOCK ARTICLE : Perched at All-Time High After Another Bullish Breakout - 9/2/2020 |
View all notes |
Set NEW NOTE alert |
Company Profile |
SEC
News |
Chart |
Request a new note
C
A
S
I |
TREX
-
NYSE
Trex Company Inc
MATERIALS and CONSTRUCTION - General Building Materials
|
$152.28
|
-3.40
-2.18% |
$156.39
|
420,802
53.88% of 50 DAV
50 DAV is 781,000
|
$156.63
-2.78%
|
6/26/2020
|
$109.05
|
PP = $132.94
|
|
MB = $139.59
|
Most Recent Note - 9/1/2020 5:38:56 PM
G - Hit another new all-time high with today's big gain backed by higher (near average) volume. It is extended from any sound base. Important near-term support is at its 50 DMA line ($136.72). Reported Jun '20 quarterly earnings +27% on +7% sales revenues versus the year ago period.
>>> FEATURED STOCK ARTICLE : Wedging Into New High Territory After Latest Earnings Report - 8/19/2020 |
View all notes |
Set NEW NOTE alert |
Company Profile |
SEC
News |
Chart |
Request a new note
C
A
S
I |
NFLX
-
NASDAQ
Netflix Inc
SPECIALTY RETAIL - Music and Video Stores
|
$552.84
|
-3.71
-0.67% |
$556.50
|
5,841,763
75.13% of 50 DAV
50 DAV is 7,776,000
|
$575.37
-3.92%
|
9/1/2020
|
$547.45
|
PP = $575.47
|
|
MB = $604.24
|
Most Recent Note - 9/1/2020 12:47:53 PM
Y - Color code is changed to yellow with new pivot point cited based on its 7/13/20 high plus 10 cents. Subsequent volume-driven gains above the pivot point may trigger a new (or add-on) technical buy signal. Found support near its 50 DMA line ($494) on consolidations during its ongoing ascent. Fundamentals remain strong.
>>> FEATURED STOCK ARTICLE : 50-Day Moving Average Acted As Support Level - 8/18/2020 |
View all notes |
Set NEW NOTE alert |
Company Profile |
SEC
News |
Chart |
Request a new note
C
A
S
I |
Symbol/Exchange
Company Name
Industry Group |
PRICE |
CHANGE
(%Change) |
Day High |
Volume
(% DAV)
(% 50 day avg vol) |
52 Wk Hi
% From Hi |
Featured
Date |
Price
Featured |
Pivot Featured |
|
Max Buy |
CHGG
-
NYSE
Chegg Inc
Consumer Svcs-Education
|
$77.96
|
+1.38
1.80% |
$78.29
|
3,874,216
107.74% of 50 DAV
50 DAV is 3,596,000
|
$89.82
-13.20%
|
6/17/2020
|
$63.71
|
PP = $68.08
|
|
MB = $71.48
|
Most Recent Note - 9/1/2020 5:42:42 PM
G - Rebounded to close above its 50 DMA line ($74.81) with today's gain backed by lighter volume. Faces near-term resistance due to overhead supply up to the $89 level. More damaging losses would raise greater concerns and trigger a worrisome technical sell signal. Reported Jun '20 quarterly earnings +61% on +63% sales revenues versus the year ago period.
>>> FEATURED STOCK ARTICLE : Volume-Driven Loss Tests Support at 50-Day Moving Average - 8/24/2020 |
View all notes |
Set NEW NOTE alert |
Company Profile |
SEC
News |
Chart |
Request a new note
C
A
S
I |
LGIH
-
NASDAQ
L G I Homes Inc
Bldg-Resident/Comml
|
$122.91
|
+6.95
5.99% |
$123.64
|
554,800
175.02% of 50 DAV
50 DAV is 317,000
|
$123.94
-0.83%
|
7/7/2020
|
$99.19
|
PP = $95.82
|
|
MB = $100.61
|
Most Recent Note - 9/2/2020 5:34:09 PM
G - Posted a solid volume-driven gain today for a best ever close while challenging its 52-week high. It did not form a sound new base of sufficient length. Its 50 DMA line ($107.86) defines near-term support to watch above the prior low ($104.24 on 8/11/20). Reported Jun '20 quarterly earnings +21% on +4% sales revenues, breaking a streak of 4 comparisons above the +25% minimum guideline (C criteria).
>>> FEATURED STOCK ARTICLE : Leadership in Building - Residential/Commercial Group Improving - 8/20/2020 |
View all notes |
Set NEW NOTE alert |
Company Profile |
SEC
News |
Chart |
Request a new note
C
A
S
I |
NOW
-
NYSE
Servicenow Inc
Computer Sftwr-Enterprse
|
$499.69
|
+2.50
0.50% |
$501.82
|
1,272,368
74.58% of 50 DAV
50 DAV is 1,706,000
|
$497.25
0.49%
|
8/20/2020
|
$453.34
|
PP = $454.79
|
|
MB = $477.53
|
Most Recent Note - 9/1/2020 5:44:47 PM
G - Hit yet another new all-time high today with light volume behind its gain, getting more extended from the latest base. On pullbacks the prior high ($45) defines initial support to watch above its 50 DMA line ($433). Fundamentals remain strong. See the latest FSU analysis for more details and an annotated graph.
>>> FEATURED STOCK ARTICLE : Quiet Gain to New High for Computer Software Firm - 8/28/2020 |
View all notes |
Set NEW NOTE alert |
Company Profile |
SEC
News |
Chart |
Request a new note
C
A
S
I |
TTD
-
NASDAQ
The Trade Desk Inc Cl A
Comml Svcs-Advertising
|
$515.01
|
+13.62
2.72% |
$515.20
|
1,715,049
133.26% of 50 DAV
50 DAV is 1,287,000
|
$510.00
0.98%
|
6/3/2020
|
$340.61
|
PP = $327.35
|
|
MB = $343.72
|
Most Recent Note - 9/1/2020 5:40:02 PM
G - Posted a gain with light volume today for its best ever close. Volume totals have been cooling in recent weeks while holding its ground perched near its all-time high. Recently reported Jun '20 quarterly earnings -3% on -13% sales revenues versus the year ago period, raising fundamental concerns. It is extended from any sound base of sufficient length. Its 50 DMA line ($451) defines near-term support above the prior low ($404 on 7/24/20) where violations may trigger technical sell signals.
>>> FEATURED STOCK ARTICLE : Volume Totals Cooling While Still Hovering Near Record High - 8/27/2020 |
View all notes |
Set NEW NOTE alert |
Company Profile |
SEC
News |
Chart |
Request a new note
C
A
S
I |
DOCU
-
NASDAQ
Docusign Inc
Computer Sftwr-Enterprse
|
$265.16
|
-3.64
-1.35% |
$290.23
|
25,162,568
528.85% of 50 DAV
50 DAV is 4,758,000
|
$271.44
-2.31%
|
6/10/2020
|
$149.73
|
PP = $152.10
|
|
MB = $159.71
|
Most Recent Note - 9/2/2020 12:32:38 PM
G - There was a "negative reversal" today after hitting yet another new all-time high. A big "breakaway gap" and volume-driven gain on 9/01/20 followed 5 consecutive gains with below average volume. It did not form a sound base of sufficient length. Its 50 DMA line ($203.52) and prior low ($189.12 on 8/12/20) define important near-term support to watch.
>>> FEATURED STOCK ARTICLE : Perched Near All-Time High After Finding Support Above 50 DMA - 8/31/2020 |
View all notes |
Set NEW NOTE alert |
Company Profile |
SEC
News |
Chart |
Request a new note
C
A
S
I |
Symbol/Exchange
Company Name
Industry Group |
PRICE |
CHANGE
(%Change) |
Day High |
Volume
(% DAV)
(% 50 day avg vol) |
52 Wk Hi
% From Hi |
Featured
Date |
Price
Featured |
Pivot Featured |
|
Max Buy |
PING
-
NYSE
Ping Identity Holdings Corp
Computer Sftwr-Security
|
$36.05
|
-0.32
-0.88% |
$37.50
|
803,479
65.30% of 50 DAV
50 DAV is 1,230,400
|
$37.80
-4.63%
|
6/1/2020
|
$29.24
|
PP = $29.90
|
|
MB = $31.40
|
Most Recent Note - 9/1/2020 5:37:43 PM
G - Closed near the session high as it posted a big gain today with below average volume. Near-term support levels to watch are its 50 DMA line ($33.48) and prior low ($30.50 on 8/13/20). Sputtering in recent weeks after it reported Jun '20 quarterly earnings -27% on -6% sales revenues versus the year ago period, below the +25% minimum earnings guideline, raising fundamental concerns. Completed Secondary Offerings on 7/09/20 and 5/15/20.
>>> FEATURED STOCK ARTICLE : Found Support Near 50 DMA Line But Latest Earnings Were Sub Par - 8/26/2020 |
View all notes |
Set NEW NOTE alert |
Company Profile |
SEC
News |
Chart |
Request a new note
C
A
S
I |
DT
-
NYSE
Dynatrace Inc
Computer Sftwr-Enterprse
|
$46.69
|
-0.40
-0.85% |
$48.85
|
5,476,942
177.08% of 50 DAV
50 DAV is 3,093,000
|
$47.68
-2.08%
|
9/1/2020
|
$46.37
|
PP = $44.75
|
|
MB = $46.99
|
Most Recent Note - 9/2/2020 12:33:56 PM
Y - Reversed into the red after earlier gains into new high territory. Finished strong after highlighted in yellow with pivot point cited based on its 7/10/20 high plus 10 cents in the 9/01/20 mid-day report. Hit a new 52-week high with a "breakaway gap" and volume was +67% above average behind the big gain triggering a technical buy signal. Completed yet another Secondary Offering on 6/03/20. Went through a deep consolidation and rebounded impressively since completing a Secondary Offering on 2/21/20. Reported earnings +333% on +27% sales revenues for the Jun '20 quarter versus the year ago period, its 4th consecutive strong quarterly comparison versus the year ago periods. Limited history has been noted as a concern since it completed its $16.00 IPO on 8/01/19 and a Secondary Offering on 12/06/19. See the latest FSU analysis for more details and an annotated graph.
>>> FEATURED STOCK ARTICLE : Volume-Driven Gain for New High Triggered Technical Buy Signal - 9/1/2020 |
View all notes |
Set NEW NOTE alert |
Company Profile |
SEC
News |
Chart |
Request a new note
C
A
S
I |
|
|
|
THESE ARE NOT BUY RECOMMENDATIONS!
Comments contained in the body of this report are technical
opinions only. The material herein has been obtained
from sources believed to be reliable and accurate, however,
its accuracy and completeness cannot be guaranteed.
This site is not an investment advisor, hence it does
not endorse or recommend any securities or other investments.
Any recommendation contained in this report may not
be suitable for all investors and it is not to be deemed
an offer or solicitation on our part with respect to
the purchase or sale of any securities. All trademarks,
service marks and trade names appearing in this report
are the property of their respective owners, and are
likewise used for identification purposes only.
This report is a service available
only to active Paid Premium Members.
You may opt-out of receiving report notifications
at any time. Questions or comments may be submitted
by writing to Premium Membership Services 665 S.E. 10 Street, Suite 201 Deerfield Beach, FL 33441-5634 or by calling 1-800-965-8307
or 954-785-1121.
|
|
|