Symbol/Exchange
Company Name
Industry Group |
PRICE |
CHANGE
(%Change) |
Day High |
Volume
(% DAV)
(% 50 day avg vol) |
52 Wk Hi
% From Hi |
Featured
Date |
Price
Featured |
Pivot Featured |
|
Max Buy |
ABV
-
NYSE
Comp De Bebidas Adr
FOOD and BEVERAGE - Beverages - Brewers
|
$113.21
|
+0.32
0.28% |
$114.13
|
556,867
85.20% of 50 DAV
50 DAV is 653,600
|
$114.23
-0.89%
|
6/29/2010
|
$104.74
|
PP = $109.33
|
|
MB = $114.80
|
Most Recent Note - 8/31/2010 3:54:13 PM
G - This Brazil-based beverage firm is poised for a new high close with today's gain. Found support near its 50 DMA line recently.
>>> The latest Featured Stock Update with an annotated graph appeared on 8/18/2010. Click here.
View all notes |
Alert me of new notes |
CANSLIM.net Company Profile |
SEC |
Zacks Reports |
StockTalk |
News |
Chart |
Request a new note
C
A N
S L
I M


|
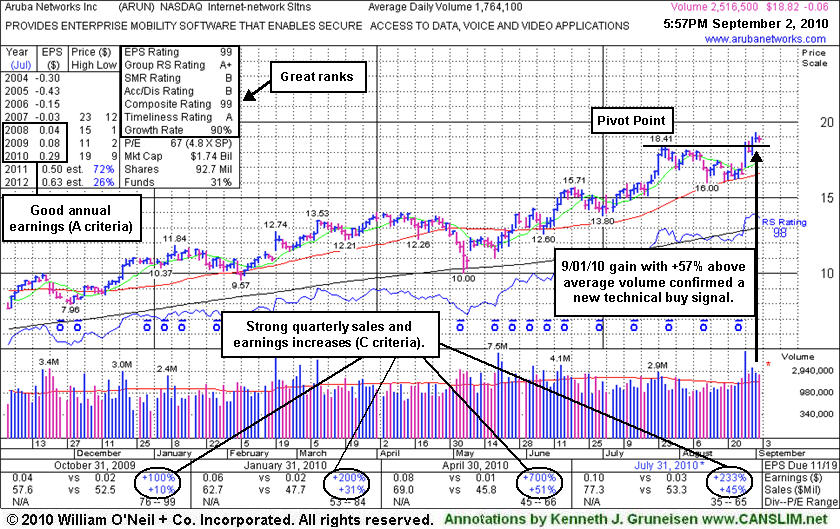
ARUN
-
NASDAQ
Aruba Networks Inc
COMPUTER HARDWARE - Networking andamp; Communication Dev
|
$18.82
|
-0.06
-0.32% |
$19.06
|
2,519,671
144.63% of 50 DAV
50 DAV is 1,742,100
|
$19.32
-2.59%
|
8/30/2010
|
$18.12
|
PP = $18.51
|
|
MB = $19.44
|
 Most Recent Note - 9/2/2010 12:26:41 PM
Y - Holding its ground today after recent gains for new 52-week highs backed by above average volume helped it rally above its pivot point from a base-on-base type pattern. Confirming gains and a follow-through day on 9/01/10 (M criteria) helped trigger a technical buy signal.
>>> The latest Featured Stock Update with an annotated graph appeared on 9/2/2010. Click here.
View all notes |
Alert me of new notes |
CANSLIM.net Company Profile |
SEC |
Zacks Reports |
StockTalk |
News |
Chart |
Request a new note
C
A N
S L
I M
|
BIDU
-
NASDAQ
Baidu Inc Ads
INTERNET - Internet Information Providers
|
$82.61
|
+0.77
0.94% |
$83.40
|
5,592,703
52.60% of 50 DAV
50 DAV is 10,633,400
|
$88.32
-6.47%
|
7/14/2010
|
$75.03
|
PP = $78.59
|
|
MB = $82.52
|
Most Recent Note - 9/1/2010 2:01:57 PM
Y - Gapped up today, rallying from its 50 DMA line again amid widespread leadership and solid gains from the major averages (better M criteria). Color code is changed to yellow as gains helping it rally from its 10-week average may be considered a secondary buy point. It may be considered "late-stage" and riskier than fresh breakouts.
>>> The latest Featured Stock Update with an annotated graph appeared on 8/13/2010. Click here.
View all notes |
Alert me of new notes |
CANSLIM.net Company Profile |
SEC |
Zacks Reports |
StockTalk |
News |
Chart |
Request a new note
C
A N
S L
I M
|
CACC
-
NASDAQ
Credit Acceptance Corp
FINANCIAL SERVICES - Credit Services
|
$59.49
|
+0.01
0.02% |
$59.76
|
14,509
27.02% of 50 DAV
50 DAV is 53,700
|
$61.41
-3.13%
|
7/29/2010
|
$52.04
|
PP = $54.07
|
|
MB = $56.77
|
Most Recent Note - 9/1/2010 3:36:35 PM
G - Gain today on light volume. Consolidating well above its 50 DMA and old highs near $54 that define support.
>>> The latest Featured Stock Update with an annotated graph appeared on 8/2/2010. Click here.
View all notes |
Alert me of new notes |
CANSLIM.net Company Profile |
SEC |
Zacks Reports |
StockTalk |
News |
Chart |
Request a new note
C
A N
S L
I M
|
CMG
-
NYSE
Chipotle Mexican Grill
LEISURE - Restaurants
|
$164.19
|
+4.78
3.00% |
$164.19
|
1,117,126
163.11% of 50 DAV
50 DAV is 684,900
|
$159.54
2.91%
|
9/1/2010
|
$158.31
|
PP = $155.52
|
|
MB = $163.30
|
Most Recent Note - 9/2/2010 12:31:19 PM
Y - Gapped up today and briefly traded above its "max buy" level. Technically, it broke out on 9/01/10, rallying to multi-year highs with a considerable gain backed 2 times average volume. See the last evening's Featured Stock Update section for detailed analysis and an annotated graph.
>>> The latest Featured Stock Update with an annotated graph appeared on 9/1/2010. Click here.
View all notes |
Alert me of new notes |
CANSLIM.net Company Profile |
SEC |
Zacks Reports |
StockTalk |
News |
Chart |
Request a new note
C
A N
S L
I M
|
Symbol/Exchange
Company Name
Industry Group |
PRICE |
CHANGE
(%Change) |
Day High |
Volume
(% DAV)
(% 50 day avg vol) |
52 Wk Hi
% From Hi |
Featured
Date |
Price
Featured |
Pivot Featured |
|
Max Buy |
CRM
-
NYSE
Salesforce.Com Inc
INTERNET - Internet Software and Services
|
$119.12
|
+2.72
2.34% |
$119.59
|
3,689,810
143.74% of 50 DAV
50 DAV is 2,567,000
|
$116.81
1.98%
|
6/2/2010
|
$88.44
|
PP = $89.60
|
|
MB = $94.08
|
Most Recent Note - 9/2/2010 4:36:48 PM
G - Gain today for another new all-time high. It is extended from a sound base, not currently buyable under the investment system guidelines.
>>> The latest Featured Stock Update with an annotated graph appeared on 8/16/2010. Click here.
View all notes |
Alert me of new notes |
CANSLIM.net Company Profile |
SEC |
Zacks Reports |
StockTalk |
News |
Chart |
Request a new note
C
A N
S L
I M
|
EGO
-
NYSE
Eldorado Gold Corp
METALS and MINING - Gold
|
$19.46
|
+0.20
1.04% |
$19.60
|
3,468,564
84.47% of 50 DAV
50 DAV is 4,106,500
|
$20.06
-2.99%
|
8/19/2010
|
$18.25
|
PP = $19.17
|
|
MB = $20.13
|
Most Recent Note - 9/1/2010 12:54:31 PM
Y - Pulling back today near its pivot point following a recent streak of volume-driven gains to new 52-week highs amid strong leadership (L criteria) in the group. The Canada-based mining firm triggered a technical buy signal last week. Gains today for the major averages (M criteria) have the look of a solid follow-through day confirming a new rally.
>>> The latest Featured Stock Update with an annotated graph appeared on 8/19/2010. Click here.
View all notes |
Alert me of new notes |
CANSLIM.net Company Profile |
SEC |
Zacks Reports |
StockTalk |
News |
Chart |
Request a new note
C
A N
S L
I M
|
FFIV
-
NASDAQ
F 5 Networks Inc
INTERNET - Internet Software and Services
|
$91.11
|
+0.37
0.41% |
$91.69
|
1,612,511
96.98% of 50 DAV
50 DAV is 1,662,700
|
$92.70
-1.72%
|
6/16/2010
|
$74.50
|
PP = $74.10
|
|
MB = $77.81
|
Most Recent Note - 9/1/2010 2:05:11 PM
G - Consolidating in a tight range in the past 3 weeks following a bout of heavy distribution. Its 50 DMA line and recent lows near $80 define support.
>>> The latest Featured Stock Update with an annotated graph appeared on 8/4/2010. Click here.
View all notes |
Alert me of new notes |
CANSLIM.net Company Profile |
SEC |
Zacks Reports |
StockTalk |
News |
Chart |
Request a new note
C
A N
S L
I M
|
FOSL
-
NASDAQ
Fossil Inc
CONSUMER DURABLES - Recreational Goods, Other
|
$49.91
|
+1.11
2.27% |
$50.37
|
1,142,052
126.68% of 50 DAV
50 DAV is 901,500
|
$49.50
0.83%
|
8/10/2010
|
$45.54
|
PP = $42.69
|
|
MB = $44.82
|
Most Recent Note - 9/2/2010 4:40:49 PM
G - Closed today at a new all-time high. Extended from any sound base after a recent streak of gains. Prior high in the $46 area defines support to watch.
>>> The latest Featured Stock Update with an annotated graph appeared on 8/11/2010. Click here.
View all notes |
Alert me of new notes |
CANSLIM.net Company Profile |
SEC |
Zacks Reports |
StockTalk |
News |
Chart |
Request a new note
C
A N
S L
I M
|
GMCR
-
NASDAQ
Green Mtn Coffee Roastrs
FOOD and BEVERAGE - Processed and Packaged Goods
|
$31.33
|
+0.49
1.59% |
$31.45
|
1,281,468
56.42% of 50 DAV
50 DAV is 2,271,500
|
$33.98
-7.80%
|
8/17/2010
|
$33.62
|
PP = $33.30
|
|
MB = $34.97
|
Most Recent Note - 9/2/2010 4:45:47 PM
Y - Consolidating above its 50 DMA line, it has formed a handle after the previously noted cup shaped pattern, and its color code is changed to yellow. Confirming gains for a new high close are needed to trigger a buy signal.
>>> The latest Featured Stock Update with an annotated graph appeared on 8/17/2010. Click here.
View all notes |
Alert me of new notes |
CANSLIM.net Company Profile |
SEC |
Zacks Reports |
StockTalk |
News |
Chart |
Request a new note
C
A N
S L
I M
|
Symbol/Exchange
Company Name
Industry Group |
PRICE |
CHANGE
(%Change) |
Day High |
Volume
(% DAV)
(% 50 day avg vol) |
52 Wk Hi
% From Hi |
Featured
Date |
Price
Featured |
Pivot Featured |
|
Max Buy |
HS
-
NYSE
Healthspring Inc
HEALTH SERVICES - Health Care Plans
|
$21.73
|
+0.15
0.70% |
$21.74
|
771,851
131.51% of 50 DAV
50 DAV is 586,900
|
$21.82
-0.41%
|
8/27/2010
|
$19.91
|
PP = $19.75
|
|
MB = $20.74
|
Most Recent Note - 9/2/2010 12:35:51 PM
G - Extended from its prior base, support to watch now is prior chart highs in the $19-20 area.
>>> The latest Featured Stock Update with an annotated graph appeared on 8/27/2010. Click here.
View all notes |
Alert me of new notes |
CANSLIM.net Company Profile |
SEC |
Zacks Reports |
StockTalk |
News |
Chart |
Request a new note
C
A N
S L
I M
|
MELI
-
NASDAQ
Mercadolibre Inc
INTERNET - Internet Software and; Services
|
$69.89
|
+1.49
2.18% |
$71.05
|
832,999
82.04% of 50 DAV
50 DAV is 1,015,300
|
$70.95
-1.49%
|
5/13/2010
|
$54.21
|
PP = $55.85
|
|
MB = $58.64
|
Most Recent Note - 9/2/2010 11:18:23 AM
G - Hit a new 52-week high today, getting extended from any sound base. Prior highs in the $62 area and its 50 DMA line define chart support.
>>> The latest Featured Stock Update with an annotated graph appeared on 8/26/2010. Click here.
View all notes |
Alert me of new notes |
CANSLIM.net Company Profile |
SEC |
Zacks Reports |
StockTalk |
News |
Chart |
Request a new note
C
A N
S L
I M
|
MRX
-
NYSE
Medicis Pharmaceut Cl A
DRUGS - Biotechnology
|
$29.47
|
+0.86
3.01% |
$29.61
|
2,001,262
170.20% of 50 DAV
50 DAV is 1,175,800
|
$28.65
2.86%
|
8/12/2010
|
$26.88
|
PP = $26.71
|
|
MB = $28.05
|
Most Recent Note - 9/2/2010 12:45:06 PM
G - Hit another new 52-week high today. Color code was changed to green after volume-driven gains beyond its "max buy" level. Prior highs in the $28 area define an initial chart support level to watch.
>>> The latest Featured Stock Update with an annotated graph appeared on 8/12/2010. Click here.
View all notes |
Alert me of new notes |
CANSLIM.net Company Profile |
SEC |
Zacks Reports |
StockTalk |
News |
Chart |
Request a new note
C
A N
S L
I M
|
MWIV
-
NASDAQ
M W I Veterinary Supply
HEALTH SERVICES - Medical Instruments and; Supplies
|
$55.27
|
+0.77
1.41% |
$55.48
|
41,879
53.83% of 50 DAV
50 DAV is 77,800
|
$55.46
-0.34%
|
7/29/2010
|
$52.05
|
PP = $52.09
|
|
MB = $54.69
|
Most Recent Note - 9/2/2010 4:49:14 PM
G - Gain on light volume today for a new all-time high above its "max buy" level. Color code is changed to green. Recent lows in the $46 area define an important chart support level.
>>> The latest Featured Stock Update with an annotated graph appeared on 7/30/2010. Click here.
View all notes |
Alert me of new notes |
CANSLIM.net Company Profile |
SEC |
Zacks Reports |
StockTalk |
News |
Chart |
Request a new note
C
A N
S L
I M
|
NEM
-
NYSE
Newmont Mining Corp
METALS and MINING - Gold
|
$61.53
|
+1.21
2.01% |
$61.54
|
5,199,686
71.38% of 50 DAV
50 DAV is 7,284,600
|
$63.38
-2.92%
|
8/31/2010
|
$61.32
|
PP = $63.48
|
|
MB = $66.65
|
Most Recent Note - 9/2/2010 4:50:51 PM
Y - Closed 40 cents off its 7/09/10 high close today with gain on light volume. Color code was changed to yellow with new pivot point cited based on its 52-week high plus ten cents. Disciplined investors will watch for a confirming gain above its pivot with heavy volume. Leadership in the Mining - Gold/Silver/Gems group (L criteria) is a nice reassurance.
>>> The latest Featured Stock Update with an annotated graph appeared on 8/6/2010. Click here.
View all notes |
Alert me of new notes |
CANSLIM.net Company Profile |
SEC |
Zacks Reports |
StockTalk |
News |
Chart |
Request a new note
C
A N
S L
I M
|
Symbol/Exchange
Company Name
Industry Group |
PRICE |
CHANGE
(%Change) |
Day High |
Volume
(% DAV)
(% 50 day avg vol) |
52 Wk Hi
% From Hi |
Featured
Date |
Price
Featured |
Pivot Featured |
|
Max Buy |
NEOG
-
NASDAQ
Neogen Corp
DRUGS - Diagnostic Substances
|
$30.73
|
-0.11
-0.36% |
$31.13
|
660,848
782.07% of 50 DAV
50 DAV is 84,500
|
$31.17
-1.41%
|
9/1/2010
|
$30.79
|
PP = $30.49
|
|
MB = $32.01
|
Most Recent Note - 9/2/2010 4:56:10 PM
Y- Churned a lot of volume today but held its ground after a considerable gain and new all-time high. Technically, its 9/01/10 gain above the new pivot point cited triggered a buy signal after an orderly 5-week base-on-base pattern.
>>> The latest Featured Stock Update with an annotated graph appeared on 8/20/2010. Click here.
View all notes |
Alert me of new notes |
CANSLIM.net Company Profile |
SEC |
Zacks Reports |
StockTalk |
News |
Chart |
Request a new note
C
A N
S L
I M
|
NFLX
-
NASDAQ
Netflix Inc
SPECIALTY RETAIL - Music and Video Stores
|
$138.00
|
+3.09
2.29% |
$138.58
|
5,256,723
119.69% of 50 DAV
50 DAV is 4,391,800
|
$140.90
-2.06%
|
8/10/2010
|
$124.05
|
PP = $124.00
|
|
MB = $130.20
|
Most Recent Note - 9/2/2010 12:49:25 PM
G- Gain today has it within close striking range of its all-time high. It has risen beyond its "max buy" level after holding its ground and finding recent support near its pivot point.
>>> The latest Featured Stock Update with an annotated graph appeared on 8/10/2010. Click here.
View all notes |
Alert me of new notes |
CANSLIM.net Company Profile |
SEC |
Zacks Reports |
StockTalk |
News |
Chart |
Request a new note
C
A N
S L
I M
|
PAY
-
NYSE
Verifone Systems Inc
COMPUTER HARDWARE - Transaction Automation Systems
|
$25.56
|
+0.26
1.03% |
$25.60
|
1,637,952
131.82% of 50 DAV
50 DAV is 1,242,600
|
$25.90
-1.31%
|
8/25/2010
|
$24.30
|
PP = $23.74
|
|
MB = $24.93
|
Most Recent Note - 9/2/2010 12:56:44 PM
G - Disciplined investors may watch for chances to accumulate shares on pullbacks toward prior highs in the $23 area defining chart support. It is slightly extended beyond its "max buy" level.
>>> The latest Featured Stock Update with an annotated graph appeared on 8/30/2010. Click here.
View all notes |
Alert me of new notes |
CANSLIM.net Company Profile |
SEC |
Zacks Reports |
StockTalk |
News |
Chart |
Request a new note
C
A N
S L
I M
|
ROVI
-
NASDAQ
Rovi Corp
COMPUTER SOFTWARE andamp; SERVICES - Security Software andamp; Services
|
$43.35
|
-0.89
-2.01% |
$43.78
|
1,472,834
131.20% of 50 DAV
50 DAV is 1,122,600
|
$44.96
-3.58%
|
8/31/2010
|
$43.31
|
PP = $45.06
|
|
MB = $47.31
|
Most Recent Note - 9/2/2010 1:02:00 PM
Y - Gapped down today, consolidating above support at its 50 DMA line while only -3.6% off its 52-week high. Color code was changed to yellow with new pivot point cited while building a base-on-base type pattern.
>>> The latest Featured Stock Update with an annotated graph appeared on 8/24/2010. Click here.
View all notes |
Alert me of new notes |
CANSLIM.net Company Profile |
SEC |
Zacks Reports |
StockTalk |
News |
Chart |
Request a new note
C
A N
S L
I M
|
SHOO
-
NASDAQ
Steven Madden Limited
CONSUMER NON-DURABLES - Textile - Apparel Footwear
|
$36.27
|
+0.43
1.20% |
$36.55
|
234,321
54.99% of 50 DAV
50 DAV is 426,100
|
$40.98
-11.49%
|
8/5/2010
|
$39.55
|
PP = $41.08
|
|
MB = $43.13
|
Most Recent Note - 9/1/2010 2:07:38 PM
G - Rising above its 50 DMA line on quiet volume amid widespread gains today. Support is defined by its 200 DMA line and prior chart lows in the $30 area.
>>> The latest Featured Stock Update with an annotated graph appeared on 8/5/2010. Click here.
View all notes |
Alert me of new notes |
CANSLIM.net Company Profile |
SEC |
Zacks Reports |
StockTalk |
News |
Chart |
Request a new note
C
A N
S L
I M
|
Symbol/Exchange
Company Name
Industry Group |
PRICE |
CHANGE
(%Change) |
Day High |
Volume
(% DAV)
(% 50 day avg vol) |
52 Wk Hi
% From Hi |
Featured
Date |
Price
Featured |
Pivot Featured |
|
Max Buy |
SLW
-
NYSE
Silver Wheaton Corp
METALS and; MINING - Silver
|
$23.15
|
+0.64
2.84% |
$23.50
|
5,032,755
108.85% of 50 DAV
50 DAV is 4,623,600
|
$23.58
-1.82%
|
8/25/2010
|
$21.40
|
PP = $21.99
|
|
MB = $23.09
|
Most Recent Note - 9/2/2010 1:03:13 PM
G - Gapped up today. The M criteria has improved since the 9/01/10 follow-through day confirmed a new rally. Color code was changed to green after getting extended from its prior base. Previous highs in the $21 area are now a support level to watch.
>>> The latest Featured Stock Update with an annotated graph appeared on 8/25/2010. Click here.
View all notes |
Alert me of new notes |
CANSLIM.net Company Profile |
SEC |
Zacks Reports |
StockTalk |
News |
Chart |
Request a new note
C
A N
S L
I M
|
VIT
-
NYSE
Vanceinfo Tech Inc Ads
COMPUTER SOFTWARE and SERVICES - Business Software and Services
|
$29.53
|
+0.71
2.46% |
$29.53
|
232,211
41.06% of 50 DAV
50 DAV is 565,500
|
$29.80
-0.91%
|
7/8/2010
|
$25.20
|
PP = $26.58
|
|
MB = $27.91
|
Most Recent Note - 9/2/2010 4:57:10 PM
G - Gain today with light volume for a new high close. Patient investors may watch for secondary buy points. Recent gains lifted it more than +5% above its old chart highs.
>>> The latest Featured Stock Update with an annotated graph appeared on 8/31/2010. Click here.
View all notes |
Alert me of new notes |
CANSLIM.net Company Profile |
SEC |
Zacks Reports |
StockTalk |
News |
Chart |
Request a new note
C
A N
S L
I M
|
WCRX
-
NASDAQ
Warner Chilcott Plc
DRUGS - Drug Manufacturers - Other
|
$29.37
|
+0.47
1.63% |
$29.40
|
920,177
52.79% of 50 DAV
50 DAV is 1,743,100
|
$30.57
-3.93%
|
8/23/2010
|
$29.54
|
PP = $29.34
|
|
MB = $30.81
|
Most Recent Note - 9/1/2010 2:10:08 PM
Y - Volume totals have been cooling while it remains perched near its pivot point. It was featured in yellow in the mid-day report on 8/23/10 rising from a cup shaped base.
>>> The latest Featured Stock Update with an annotated graph appeared on 8/23/2010. Click here.
View all notes |
Alert me of new notes |
CANSLIM.net Company Profile |
SEC |
Zacks Reports |
StockTalk |
News |
Chart |
Request a new note
C
A N
S L
I M
|