You are not logged in.
This means you
CAN ONLY VIEW reports that were published prior to Monday, April 14, 2025.
You
MUST UPGRADE YOUR MEMBERSHIP if you want to see any current reports.
AFTER MARKET UPDATE - WEDNESDAY, SEPTEMBER 2ND, 2009
Previous After Market Report Next After Market Report >>>
|
|
|
|
DOW |
-29.93 |
9,280.67 |
-0.32% |
|
Volume |
1,377,220,860 |
-16% |
|
Volume |
2,053,167,530 |
-28% |
|
NASDAQ |
-1.82 |
1,967.07 |
-0.09% |
|
Advancers |
1,159 |
37% |
|
Advancers |
1,269 |
45% |
|
S&P 500 |
-3.29 |
994.75 |
-0.33% |
|
Decliners |
1,834 |
59% |
|
Decliners |
1,438 |
51% |
|
Russell 2000 |
-2.23 |
555.83 |
-0.40% |
|
52 Wk Highs |
38 |
|
|
52 Wk Highs |
13 |
|
|
S&P 600 |
-1.66 |
294.08 |
-0.56% |
|
52 Wk Lows |
2 |
|
|
52 Wk Lows |
9 |
|
|
 |
Volume Quiets As Indices Fall; Leaders Remain Under Pressure
Adam Sarhan, Contributing Writer,
The major averages ended lower for the second straight day, sinking on Wednesday with lower volume than the prior session. Decliners trumped advancers by about a 3-to-2 ratio on the NYSE and by a narrower 7-to-6 ratio on the Nasdaq exchange. There were only 4 high-ranked companies from the CANSLIM.net Leaders List that made a new 52-week high and appeared on the CANSLIM.net BreakOuts Page, lower than the 5 issues that appeared on the prior session. New 52-week highs still outnumbered new 52-week lows on both exchanges while new lows were in the single digits again.
Investors digested a slew of economic data, starting before Wednesday's opening bell, when ADP released its monthly survey which showed that employers slashed -298,000 jobs in August which was higher than the Street's forecast. The Labor Department released a separate report which said productivity, a measure of employee output per hour, jumped at a 6.6% annual rate during the second quarter. This was the highest jump in worker productivity in the second quarter since 2003.
Elsewhere, the Commerce Department released a report which showed that factory orders rose by +1.3% July. This was the largest increase in a year and suggests that companies are rebuilding inventories after a record decline in the first half of 2009. Just after 2PM EST the Federal Reserve released the minutes for their August meeting. Fed officials discussed the notion of extending the end-day to purchase so-called toxic assets to minimize any impact on the market. They also expressed concern about the pace of the economic recovery.
The market rally and the small group of stocks that are leading right now remain under pressure. Investors flocked into gold and silver as volume surged across the board in many related names. Unfortunately, the vast majority of gold and silver stocks sport very poor fundamentals and the overall group action has been lackluster at best. The strongest acting group was the Metal Ores-Gold/Silver group, a group currently ranked 194th, near the bottom of the 197 Industry Groups covered in the newspaper. This is another great example of low-ranked stocks bouncing from egregiously oversold levels.
PICTURED: The Dow Jones Industrial Average ended lower on lighter volume than the prior session, yet the volume total behind the 4th consecutive loss was above average again.
|
|
|
 |
Gold & Silver Index Blasting Toward June Highs
Kenneth J. Gruneisen - Passed the CAN SLIM® Master's Exam
Widespread weakness dragged the influential Bank Index ($BKX -2.27%) lower while the Broker/Dealer Index ($XBD -0.16%) held up better. The Biotechnology Index ($BTK -1.37%) and Networking Index ($NWX -1.23%) led the tech sector lower, me awhile the Semiconductor Index ($SOX -0.42%) ended with a smaller loss and the Internet Index ($IIX +0.14%) finished the session with a tiny gain. The Retail Index ($RLX -0.32%) also edged lower. While the Oil Services Index ($OSX -1.08%) lost ground the Integrated Oil Index ($XOI +0.25%) ended slightly higher. The Healthcare Index ($HMO +3.58%) posted a solid gain, yet it was outpaced by another defensive area (mentioned below).
Charts courtesy www.stockcharts.com
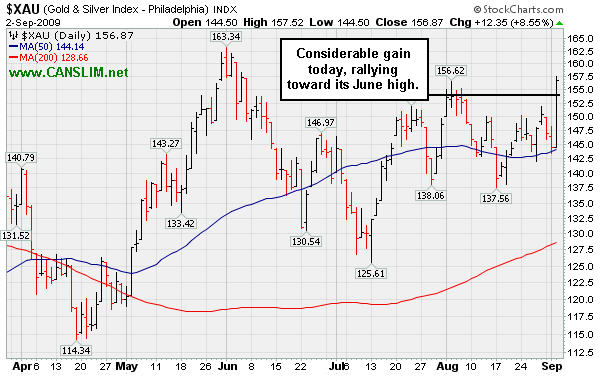
PICTURED: The Gold & Silver Index ($XAU +8.55%) posted a considerable gain today, rallying toward its June high.
| Oil Services |
$OSX |
168.98 |
-1.84 |
-1.08% |
+39.20% |
| Healthcare |
$HMO |
1,205.88 |
+41.66 |
+3.58% |
+25.59% |
| Integrated Oil |
$XOI |
962.84 |
+2.42 |
+0.25% |
-1.72% |
| Semiconductor |
$SOX |
297.40 |
-1.24 |
-0.42% |
+40.17% |
| Networking |
$NWX |
203.30 |
-2.53 |
-1.23% |
+41.29% |
| Internet |
$IIX |
198.37 |
+0.27 |
+0.14% |
+48.29% |
| Broker/Dealer |
$XBD |
108.39 |
-0.17 |
-0.16% |
+39.91% |
| Retail |
$RLX |
356.77 |
-1.16 |
-0.32% |
+27.76% |
| Gold & Silver |
$XAU |
156.87 |
+12.35 |
+8.55% |
+26.66% |
| Bank |
$BKX |
43.52 |
-1.01 |
-2.27% |
-1.81% |
| Biotech |
$BTK |
889.38 |
-12.39 |
-1.37% |
+37.43% |
|
|
|
 |
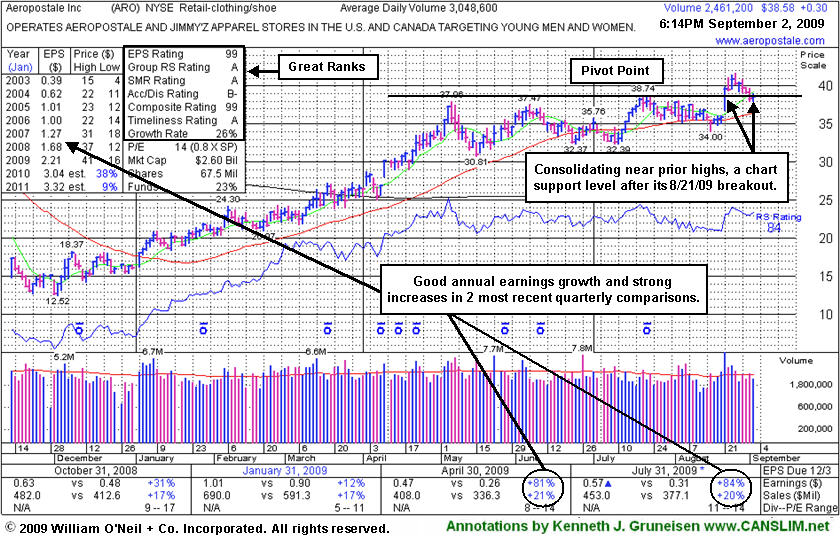
Consolidation Near Prior Highs While Market Sputters
Kenneth J. Gruneisen - Passed the CAN SLIM® Master's Exam
Aeropostale Inc (ARO +$0.30 or +0.78% to $38.58) is a high-ranked leader in the Retail - Clothing/shoe group now consolidating near its pivot point and support at prior highs in the $38 area. It has endured some distributional pressure without closing under its old high close ($38.22 on 7/22/09), but deterioration leading to a close back in its prior base would raise concerns. Keep in mind, 3 out of 4 stocks tend to follow along with the direction of the major averages. Weaker market conditions (the M criteria) have hindered its progress since its gap up gain for a new all-time high on 8/21/09 triggered a technical buy signal as it rose from a flat base pattern with almost 3 times average volume.
ARO was featured in yellow with new pivot point and max buy levels noted in the 8/21/09 Mid-Day BreakOuts Report (read here). It has a great annual earnings history (the A criteria), and the 2 latest quarterly comparisons showed +81% and +84% earnings increases, well above the investment system's +25% guideline. The number of top-rated funds owning an interest in its shares rose from 209 in Dec '08 to 239 in Jun '09, which is good news concerning the I criteria.
Disciplined investors avoid chasing stocks more than 5% above their pivot point, as doing so increases the chances that a normal pullback will prompt them to sell the stock -as investors should always limit losses by selling any stock that falls 7% from their buy price. Healthy stocks in healthy market environments do not typically retreat under their pivot points by very much, so subsequent losses would raise concerns, particularly if volume swells behind and damaging declines.
|
|
|
Color Codes Explained :
Y - Better candidates highlighted by our
staff of experts.
G - Previously featured
in past reports as yellow but may no longer be buyable under the
guidelines.
***Last / Change / Volume quote data in this table corresponds with the timestamp on the note***
Symbol/Exchange
Company Name
Industry Group |
Last |
Chg. |
Vol
% DAV |
Date Featured |
Price Featured |
Latest Pivot Point
Featured |
Status |
| Latest Max Buy Price |
ARO
- NYSE
Aeropostale Inc
RETAIL - Apparel Stores
|
$38.58
|
+0.30
|
2,461,367
81% DAV
3,048,600
|
8/21/2009
(Date
Featured) |
$39.21
(Price
Featured) |
PP = $38.84 |
Y |
| MB = $40.78 |
Most Recent Note - 9/2/2009 5:18:07 PM
Y - High-ranked leader in the Retail - Clothing/shoe group is consolidating near its pivot point and support at prior highs in the $38 area. A gap up gain for a new all-time high on 8/21/09 helped trigger a technical buy signal as it rose from a flat base pattern with almost 3 times average volume. It was featured in yellow with new pivot point and max buy levels noted in the 8/21/09 Mid-Day BreakOuts Report (read here). It has a good annual earnings history (the A criteria), and the 2 latest quarterly comparisons showed +81% and +84% earnings increases, well above the investment system's +25% guideline.
>>> The latest Featured Stock Update with an annotated graph appeared on 9/2/2009. click here.
|
|
C
A
S
I |
News |
Chart |
SEC
View all notes Alert
me of new notes
Company
Profile
|
ARST
-
|
$19.61
|
-0.36
|
657,504
88% DAV
748,600
|
9/1/2009
(Date
Featured) |
$19.91
(Price
Featured) |
PP = $20.90 |
Y |
| MB = $21.95 |
Most Recent Note - 9/2/2009 5:20:03 PM
Y - Ended near the low end of its intra-day range today with a loss on lighter volume. Closed the prior session near the middle of its intra-day range with a gain backed by nearly twice average volume. Featured in yellow in the 9/01/09 mid-day report with an annotated daily graph (read here) and it was also featured with more detailed analysis in the September 2009 CANSLIM.net News with an annotated weekly graph (read here).
>>> The latest Featured Stock Update with an annotated graph appeared on 8/31/2009. click here.
|
|
C
A
S
I |
News |
Chart |
SEC
View all notes Alert
me of new notes
Company
Profile
|
CPLA
- NASDAQ
Capella Education Co
DIVERSIFIED SERVICES - Education and Training Services
|
$62.13
|
-0.30
|
107,705
58% DAV
186,000
|
7/9/2009
(Date
Featured) |
$59.69
(Price
Featured) |
PP = $62.06 |
Y |
| MB = $65.16 |
Most Recent Note - 9/2/2009 5:21:02 PM
Y - Consolidating near its 50 DMA line, trading in a tight range on light volume near its pivot point, within close striking range of its 52-week high. The Commercial Services-Schools Group has shown some isolated leadership which is somewhat reassuring for the L criteria, but the groups still has low ranks and CPLA's Relative Strength rank has slumped to 54, under the 80+ guideline. Its small supply of only 13.9 million shares in the float could contribute to greater price volatility in the event of institutional accumulation or distribution. The number of top-rated funds owning an interest rose from 91 in Sept '08, to 139 as of June '09, which is reassuring with respect to the I criteria. It has a very good earnings history that satisfies the C & A criteria.
>>> The latest Featured Stock Update with an annotated graph appeared on 8/19/2009. click here.
|
|
C
A
S
I |
News |
Chart |
SEC
View all notes Alert
me of new notes
Company
Profile
|
CRM
- NYSE
Salesforce.com Inc
INTERNET - Internet Software & Services
|
$51.56
|
+0.42
|
1,368,099
71% DAV
1,940,100
|
8/16/2009
(Date
Featured) |
$47.12
(Price
Featured) |
PP = $45.59 |
Y |
| MB = $47.87 |
Most Recent Note - 9/2/2009 5:22:15 PM
Y - Small gain on light volume today continues its tight consolidation since its "breakaway gap" for a considerable gain on 8/21/09 with more than 5 times average volume. A Stock Bulletin was published with detailed analysis and an annotated graph on 8/16/09 (read here).
>>> The latest Featured Stock Update with an annotated graph appeared on 8/31/2009. click here.
|
|
C
A
S
I |
News |
Chart |
SEC
View all notes Alert
me of new notes
Company
Profile
|
EBIX
- NASDAQ
Ebix Inc
COMPUTER SOFTWARE & SERVICES - Business Software & Services
|
$51.75
|
+1.63
|
154,821
167% DAV
92,900
|
8/28/2009
(Date
Featured) |
$45.86
(Price
Featured) |
PP = $45.35 |
G |
| MB = $47.62 |
Most Recent Note - 9/2/2009 4:05:18 PM
G - Today was its 9th consecutive gain and 4th consecutive gain with above average volume. Extended from its latest base now, its prior chart highs near $46 are an important support level to watch. Triggered a technical buy signal as it blasted to a new all-time high on 8/28/09, rising from a big cup-with-high-handle shaped pattern. It has rebounded impressively and was re-featured in yellow at $45.86 with new pivot point and max buy levels noted in the 8/28/09 Mid-Day BreakOuts Report (read here). Sales and earnings increases in quarterly comparisons have been strong, but they have shown steady sequential deceleration. This high-ranked leader had traded up more than +59% after it was first featured in the March 2008 CANSLIM.net News (read here), but weak action later in the year subsequently prompted it to be dropped from the Featured Stocks list. Do not be confused by the 3:1 split that took effect on 10/09/08.
>>> The latest Featured Stock Update with an annotated graph appeared on 8/28/2009. click here.
|
|
C
A
S
I |
News |
Chart |
SEC
View all notes Alert
me of new notes
Company
Profile
|
GMCR
- NASDAQ
Green Mtn Coffee Roastrs
FOOD & BEVERAGE - Processed & Packaged Goods
|
$58.60
|
+0.76
|
681,903
42% DAV
1,631,800
|
7/17/2009
(Date
Featured) |
$60.15
(Price
Featured) |
PP = $63.79 |
G |
| MB = $66.98 |
Most Recent Note - 9/2/2009 4:09:32 PM
G - Continued consolidation under its 50 DMA line which is now downward sloping and a source of technical resistance. A violation of its prior chart low ($54.32 on 8/18/09) would technically complete a bearish "head-and-shoulders" pattern and trigger additional and more worrisome sell signals. GMCR traded up more than +168% since appearing with an annotated graph under the headline "It May Soon Be Time To Go Green" when featured in the January 2009 CANSLIM.net News (read here).
>>> The latest Featured Stock Update with an annotated graph appeared on 8/26/2009. click here.
|
|
C
A
S
I |
News |
Chart |
SEC
View all notes Alert
me of new notes
Company
Profile
|
NTES
- NASDAQ
Netease Inc Adr
INTERNET - Internet Information Providers
|
$41.42
|
+0.02
|
872,877
39% DAV
2,223,900
|
7/17/2009
(Date
Featured) |
$39.29
(Price
Featured) |
PP = $38.74 |
G |
| MB = $40.68 |
Most Recent Note - 9/2/2009 4:38:04 PM
G - Small gain on light volume today, still quietly consolidating in a tight range above support at its 50 DMA line and above prior chart highs in the $38 area. Deterioration below those levels would raise more serious concerns and triggger additional sell signals.
>>> The latest Featured Stock Update with an annotated graph appeared on 8/27/2009. click here.
|
|
C
A
S
I |
News |
Chart |
SEC
View all notes Alert
me of new notes
Company
Profile
|
NVEC
- NASDAQ
N V E Corp
ELECTRONICS - Semiconductor - Specialized
|
$51.78
|
+0.99
|
51,852
58% DAV
89,900
|
8/26/2009
(Date
Featured) |
$55.32
(Price
Featured) |
PP = $57.60 |
G |
| MB = $60.48 |
Most Recent Note - 9/2/2009 5:14:40 PM
G - Halted its slide today near important support at its 50 DMA line and prior chart highs with a gain on lighter volume after 5 consecutive declines. Color code was changed to green based on its weak action and failure to produce gains above its latest pivot point. Quarterly sales revenues in the 6 million dollar range are still rather minuscule, leaving concerns.
>>> The latest Featured Stock Update with an annotated graph appeared on 9/1/2009. click here.
|
|
C
A
S
I |
News |
Chart |
SEC
View all notes Alert
me of new notes
Company
Profile
|
PEGA
- NASDAQ
Pegasystems Inc
COMPUTER SOFTWARE & SERVICES - Business Software & Services
|
$29.42
|
-0.25
|
413,715
112% DAV
368,200
|
7/29/2009
(Date
Featured) |
$27.53
(Price
Featured) |
PP = $27.49 |
G |
| MB = $28.86 |
Most Recent Note - 9/2/2009 5:15:54 PM
G - Down again today, falling for a 6th consecutive session on near average volume after an impressive 6 session winning streak. Recently found support at its 50 DMA line.
>>> The latest Featured Stock Update with an annotated graph appeared on 8/24/2009. click here.
|
|
C
A
S
I |
News |
Chart |
SEC
View all notes Alert
me of new notes
Company
Profile
|
|
|
|
THESE ARE NOT BUY RECOMMENDATIONS!
Comments contained in the body of this report are technical
opinions only. The material herein has been obtained
from sources believed to be reliable and accurate, however,
its accuracy and completeness cannot be guaranteed.
This site is not an investment advisor, hence it does
not endorse or recommend any securities or other investments.
Any recommendation contained in this report may not
be suitable for all investors and it is not to be deemed
an offer or solicitation on our part with respect to
the purchase or sale of any securities. All trademarks,
service marks and trade names appearing in this report
are the property of their respective owners, and are
likewise used for identification purposes only.
This report is a service available
only to active Paid Premium Members.
You may opt-out of receiving report notifications
at any time. Questions or comments may be submitted
by writing to Premium Membership Services 665 S.E. 10 Street, Suite 201 Deerfield Beach, FL 33441-5634 or by calling 1-800-965-8307
or 954-785-1121.
|
|
|


