Symbol/Exchange
Company Name
Industry Group |
PRICE |
CHANGE
(%Change) |
Day High |
Volume
(% DAV)
(% 50 day avg vol) |
52 Wk Hi
% From Hi |
Featured
Date |
Price
Featured |
Pivot Featured |
|
Max Buy |
ABV
-
NYSE
Comp De Bebidas Adr
FOOD and BEVERAGE - Beverages - Brewers
|
$112.89
|
+2.20
1.99% |
$114.23
|
700,695
106.31% of 50 DAV
50 DAV is 659,100
|
$112.60
0.26%
|
6/29/2010
|
$104.74
|
PP = $109.33
|
|
MB = $114.80
|
Most Recent Note - 8/31/2010 3:54:13 PM
G - This Brazil-based beverage firm is poised for a new high close with today's gain. Found support near its 50 DMA line recently.
>>> The latest Featured Stock Update with an annotated graph appeared on 8/18/2010. Click here.
View all notes |
Alert me of new notes |
CANSLIM.net Company Profile |
SEC |
Zacks Reports |
StockTalk |
News |
Chart |
Request a new note
C
A N
S L
I M


|
ARUN
-
NASDAQ
Aruba Networks Inc
COMPUTER HARDWARE - Networking andamp; Communication Dev
|
$18.88
|
+0.52
2.83% |
$19.32
|
2,692,609
157.36% of 50 DAV
50 DAV is 1,711,100
|
$19.01
-0.68%
|
8/30/2010
|
$18.12
|
PP = $18.51
|
|
MB = $19.44
|
 Most Recent Note - 9/1/2010 12:38:50 PM
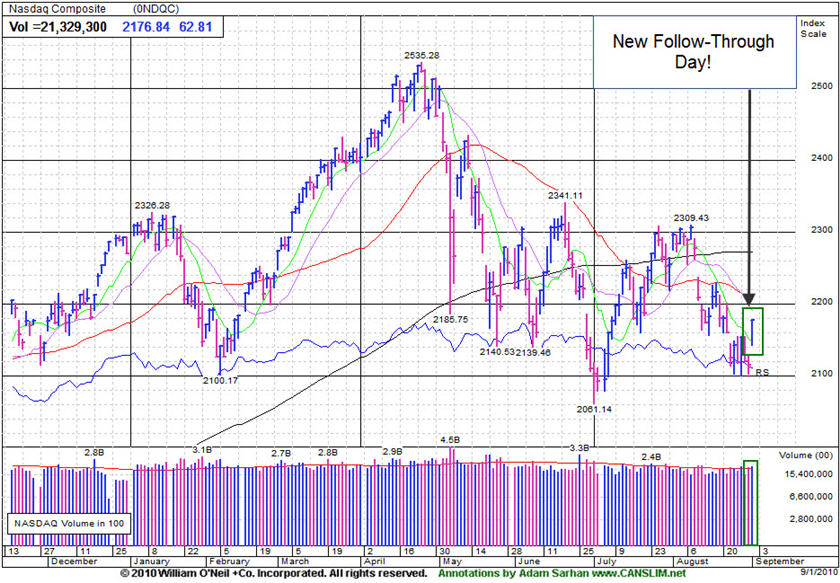
Y - Hitting another new 52-week high today, trading above its pivot point. Its prior session close was below the pivot point cited. Technically, its 8/27/10 gain with heavy volume helped it rally up the right side of a 5-week base during which its 50 DMA line acted as a support level. Confirming gains and a follow-through day for the major averages (M criteria) would be reassuring signs. It rebounded impressively since dropped from the Featured Stocks list on 5/06/10 as it and the broader market endured heavy distributional pressure.

>>> The latest Featured Stock Update with an annotated graph appeared on 4/29/2010. Click here.
View all notes |
Alert me of new notes |
CANSLIM.net Company Profile |
SEC |
Zacks Reports |
StockTalk |
News |
Chart |
Request a new note
C
A N
S L
I M
|
BIDU
-
NASDAQ
Baidu Inc Ads
INTERNET - Internet Information Providers
|
$81.84
|
+3.41
4.35% |
$82.55
|
8,926,204
81.97% of 50 DAV
50 DAV is 10,889,800
|
$88.32
-7.34%
|
7/14/2010
|
$75.03
|
PP = $78.59
|
|
MB = $82.52
|
Most Recent Note - 9/1/2010 2:01:57 PM
Y - Gapped up today, rallying from its 50 DMA line again amid widespread leadership and solid gains from the major averages (better M criteria). Color code is changed to yellow as gains helping it rally from its 10-week average may be considered a secondary buy point. It may be considered "late-stage" and riskier than fresh breakouts.
>>> The latest Featured Stock Update with an annotated graph appeared on 8/13/2010. Click here.
View all notes |
Alert me of new notes |
CANSLIM.net Company Profile |
SEC |
Zacks Reports |
StockTalk |
News |
Chart |
Request a new note
C
A N
S L
I M
|
CACC
-
NASDAQ
Credit Acceptance Corp
FINANCIAL SERVICES - Credit Services
|
$59.48
|
+2.83
5.00% |
$59.51
|
26,920
50.32% of 50 DAV
50 DAV is 53,500
|
$61.41
-3.14%
|
7/29/2010
|
$52.04
|
PP = $54.07
|
|
MB = $56.77
|
Most Recent Note - 9/1/2010 3:36:35 PM
G - Gain today on light volume. Consolidating well above its 50 DMA and old highs near $54 that define support.
>>> The latest Featured Stock Update with an annotated graph appeared on 8/2/2010. Click here.
View all notes |
Alert me of new notes |
CANSLIM.net Company Profile |
SEC |
Zacks Reports |
StockTalk |
News |
Chart |
Request a new note
C
A N
S L
I M
|
CMG
-
NYSE
Chipotle Mexican Grill
LEISURE - Restaurants
|
$159.41
|
+8.58
5.69% |
$159.54
|
1,572,104
228.64% of 50 DAV
50 DAV is 687,600
|
$155.42
2.57%
|
9/1/2010
|
$158.31
|
PP = $155.52
|
|
MB = $163.30
|
Most Recent Note - 9/1/2010 12:44:55 PM
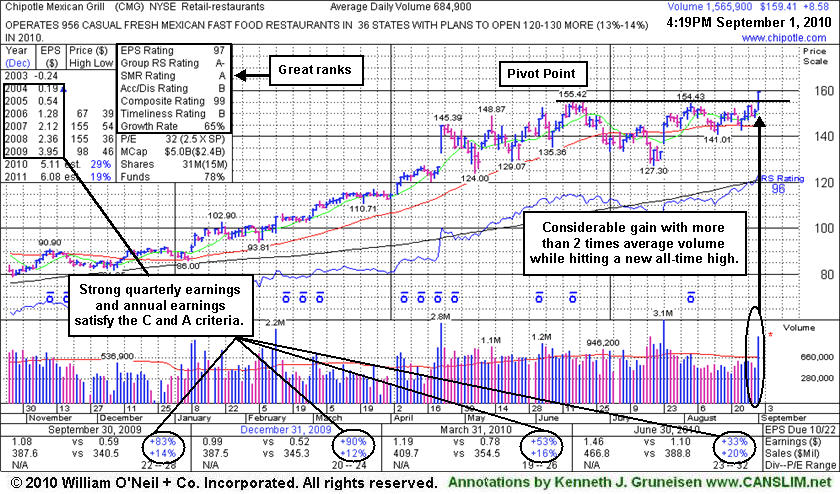
Y - Rallying to multi-year highs today with a considerable gain backed by above average volume and color code is changed to yellow with pivot point based on its 52-week high plus 10 cents. Sales revenues increases have shown acceleration while up +12%, +16%, +20% in recent quarterly comparisons while the C criteria is satisfied by earnings increases above the +25% guideline and it has a good annual (A criteria) earnings history. Noted in prior mid-day reports -"rebounded considerably after a very deep correction, falling from $123 when it was dropped from the Featured Stocks list 1/7/08, to as low as $36 in November '08."
>>> The latest Featured Stock Update with an annotated graph appeared on 9/1/2010. Click here.
View all notes |
Alert me of new notes |
CANSLIM.net Company Profile |
SEC |
Zacks Reports |
StockTalk |
News |
Chart |
Request a new note
C
A N
S L
I M
|
Symbol/Exchange
Company Name
Industry Group |
PRICE |
CHANGE
(%Change) |
Day High |
Volume
(% DAV)
(% 50 day avg vol) |
52 Wk Hi
% From Hi |
Featured
Date |
Price
Featured |
Pivot Featured |
|
Max Buy |
CRM
-
NYSE
Salesforce.Com Inc
INTERNET - Internet Software and Services
|
$116.40
|
+6.52
5.93% |
$116.81
|
5,211,911
203.47% of 50 DAV
50 DAV is 2,561,500
|
$114.15
1.97%
|
6/2/2010
|
$88.44
|
PP = $89.60
|
|
MB = $94.08
|
Most Recent Note - 9/1/2010 12:47:20 PM
G - Gapped up today and rallied for a new all-time high. It is extended from a sound base, not currently buyable under the investment system guidelines.
>>> The latest Featured Stock Update with an annotated graph appeared on 8/16/2010. Click here.
View all notes |
Alert me of new notes |
CANSLIM.net Company Profile |
SEC |
Zacks Reports |
StockTalk |
News |
Chart |
Request a new note
C
A N
S L
I M
|
EGO
-
NYSE
Eldorado Gold Corp
METALS and MINING - Gold
|
$19.26
|
-0.30
-1.53% |
$19.85
|
5,719,314
140.23% of 50 DAV
50 DAV is 4,078,400
|
$20.06
-3.99%
|
8/19/2010
|
$18.25
|
PP = $19.17
|
|
MB = $20.13
|
Most Recent Note - 9/1/2010 12:54:31 PM
Y - Pulling back today near its pivot point following a recent streak of volume-driven gains to new 52-week highs amid strong leadership (L criteria) in the group. The Canada-based mining firm triggered a technical buy signal last week. Gains today for the major averages (M criteria) have the look of a solid follow-through day confirming a new rally.
>>> The latest Featured Stock Update with an annotated graph appeared on 8/19/2010. Click here.
View all notes |
Alert me of new notes |
CANSLIM.net Company Profile |
SEC |
Zacks Reports |
StockTalk |
News |
Chart |
Request a new note
C
A N
S L
I M
|
FFIV
-
NASDAQ
F 5 Networks Inc
INTERNET - Internet Software and Services
|
$90.74
|
+3.31
3.79% |
$91.17
|
1,174,675
70.24% of 50 DAV
50 DAV is 1,672,400
|
$92.70
-2.11%
|
6/16/2010
|
$74.50
|
PP = $74.10
|
|
MB = $77.81
|
Most Recent Note - 9/1/2010 2:05:11 PM
G - Consolidating in a tight range in the past 3 weeks following a bout of heavy distribution. Its 50 DMA line and recent lows near $80 define support.
>>> The latest Featured Stock Update with an annotated graph appeared on 8/4/2010. Click here.
View all notes |
Alert me of new notes |
CANSLIM.net Company Profile |
SEC |
Zacks Reports |
StockTalk |
News |
Chart |
Request a new note
C
A N
S L
I M
|
FOSL
-
NASDAQ
Fossil Inc
CONSUMER DURABLES - Recreational Goods, Other
|
$48.80
|
+1.31
2.76% |
$48.97
|
883,731
99.27% of 50 DAV
50 DAV is 890,200
|
$49.50
-1.41%
|
8/10/2010
|
$45.54
|
PP = $42.69
|
|
MB = $44.82
|
Most Recent Note - 8/31/2010 12:28:02 PM
G - Trading up today for an 8th consecutive gain, getting extended from any sound base.
>>> The latest Featured Stock Update with an annotated graph appeared on 8/11/2010. Click here.
View all notes |
Alert me of new notes |
CANSLIM.net Company Profile |
SEC |
Zacks Reports |
StockTalk |
News |
Chart |
Request a new note
C
A N
S L
I M
|
GMCR
-
NASDAQ
Green Mtn Coffee Roastrs
FOOD and BEVERAGE - Processed and Packaged Goods
|
$30.84
|
+0.02
0.06% |
$31.37
|
1,623,640
71.91% of 50 DAV
50 DAV is 2,257,900
|
$33.98
-9.24%
|
8/17/2010
|
$33.62
|
PP = $33.30
|
|
MB = $34.97
|
Most Recent Note - 8/31/2010 5:40:14 PM
G - Solid gain today with above average volume, rallying up from its 50 DMA line. Possible handle may be forming after the previously noted cup shaped pattern.
>>> The latest Featured Stock Update with an annotated graph appeared on 8/17/2010. Click here.
View all notes |
Alert me of new notes |
CANSLIM.net Company Profile |
SEC |
Zacks Reports |
StockTalk |
News |
Chart |
Request a new note
C
A N
S L
I M
|
Symbol/Exchange
Company Name
Industry Group |
PRICE |
CHANGE
(%Change) |
Day High |
Volume
(% DAV)
(% 50 day avg vol) |
52 Wk Hi
% From Hi |
Featured
Date |
Price
Featured |
Pivot Featured |
|
Max Buy |
HS
-
NYSE
Healthspring Inc
HEALTH SERVICES - Health Care Plans
|
$21.58
|
+0.82
3.95% |
$21.82
|
1,003,941
174.51% of 50 DAV
50 DAV is 575,300
|
$20.99
2.81%
|
8/27/2010
|
$19.91
|
PP = $19.75
|
|
MB = $20.74
|
Most Recent Note - 9/1/2010 1:02:04 PM
G - Gapped up today and hit another new 52-week high, and its color code is changed to green after rallying beyond its "max buy" level. Gapped up on 8/27/10 after announcing news that it will acquire Bravo Health for $545 million, rallying from a short flat base as it was featured in the mid-day report.
>>> The latest Featured Stock Update with an annotated graph appeared on 8/27/2010. Click here.
View all notes |
Alert me of new notes |
CANSLIM.net Company Profile |
SEC |
Zacks Reports |
StockTalk |
News |
Chart |
Request a new note
C
A N
S L
I M
|
MELI
-
NASDAQ
Mercadolibre Inc
INTERNET - Internet Software and; Services
|
$68.40
|
+2.46
3.73% |
$69.09
|
600,151
58.57% of 50 DAV
50 DAV is 1,024,600
|
$70.95
-3.59%
|
5/13/2010
|
$54.21
|
PP = $55.85
|
|
MB = $58.64
|
Most Recent Note - 8/30/2010 3:39:14 PM
G - Consolidating quietly well above prior highs in the $62 area and its 50 DMA line defining chart support. Recently noted - "The pullback may be offering investors a secondary buy point, however weakened market conditions (M criteria) are a concern now arguing against new buying effort until a new follow-through day occurs."
>>> The latest Featured Stock Update with an annotated graph appeared on 8/26/2010. Click here.
View all notes |
Alert me of new notes |
CANSLIM.net Company Profile |
SEC |
Zacks Reports |
StockTalk |
News |
Chart |
Request a new note
C
A N
S L
I M
|
MRX
-
NYSE
Medicis Pharmaceut Cl A
DRUGS - Biotechnology
|
$28.61
|
+1.11
4.04% |
$28.65
|
1,930,823
166.54% of 50 DAV
50 DAV is 1,159,400
|
$28.15
1.63%
|
8/12/2010
|
$26.88
|
PP = $26.71
|
|
MB = $28.05
|
Most Recent Note - 9/1/2010 1:10:45 PM
Y - Gapped up today and hit a new 52-week high amid widespread strength which has the current session looking like a follow-through day (good for the M criteria). The high-ranked Medical - Ethical Drugs firm found support recently while consolidating near prior chart highs.
>>> The latest Featured Stock Update with an annotated graph appeared on 8/12/2010. Click here.
View all notes |
Alert me of new notes |
CANSLIM.net Company Profile |
SEC |
Zacks Reports |
StockTalk |
News |
Chart |
Request a new note
C
A N
S L
I M
|
MWIV
-
NASDAQ
M W I Veterinary Supply
HEALTH SERVICES - Medical Instruments and; Supplies
|
$54.50
|
+1.49
2.81% |
$54.50
|
77,034
99.78% of 50 DAV
50 DAV is 77,200
|
$55.46
-1.73%
|
7/29/2010
|
$52.05
|
PP = $52.09
|
|
MB = $54.69
|
Most Recent Note - 8/30/2010 5:35:40 PM
Y - Negatively reversed today after a small gap up, closing at the session low. Recent lows in the $46 area define an important chart support level.
>>> The latest Featured Stock Update with an annotated graph appeared on 7/30/2010. Click here.
View all notes |
Alert me of new notes |
CANSLIM.net Company Profile |
SEC |
Zacks Reports |
StockTalk |
News |
Chart |
Request a new note
C
A N
S L
I M
|
NEM
-
NYSE
Newmont Mining Corp
METALS and MINING - Gold
|
$60.32
|
-1.00
-1.63% |
$61.92
|
8,171,969
111.49% of 50 DAV
50 DAV is 7,330,000
|
$63.38
-4.83%
|
8/31/2010
|
$61.32
|
PP = $63.48
|
|
MB = $66.65
|
Most Recent Note - 8/31/2010 6:24:56 PM
Y - Closed 61 cents off its 7/09/10 high close today with a gap up gain on average volume helping it rise further above its 50 DMA line. Color code is changed to yellow with new pivot point cited based on its 52-week high plus ten cents. Disciplined investors will watch for a confirming gain above its pivot with heavy volume and a follow-through day from one of the major averages. Leadership in the Mining - Gold/Silver/Gems group (L criteria) is a nice reassurance.
>>> The latest Featured Stock Update with an annotated graph appeared on 8/6/2010. Click here.
View all notes |
Alert me of new notes |
CANSLIM.net Company Profile |
SEC |
Zacks Reports |
StockTalk |
News |
Chart |
Request a new note
C
A N
S L
I M
|
Symbol/Exchange
Company Name
Industry Group |
PRICE |
CHANGE
(%Change) |
Day High |
Volume
(% DAV)
(% 50 day avg vol) |
52 Wk Hi
% From Hi |
Featured
Date |
Price
Featured |
Pivot Featured |
|
Max Buy |
NEOG
-
NASDAQ
Neogen Corp
DRUGS - Diagnostic Substances
|
$30.84
|
+1.62
5.54% |
$31.17
|
208,079
251.00% of 50 DAV
50 DAV is 82,900
|
$30.39
1.48%
|
9/1/2010
|
$30.79
|
PP = $30.49
|
|
MB = $32.01
|
Most Recent Note - 9/1/2010 1:54:52 PM
Y- Gapped up today for a considerable gain and new all-time high. A new pivot point and "max buy" level are cited after its orderly 5-week base-on-base pattern.
>>> The latest Featured Stock Update with an annotated graph appeared on 8/20/2010. Click here.
View all notes |
Alert me of new notes |
CANSLIM.net Company Profile |
SEC |
Zacks Reports |
StockTalk |
News |
Chart |
Request a new note
C
A N
S L
I M
|
NFLX
-
NASDAQ
Netflix Inc
SPECIALTY RETAIL - Music and Video Stores
|
$134.92
|
+9.40
7.48% |
$136.25
|
8,302,680
188.82% of 50 DAV
50 DAV is 4,397,200
|
$140.90
-4.25%
|
8/10/2010
|
$124.05
|
PP = $124.00
|
|
MB = $130.20
|
Most Recent Note - 9/1/2010 1:49:24 PM
G- Gapped up today and its color code is changed to green as it has risen beyond its "max buy" level after holding its ground and finding recent support near its pivot point.
>>> The latest Featured Stock Update with an annotated graph appeared on 8/10/2010. Click here.
View all notes |
Alert me of new notes |
CANSLIM.net Company Profile |
SEC |
Zacks Reports |
StockTalk |
News |
Chart |
Request a new note
C
A N
S L
I M
|
PAY
-
NYSE
Verifone Systems Inc
COMPUTER HARDWARE - Transaction Automation Systems
|
$25.30
|
+1.12
4.63% |
$25.90
|
2,989,810
243.39% of 50 DAV
50 DAV is 1,228,400
|
$25.12
0.72%
|
8/25/2010
|
$24.30
|
PP = $23.74
|
|
MB = $24.93
|
Most Recent Note - 9/1/2010 1:15:12 PM
G - Hit a new 52-week high today and its color code is changed to green after rising beyond its "max buy" level. Blasted higher on 8/25/10 following better than expected results, noted in the mid-day report while then rising from a cup-with-handle base.
>>> The latest Featured Stock Update with an annotated graph appeared on 8/30/2010. Click here.
View all notes |
Alert me of new notes |
CANSLIM.net Company Profile |
SEC |
Zacks Reports |
StockTalk |
News |
Chart |
Request a new note
C
A N
S L
I M
|
ROVI
-
NASDAQ
Rovi Corp
COMPUTER SOFTWARE andamp; SERVICES - Security Software andamp; Services
|
$44.24
|
+0.73
1.68% |
$44.40
|
1,303,731
116.98% of 50 DAV
50 DAV is 1,114,500
|
$44.96
-1.60%
|
8/31/2010
|
$43.31
|
PP = $45.06
|
|
MB = $47.31
|
Most Recent Note - 8/31/2010 3:43:19 PM
Y - Rallying up from support at its 50 DMA line. Color code is changed to yellow with new pivot point cited while building a base-on-base type pattern.
>>> The latest Featured Stock Update with an annotated graph appeared on 8/24/2010. Click here.
View all notes |
Alert me of new notes |
CANSLIM.net Company Profile |
SEC |
Zacks Reports |
StockTalk |
News |
Chart |
Request a new note
C
A N
S L
I M
|
SHOO
-
NASDAQ
Steven Madden Limited
CONSUMER NON-DURABLES - Textile - Apparel Footwear
|
$35.84
|
+1.45
4.20% |
$35.97
|
315,670
73.45% of 50 DAV
50 DAV is 429,800
|
$40.98
-12.54%
|
8/5/2010
|
$39.55
|
PP = $41.08
|
|
MB = $43.13
|
Most Recent Note - 9/1/2010 2:07:38 PM
G - Rising above its 50 DMA line on quiet volume amid widespread gains today. Support is defined by its 200 DMA line and prior chart lows in the $30 area.
>>> The latest Featured Stock Update with an annotated graph appeared on 8/5/2010. Click here.
View all notes |
Alert me of new notes |
CANSLIM.net Company Profile |
SEC |
Zacks Reports |
StockTalk |
News |
Chart |
Request a new note
C
A N
S L
I M
|
Symbol/Exchange
Company Name
Industry Group |
PRICE |
CHANGE
(%Change) |
Day High |
Volume
(% DAV)
(% 50 day avg vol) |
52 Wk Hi
% From Hi |
Featured
Date |
Price
Featured |
Pivot Featured |
|
Max Buy |
SLW
-
NYSE
Silver Wheaton Corp
METALS and; MINING - Silver
|
$22.51
|
-0.05
-0.22% |
$22.97
|
5,038,329
109.94% of 50 DAV
50 DAV is 4,582,800
|
$23.58
-4.54%
|
8/25/2010
|
$21.40
|
PP = $21.99
|
|
MB = $23.09
|
Most Recent Note - 8/31/2010 12:38:47 PM
Y - Hit another new all-time high today amid strength in the group, trading near its "max buy" level. The M criteria remains a concern until a follow-through day confirms a new rally.
>>> The latest Featured Stock Update with an annotated graph appeared on 8/25/2010. Click here.
View all notes |
Alert me of new notes |
CANSLIM.net Company Profile |
SEC |
Zacks Reports |
StockTalk |
News |
Chart |
Request a new note
C
A N
S L
I M
|
VIT
-
NYSE
Vanceinfo Tech Inc Ads
COMPUTER SOFTWARE and SERVICES - Business Software and Services
|
$28.82
|
-0.33
-1.13% |
$29.80
|
702,115
124.33% of 50 DAV
50 DAV is 564,700
|
$29.74
-3.09%
|
7/8/2010
|
$25.20
|
PP = $26.58
|
|
MB = $27.91
|
Most Recent Note - 9/1/2010 1:30:42 PM
G - Pulling back today from its all-time high. Patient investors may watch for secondary buy points. Recent gains lifted it more than +5% above its old chart highs.
>>> The latest Featured Stock Update with an annotated graph appeared on 8/31/2010. Click here.
View all notes |
Alert me of new notes |
CANSLIM.net Company Profile |
SEC |
Zacks Reports |
StockTalk |
News |
Chart |
Request a new note
C
A N
S L
I M
|
WCRX
-
NASDAQ
Warner Chilcott Plc
DRUGS - Drug Manufacturers - Other
|
$28.90
|
+0.48
1.69% |
$29.40
|
1,585,226
91.67% of 50 DAV
50 DAV is 1,729,300
|
$30.57
-5.46%
|
8/23/2010
|
$29.54
|
PP = $29.34
|
|
MB = $30.81
|
Most Recent Note - 9/1/2010 2:10:08 PM
Y - Volume totals have been cooling while it remains perched near its pivot point. It was featured in yellow in the mid-day report on 8/23/10 rising from a cup shaped base.
>>> The latest Featured Stock Update with an annotated graph appeared on 8/23/2010. Click here.
View all notes |
Alert me of new notes |
CANSLIM.net Company Profile |
SEC |
Zacks Reports |
StockTalk |
News |
Chart |
Request a new note
C
A N
S L
I M
|