You are not logged in.
This means
you CAN ONLY VIEW reports that were published prior to Saturday, April 5, 2025.
You
MUST UPGRADE YOUR MEMBERSHIP if you want to see any current reports.
 MIDDAY BREAKOUTS REPORT - TUESDAY, AUGUST 31ST, 2010 MIDDAY BREAKOUTS REPORT - TUESDAY, AUGUST 31ST, 2010
Previous Mid Day Report Next Mid Day Report >>>
|
|
DOW 10044.99 35.26 (0.35%) | NASDAQ 2122.3 2.33 (0.11%) | S&P 500 1052.71 3.79 (0.36%)
|
Time of Screening :
8/31/2010 12:03:25 PM Report Released :
8/31/2010 12:47:27 PM
Price is:
Above 52W High and Less Than 52W High
but within 5% of the 52 Week High
Volume Is:
At least 57.5% of 50 Day Average at
the time of the screening.
More details about this report...
At around
mid-way through each trading day we run
a screen against our database of
high-ranked stocks, searching for
possible buy candidates that are trading
at or near their 52-week high on above
average volume. The results of that
screen are split into the two sections
you see below. The first, titled
"TODAY's FEATURED STOCKS" shows stocks
that our experts have recently
identified as among the strongest candidates to
consider. Stocks highlighted in yellow
are the most timely and noteworthy, so
particular attention and prompt action
may be appropriate. The second section,
titled "TODAY's BREAKOUT SCREEN" shows
the remainder of stocks meeting today's
screen parameters. Our experts have
reviewed and included notes on these
stocks as well, but found that they may
not match up as favorably.
|
|
Y - Today's strongest
candidates
highlighted
by our staff
of experts.
|
|
G - Previously featured in
this report as yellow and
now may no longer be buyable
under the guidelines.
|
|
|
Symbol/Exchange
Company Name
Industry Group |
PRICE |
CHANGE
(%Change) |
Day High |
Volume
(% DAV)
(50 DAV) |
52 Wk Hi
% From Hi |
Date
Featured |
Price
Featured |
Pivot Point |
|
Max Buy |
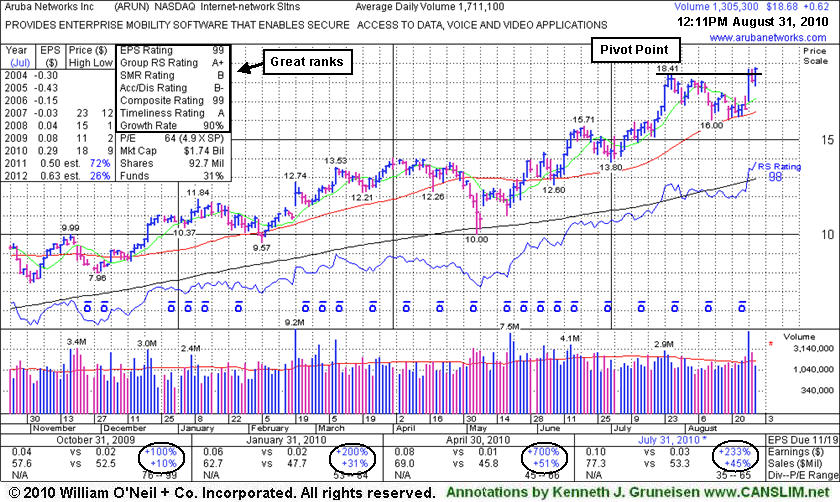
ARUN
- NASDAQ
Aruba Networks Inc
|
$18.70
|
+0.64
3.54%
|
$18.78
|
1,238,996
72.75% of 50 DAV
50 DAV is 1,703,200
|
$18.78
-0.43%
|
8/30/2010 |
$18.12
|
PP = $18.51
MB = $19.44 |
Most Recent Note - 8/31/2010 12:18:56 PM
Y - Hit a new 52-week high today, trading above its pivot point. Technically, its 8/27/10 gain with heavy volume helped it rally up the right side of a 5-week base during which its 50 DMA line acted as a support level. Confirming gains and a follow-through day for the major averages (M criteria) would be reassuring signs. It rebounded impressively since dropped from the Featured Stocks list on 5/06/10 as it and the broader market endured heavy distributional pressure.
>>> The latest Featured Stock Update with an annotated graph appeared on 4/29/2010. Click here.
|
|
View all notes |
Alert me of new notes |
Company Profile |
SEC |
News |
Chart | C
A N
S L
I M
|
EGO
- NYSE
Eldorado Gold Corp
|
$20.03
|
+0.72
3.73%
|
$20.06
|
3,065,213
72.33% of 50 DAV
50 DAV is 4,238,100
|
$20.06
-0.15%
|
8/19/2010 |
$18.25
|
PP = $19.17
MB = $20.13 |
Most Recent Note - 8/31/2010 12:24:36 PM
Y - Gain today for a new 52-week high amid strong leadership (L criteria) in the group. The Canada-based mining firm triggered a technical buy signal last week. However, 3 out of 4 stocks go the direction of the major averages and the M criteria argues against new buying efforts until a follow-through day confirms a new rally.
>>> The latest Featured Stock Update with an annotated graph appeared on 8/19/2010. Click here.
|
|
View all notes |
Alert me of new notes |
Company Profile |
SEC |
News |
Chart | C
A N
S L
I M
|
FOSL
- NASDAQ
Fossil Group Inc
|
$48.56
|
+0.61
1.27%
|
$48.74
|
499,525
57.90% of 50 DAV
50 DAV is 862,800
|
$49.50
-1.90%
|
8/10/2010 |
$45.54
|
PP = $42.69
MB = $44.82 |
Most Recent Note - 8/31/2010 12:28:02 PM
G - Trading up today for an 8th consecutive gain, getting extended from any sound base.
>>> The latest Featured Stock Update with an annotated graph appeared on 8/11/2010. Click here.
|
|
View all notes |
Alert me of new notes |
Company Profile |
SEC |
News |
Chart | C
A N
S L
I M
|
SLW
- NYSE
Silver Wheaton Corp
|
$23.25
|
+0.39
1.70%
|
$23.58
|
3,297,986
71.48% of 50 DAV
50 DAV is 4,613,700
|
$23.58
-1.40%
|
8/25/2010 |
$21.40
|
PP = $21.99
MB = $23.09 |
Most Recent Note - 8/31/2010 12:38:47 PM
Y - Hit another new all-time high today amid strength in the group, trading near its "max buy" level. The M criteria remains a concern until a follow-through day confirms a new rally.
>>> The latest Featured Stock Update with an annotated graph appeared on 8/25/2010. Click here.
|
|
View all notes |
Alert me of new notes |
Company Profile |
SEC |
News |
Chart | C
A N
S L
I M
|
VIT
-
|
$29.27
|
+0.78
2.74%
|
$29.33
|
458,782
81.68% of 50 DAV
50 DAV is 561,700
|
$29.33
-0.21%
|
7/8/2010 |
$25.20
|
PP = $26.58
MB = $27.91 |
Most Recent Note - 8/31/2010 12:47:03 PM
G - Hitting another new all-time high today. Gain on 8/27/10 with +50% above average volume helped it rally to a new all-time high and close above its "max buy" level. Color code was changed to green. No resistance remains due to overhead supply.
>>> The latest Featured Stock Update with an annotated graph appeared on 7/26/2010. Click here.
|
|
View all notes |
Alert me of new notes |
Company Profile |
SEC |
News |
Chart | C
A N
S L
I M
|
|
 |
Symbol - Exchange - Industry Group
Company Name |
Last |
Chg |
Day
High |
52 WK Hi |
% From Hi |
Volume
% DAV |
DAV |
ARMH
- NASDAQ - ELECTRONICS - Semiconductor - Specialized
A R M Holdings Plc Ads
|
$16.81 |
+1.05
6.66%
|
$16.89
|
$16.89
|
-0.47% |
3,111,772
119.49%
|
2,604,200
|
Most Recent Note for ARMH - 8/31/2010 12:05:43 PM
Gapped up today and hit a new 52-week high after basing above its 50 DMA line for about 5 weeks since gapping up on 7/23/10. Recent quarters show improving sales and earnings however its prior comparisons and annual earnings history (A criteria) are below the guidelines of the fact based investment system.
|
|
View all notes |
Alert me of new notes |
Company Profile |
SEC |
News |
Chart | C
A N
S L
I M
|
ENB
- NYSE - ENERGY - Oil & Gas Pipelines
Enbridge Inc
|
$50.23 |
+0.44
0.88%
|
$50.27
|
$51.14
|
-1.78% |
175,448
59.45%
|
295,100
|
Most Recent Note for ENB - 8/31/2010 12:26:09 PM
Earnings and sales history are below guidelines for this Canadian Utility -Gas Distribution firm.
|
|
View all notes |
Alert me of new notes |
Company Profile |
SEC |
News |
Chart | C
A N
S L
I M
|
HLF
- NYSE - DRUGS - Nutrition and Weight Management
Herbalife Ltd
|
$56.15 |
+1.06
1.92%
|
$56.24
|
$57.59
|
-2.50% |
360,128
63.50%
|
567,100
|
Most Recent Note for HLF - 8/31/2010 12:29:41 PM
Still holding its ground in a tight trading range since its 8/03/10 gap up gain. This high-ranked Cosmetics / Personal Care group leader has an up and down annual earnings history (A criteria) that remains a fundamental concern. In the 3 most recent quarters, as noted in prior mid-day reports, this network marketer of weight management and nutritional supplements - "Showed increases in sales and earnings after 4 quarters of negative comparisons. It has rebounded impressively from its Bear Market lows, however its fundamentals are below guidelines, having slumped subsequent to the company's removal from the CANSLIM.net Featured Stocks list on 4/22/08 - details were then covered in the CANSLIM.net After Market Update with an annotated graph (read here)."
|
|
View all notes |
Alert me of new notes |
Company Profile |
SEC |
News |
Chart | C
A N
S L
I M
|
MSB
- NYSE - FINANCIAL SERVICES - Diversified Investments
Mesabi Trust
|
$27.28 |
+1.04
3.96%
|
$27.32
|
$27.50
|
-0.80% |
164,056
108.43%
|
151,300
|
Most Recent Note for MSB - 8/31/2010 12:31:28 PM
Rising near its 52-week high today. It has been rebounding after distributional pressure since recent mid-day report appearances. When recently rising from a cup-with-handle type base pattern it was noted - "The 2 latest quarters showed better increases but prior quarters and annual earnings history has been below guidelines of the fact-based investment system."
|
|
View all notes |
Alert me of new notes |
Company Profile |
SEC |
News |
Chart | C
A N
S L
I M
|
TIBX
- NASDAQ - COMPUTER SOFTWARE & SERVICES - Business Software & Services
Tibco Software Inc
|
$14.42 |
+0.32
2.27%
|
$14.42
|
$14.48
|
-0.41% |
1,834,198
57.89%
|
3,168,600
|
Most Recent Note for TIBX - 8/31/2010 12:44:20 PM
Hit a new 52-week high today after a 5-week flat base above its 50 DMA line. Leadership (L criteria) in the Computer Software - Database group is a reassuring sign. The 2 most recent quarterly comparisons have featured better than +25% earnings increases with accelerating sales revenues growth, and it also has a good annual earnings (A criteria) history.
|
|
View all notes |
Alert me of new notes |
Company Profile |
SEC |
News |
Chart | C
A N
S L
I M
|
|
|
|
THESE ARE NOT BUY RECOMMENDATIONS!
Comments contained in the body of this report are technical
opinions only. The material herein has been obtained
from sources believed to be reliable and accurate, however,
its accuracy and completeness cannot be guaranteed.
We are not an investment advisor, hence it does
not endorse or recommend any securities or other investments.
Any recommendation contained in this report may not
be suitable for all investors and it is not to be deemed
an offer or solicitation on our part with respect to
the purchase or sale of any securities. All trademarks,
service marks and trade names appearing in this report
are the property of their respective owners, and are
likewise used for identification purposes only.
This report is a service available
only to active Paid Premium Members.
You may opt-out of receiving report notifications
at any time. Questions or comments may be submitted
by writing to FactBasedInvesting.com c/o Premium
Member Services 665 S.E. 10 Street, Suite 201
Deerfield Beach, FL 33441-5634 or by calling 954-785-1121.
We appreciate any feedback
members may wish to send via the inquiry form
here.
|
|
|


