You are not logged in.
This means you
CAN ONLY VIEW reports that were published prior to Monday, April 14, 2025.
You
MUST UPGRADE YOUR MEMBERSHIP if you want to see any current reports.
AFTER MARKET UPDATE - MONDAY, AUGUST 31ST, 2009
Previous After Market Report Next After Market Report >>>
|
|
|
|
DOW |
-47.92 |
9,496.28 |
-0.50% |
|
Volume |
1,377,768,470 |
+16% |
|
Volume |
2,416,120,520 |
+0% |
|
NASDAQ |
-19.71 |
2,009.06 |
-0.97% |
|
Advancers |
800 |
26% |
|
Advancers |
766 |
27% |
|
S&P 500 |
-8.31 |
1,020.62 |
-0.81% |
|
Decliners |
2,201 |
71% |
|
Decliners |
1,974 |
69% |
|
Russell 2000 |
-7.79 |
572.07 |
-1.34% |
|
52 Wk Highs |
59 |
|
|
52 Wk Highs |
30 |
|
|
S&P 600 |
-4.42 |
302.22 |
-1.44% |
|
52 Wk Lows |
0 |
|
|
52 Wk Lows |
10 |
|
|
 |
Stocks Sink Worldwide After Shanghai Composite Tumbles
Adam Sarhan, Contributing Writer,
Stocks across the globe were led lower by a decline in China which sent the Shanghai Composite back into a bear market (defined by a decline of at least -20% from a recent high). Decliners trumped advancers by a nearly 3-to-1 ratio on the NYSE and on the Nasdaq exchange. Volume totals were reported higher on the NYSE and very near the prior session total on the Nasdaq exchange. There were only 8 high-ranked companies from the CANSLIM.net Leaders List that made a new 52-week high and appeared on the CANSLIM.net BreakOuts Page, lower than the 22 issues that appeared on the prior session. New 52-week highs solidly outnumbered new 52-week lows on both exchanges while new lows were in the single digits again.
Overnight, the Shanghai Composite Index tumbled -6.7%, which was the largest single-day decline since June 2008. The loss officially sent that index back into a bear market. Over the weekend, Japan's Democratic Party won a major election which marked an end to the single-party government that lasted almost unbroken for half a century. The reason why it is important to pay attention to Asia is because Asian markets were one of the first indexes to rally earlier this year. Therefore, the fact that they are breaking down, coupled with the recent "stalling" action in the US, does not bode well for the bulls.
Since the March lows, the S&P 500 Index has advanced each month, which is the longest stretch of monthly gains since January 2007. The six month rally sent the benchmark S&P 500 soaring over +50% which is one of the strongest 6 month rallies in history. History shows us that the strongest moves (both up and down) occur during bear markets which makes it very interesting to see how the major averages perform over the next few months. History also shows us that both September and October can often be lousy months for the market. Only time will tell how the markets perform in the month ahead. As always, remain alert and only commit your capital to the best names breaking out of sound price bases. Otherwise, cash is safe place to be. For more information about the market be sure to check out September 2009 edition of CANSLIM.net News which will be published tonight!
PICTURED: The Dow Jones Industrial Average closed in the upper half of its daily range after finding support near its prior chart highs.
|
|
|
 |
Defensive Areas Slump Worst Amid Mostly Negative Group Action
Kenneth J. Gruneisen - Passed the CAN SLIM® Master's Exam
Financial shares put up mixed results as the Broker/Dealer Index ($XBD +1.05%) rose and the Bank Index ($BKX -0.55%) modestly fell on Monday. Generally defensive areas were particularly weak as the Gold & Silver Index ($XAU -2.29%), Oil Services Index ($OSX -2.85%), Integrated Oil Index ($XOI -1.49%), and the Healthcare Index ($HMO -1.67%) slumped. The tech sector was mostly negative as the Semiconductor Index ($SOX -1.61%), Networking Index ($NWX -1.37%), and Internet Index ($IIX -1.22%) lost ground, meanwhile the Biotechnology Index ($BTK +0.49%) posted a modest gain.
Charts courtesy www.stockcharts.com
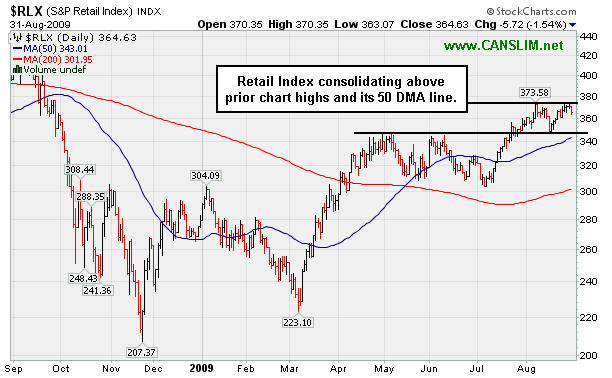
PICTURED: The Retail Index ($RLX -1.57%) is consolidating above prior chart highs and its 50-day moving average (DMA) line.
| Oil Services |
$OSX |
173.34 |
-5.09 |
-2.85% |
+42.80% |
| Healthcare |
$HMO |
1,187.84 |
-20.16 |
-1.67% |
+23.71% |
| Integrated Oil |
$XOI |
978.88 |
-14.85 |
-1.49% |
-0.08% |
| Semiconductor |
$SOX |
306.18 |
-5.00 |
-1.61% |
+44.31% |
| Networking |
$NWX |
212.02 |
-2.95 |
-1.37% |
+47.35% |
| Internet |
$IIX |
202.68 |
-2.50 |
-1.22% |
+51.51% |
| Broker/Dealer |
$XBD |
114.71 |
+1.19 |
+1.05% |
+48.07% |
| Retail |
$RLX |
364.55 |
-5.80 |
-1.57% |
+30.54% |
| Gold & Silver |
$XAU |
147.04 |
-3.45 |
-2.29% |
+18.72% |
| Bank |
$BKX |
47.26 |
-0.26 |
-0.55% |
+6.63% |
| Biotech |
$BTK |
925.56 |
+4.48 |
+0.49% |
+43.02% |
|
|
|
 |
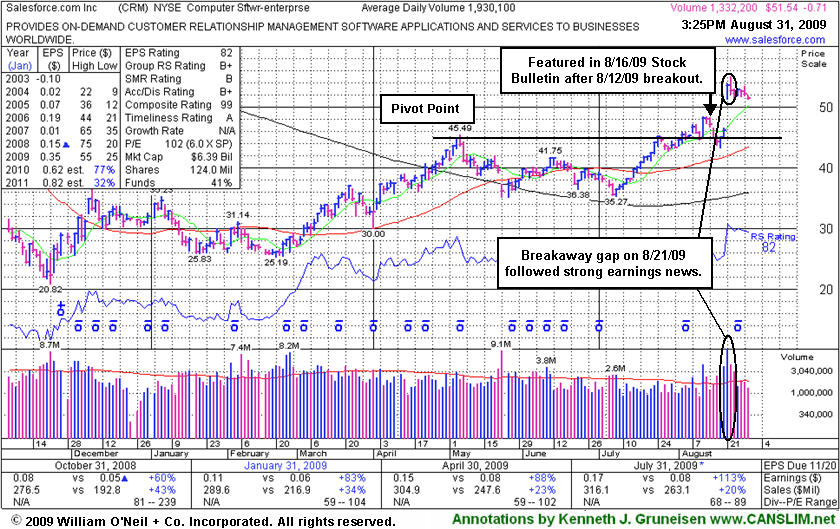
Tight Consolidation Following Breakaway Gap
Kenneth J. Gruneisen - Passed the CAN SLIM® Master's Exam
Salesforce.com, Inc. (CRM -$0.38 or -0.73% to $51.84) has been stubbornly holding its ground while consolidating in a very tight range since its "breakaway gap" for a considerable gain on 8/21/09 with more than 5 times average volume. The stock's exceptional action was discussed further in the "Ken's Mailbag" Q&A with a member in the 8/21/09 After Market Update (read here). A Stock Bulletin was published with detailed analysis and an annotated graph on 8/16/09 (read here). Stock Bulletins are not part of a routine daily or monthly report that we publish for CANSLIM.net's paying members, they are occasionally prepared as the market action dictates. The most action-worthy new ideas show up more often highlighted in yellow in the CANSLIM.net Mid-Day BreakOuts Report, or in the monthly issue of CANSLIM.net News. Market conditions in many recent months have been such that far fewer ideas than we would like have been worthy of the full blown coverage typically provided on stocks in the monthly newsletter, let alone special bulletins. The last bulletin published prior to CRM was more than a year ago - 6/04/2008 Almost Family (AFAM).
CRM's breakaway gap was part of the important batch of new leadership helping the market snap out of a brief correction in mid-August and get back into a "confirmed rally", which is good news concerning the investment system's M criteria. As we have noted in the past, a "breakaway gap" is one valid exception to the rule which limits investors from buying stocks at more than 5% above their prior chart high or pivot point. We have in the past seen the newspaper and experts teaching the Certification suggest that in a very bullish market environment it is permissible to buy stocks as much as 10% above their prior highs when a stock stages a powerful breakaway gap. As it continues to consolidate, CRM may offer investors more ideal chances to accumulate shares on lighter volume pullbacks, or a base-on-base type pattern might form in future weeks.
|
|
|
Color Codes Explained :
Y - Better candidates highlighted by our
staff of experts.
G - Previously featured
in past reports as yellow but may no longer be buyable under the
guidelines.
***Last / Change / Volume quote data in this table corresponds with the timestamp on the note***
Symbol/Exchange
Company Name
Industry Group |
Last |
Chg. |
Vol
% DAV |
Date Featured |
Price Featured |
Latest Pivot Point
Featured |
Status |
| Latest Max Buy Price |
ARO
- NYSE
Aeropostale Inc
RETAIL - Apparel Stores
|
$39.12
|
-0.58
|
2,185,236
72% DAV
3,047,900
|
8/21/2009
(Date
Featured) |
$39.21
(Price
Featured) |
PP = $38.84 |
Y |
| MB = $40.78 |
Most Recent Note - 8/31/2009 4:07:57 PM
Y - High-ranked leader in the Retail - Clothing/shoe group now consolidating below its max buy level and above initial cgart support at prior highs in the $38 area. A gap up gain for a new all-time high on 8/21/09 helped trigger a technical buy signal as it rose from a flat base pattern with almost 3 times average volume. It was featured in yellow with new pivot point and max buy levels noted in the 8/21/09 Mid-Day BreakOuts Report (read here). It has a good annual earnings history (the A criteria), and the 2 latest quarterly comparisons showed +81% and +84% earnings increases, well above the investment system's +25% guideline.
>>> The latest Featured Stock Update with an annotated graph appeared on 8/21/2009. click here.
|
|
C
A
S
I |
News |
Chart |
SEC
View all notes Alert
me of new notes
Company
Profile
|
CPLA
- NASDAQ
Capella Education Co
DIVERSIFIED SERVICES - Education and Training Services
|
$63.35
|
-0.68
|
58,972
31% DAV
189,700
|
7/9/2009
(Date
Featured) |
$59.69
(Price
Featured) |
PP = $62.06 |
Y |
| MB = $65.16 |
Most Recent Note - 8/31/2009 4:10:15 PM
Y - Still quietly consolidating in a tight range on light volume, less than 4% from its 52-week high. The Commercial Services-Schools Group has shown some isolated leadership which is somewhat reassuring for the L criteria, but the groups still has low ranks and CPLA's Relative Strength rank has slumped to 55, under the 80+ guideline. Its small supply of only 13.9 million shares in the float could contribute to greater price volatility in the event of institutional accumulation or distribution. The number of top-rated funds owning an interest rose from 91 in Sept '08, to 137 as of June '09, which is reassuring with respect to the I criteria. It has a very good earnings history that satisfies the C & A criteria.
>>> The latest Featured Stock Update with an annotated graph appeared on 8/19/2009. click here.
|
|
C
A
S
I |
News |
Chart |
SEC
View all notes Alert
me of new notes
Company
Profile
|
CRM
- NYSE
Salesforce.com Inc
INTERNET - Internet Software & Services
|
$51.87
|
-0.38
|
1,695,303
88% DAV
1,930,100
|
8/16/2009
(Date
Featured) |
$47.12
(Price
Featured) |
PP = $45.59 |
Y |
| MB = $47.87 |
Most Recent Note - 8/31/2009 4:11:40 PM
Y - Stubbornly holding its ground in a very tight range since its "breakaway gap" for a considerable gain on 8/21/09 with more than 5 times average volume. A Stock Bulletin was published with detailed analysis and an annotated graph on 8/16/09 (read here).
>>> The latest Featured Stock Update with an annotated graph appeared on 8/31/2009. click here.
|
|
C
A
S
I |
News |
Chart |
SEC
View all notes Alert
me of new notes
Company
Profile
|
EBIX
- NASDAQ
Ebix Inc
COMPUTER SOFTWARE & SERVICES - Business Software & Services
|
$49.36
|
+1.18
|
186,463
216% DAV
86,300
|
8/28/2009
(Date
Featured) |
$45.86
(Price
Featured) |
PP = $45.35 |
G |
| MB = $47.62 |
Most Recent Note - 8/31/2009 4:18:48 PM
G - Gain with higher volume, rising above its max buy level today. Its color code was changed to green. Triggered a technical buy signal as it blasted to a new all-time high on 8/28/09, rising from a big cup-with-high-handle shaped pattern. It has rebounded impressively and was re-featured in yellow at $45.86 with new pivot point and max buy levels noted in the 8/28/09 Mid-Day BreakOuts Report (read here). Sales and earnings increases in quarterly comparisons have been strong, but they have shown steady sequential deceleration. This high-ranked leader had traded up more than +59% after it was first featured in the March 2008 CANSLIM.net News (read here), but weak action later in the year subsequently prompted it to be dropped from the Featured Stocks list. Do not be confused by the 3:1 split that took effect on 10/09/08.
>>> The latest Featured Stock Update with an annotated graph appeared on 8/28/2009. click here.
|
|
C
A
S
I |
News |
Chart |
SEC
View all notes Alert
me of new notes
Company
Profile
|
GMCR
- NASDAQ
Green Mtn Coffee Roastrs
FOOD & BEVERAGE - Processed & Packaged Goods
|
$60.19
|
-0.18
|
829,204
50% DAV
1,661,000
|
7/17/2009
(Date
Featured) |
$60.15
(Price
Featured) |
PP = $63.79 |
G |
| MB = $66.98 |
Most Recent Note - 8/31/2009 4:20:31 PM
G - Still trading under its 50 DMA line which is now downward sloping and a source of technical resistance, with the next support at prior chart lows in the $54-53 area. As previously noted, "its gap down and considerable loss on 8/17/09 on heavy volume triggered technical sell signals." GMCR traded up more than +168% since appearing with an annotated graph under the headline "It May Soon Be Time To Go Green" when featured in the January 2009 CANSLIM.net News (read here).
>>> The latest Featured Stock Update with an annotated graph appeared on 8/26/2009. click here.
|
|
C
A
S
I |
News |
Chart |
SEC
View all notes Alert
me of new notes
Company
Profile
|
LFT
-
|
$24.70
|
-0.67
|
801,089
103% DAV
776,900
|
8/10/2009
(Date
Featured) |
$31.49
(Price
Featured) |
PP = $30.57 |
G |
| MB = $32.10 |
Most Recent Note - 8/31/2009 4:23:22 PM
G - Gapped down today for a loss on average volume, violating a multi-month upward trendline connecting February, July, and August chart lows, raising more serious concerns and triggering additional technical sell signals. Volume behind recent gains has been very light since previously noted "substantial losses on heavy volume indicative of distributional pressure." It would need to rally back above its 50 DMA and recent chart highs for its outlook to improve.
>>> The latest Featured Stock Update with an annotated graph appeared on 8/25/2009. click here.
|
|
C
A
S
I |
News |
Chart |
SEC
View all notes Alert
me of new notes
Company
Profile
|
NTES
- NASDAQ
Netease Inc Adr
INTERNET - Internet Information Providers
|
$41.99
|
-0.06
|
1,323,608
58% DAV
2,270,900
|
7/17/2009
(Date
Featured) |
$39.29
(Price
Featured) |
PP = $38.74 |
G |
| MB = $40.68 |
Most Recent Note - 8/31/2009 4:25:19 PM
G - Quietly consolidating in a tight range above support at its 50 DMA line and above prior chart highs in the $38 area. Deterioration below those levels would raise more serious concerns and triggger additional sell signals. As previously noted, "a 8/13/09 gap down for a considerable loss on nearly 4 times average volume triggered a technical sell signal."
>>> The latest Featured Stock Update with an annotated graph appeared on 8/27/2009. click here.
|
|
C
A
S
I |
News |
Chart |
SEC
View all notes Alert
me of new notes
Company
Profile
|
NVEC
- NASDAQ
N V E Corp
ELECTRONICS - Semiconductor - Specialized
|
$53.20
|
-1.03
|
56,612
61% DAV
93,300
|
8/26/2009
(Date
Featured) |
$55.32
(Price
Featured) |
PP = $57.60 |
Y |
| MB = $60.48 |
Most Recent Note - 8/31/2009 4:28:02 PM
Y - Posted its 4th consecutive loss today on below average volume, yet it is still hovering within 7.5% of all-time highs and its latest pivot point. Basing for 5 weeks above important initial support at its 50 DMA line and prior chart highs. Quarterly sales revenues in the 6 million dollar range are still rather minuscule, leaving concerns.
>>> The latest Featured Stock Update with an annotated graph appeared on 8/18/2009. click here.
|
|
C
A
S
I |
News |
Chart |
SEC
View all notes Alert
me of new notes
Company
Profile
|
PEGA
- NASDAQ
Pegasystems Inc
COMPUTER SOFTWARE & SERVICES - Business Software & Services
|
$30.63
|
-0.67
|
387,495
107% DAV
362,700
|
7/29/2009
(Date
Featured) |
$27.53
(Price
Featured) |
PP = $27.49 |
G |
| MB = $28.86 |
Most Recent Note - 8/31/2009 4:29:22 PM
G - Pulled back today, falling for a 4th consecutive session on near average volume after an impressive 6 session winning streak. Recently found support at its 50 DMA line.
>>> The latest Featured Stock Update with an annotated graph appeared on 8/24/2009. click here.
|
|
C
A
S
I |
News |
Chart |
SEC
View all notes Alert
me of new notes
Company
Profile
|
|
|
|
THESE ARE NOT BUY RECOMMENDATIONS!
Comments contained in the body of this report are technical
opinions only. The material herein has been obtained
from sources believed to be reliable and accurate, however,
its accuracy and completeness cannot be guaranteed.
This site is not an investment advisor, hence it does
not endorse or recommend any securities or other investments.
Any recommendation contained in this report may not
be suitable for all investors and it is not to be deemed
an offer or solicitation on our part with respect to
the purchase or sale of any securities. All trademarks,
service marks and trade names appearing in this report
are the property of their respective owners, and are
likewise used for identification purposes only.
This report is a service available
only to active Paid Premium Members.
You may opt-out of receiving report notifications
at any time. Questions or comments may be submitted
by writing to Premium Membership Services 665 S.E. 10 Street, Suite 201 Deerfield Beach, FL 33441-5634 or by calling 1-800-965-8307
or 954-785-1121.
|
|
|


