You are not logged in.
This means you
CAN ONLY VIEW reports that were published prior to Tuesday, April 15, 2025.
You
MUST UPGRADE YOUR MEMBERSHIP if you want to see any current reports.
AFTER MARKET UPDATE - FRIDAY, AUGUST 28TH, 2009
Previous After Market Report Next After Market Report >>>
|
|
|
|
DOW |
-36.43 |
9,544.20 |
-0.38% |
|
Volume |
1,186,328,360 |
+2% |
|
Volume |
2,407,801,900 |
+11% |
|
NASDAQ |
+1.04 |
2,028.77 |
+0.05% |
|
Advancers |
1,510 |
49% |
|
Advancers |
962 |
34% |
|
S&P 500 |
-2.05 |
1,028.93 |
-0.20% |
|
Decliners |
1,487 |
48% |
|
Decliners |
1,753 |
62% |
|
Russell 2000 |
-3.91 |
579.86 |
-0.67% |
|
52 Wk Highs |
73 |
|
|
52 Wk Highs |
70 |
|
|
S&P 600 |
-1.73 |
306.64 |
-0.56% |
|
52 Wk Lows |
0 |
|
|
52 Wk Lows |
8 |
|
|
 |
Indices Staying Confined To A Tight Trading Range
Adam Sarhan, Contributing Writer,
As the last full month of summer gets ready to close, US stocks ended higher for the week after trading in a very narrow range. Advancers narrowly led decliners on the NYSE, but decliners outnumbered advancers by nearly a 2-to-1 ratio on the Nasdaq exchange. Volume totals were reported slightly higher on the NYSE and on the Nasdaq exchange versus the prior session which could be considered "churning" type action which is generally distributional. There were 22 high-ranked companies from the CANSLIM.net Leaders List that made a new 52-week high and appeared on the CANSLIM.net BreakOuts Page, higher than the 13 issues that appeared on the prior session. New 52-week highs solidly outnumbered new 52-week lows on both exchanges while new lows were in the single digits again.
On Monday, Asian stocks soared following Friday's strong performance in the US. That set the stage for a positive open in the US, but the buying demand quickly waned as fears returned that more bank failures were on the horizon. SunTrust Chairman and Chief Executive Officer James Wells III said in a speech at the Rotary Club of Atlanta that "This credit cycle has yet to play itself out...We do not expect things to improve for the banking industry in the very near future." He also said "the industry is a long way from declaring any sort of victory." Mr. Wells made it clear that he expects lenders to face more credit losses and commercial real estate may continue to decline through 2010. Elsewhere, famous bank analyst Dick Bove said he expects more 150-200 more banks to fail before we are out of the woods. Automobile companies slid as the "cash for clunkers" program entered its last day.
On Tuesday, the major averages closed with modest gains after US consumer confidence rose more than forecast and national home prices rose for the first time in three years! The Conference Board’s consumer sentiment index rose to 54.1 in August which was the first monthly gain since May. More positive news came when the S&P/Case-Shiller home-price index rose +2.9% in the second quarter from the previous three months. This was the first increase in home prices since the horrific housing depression began in 2006 and the largest gain in almost four years! President Barack Obama nominated Ben S. Bernanke to a second term (pending Senate approval) which is a strong vote of confidence in Bernanke's actions at the helm. Obama nominated Bernanke, who led the largest expansion of the Federal Reserve's power in its 95-year history to curb the worst financial crisis since the Great Depression, for a second four-year term starting January 31, 2010. In other economic news, the White House Office of Management and Budget released a forecast today that showed they believe the economy will grow +2% in 2010 which is less than the +3.2% forecast released in May. They also believe that unemployment will surpass the +10% level in 2009 and the budget deficit will swell to +$1.5 trillion next year, both higher than the prior estimates.
On Wednesday, stocks ended modestly higher after the government reported that durable goods rose +4.9% last month but the core component which strips out the highly volatile non-defense component (mainly transportation), slid -0.3%. The smaller than expected rise in core orders left many investors questioning the underlying health of the economy. Even a stronger than expected housing report failed to offset this concern. The Commerce Department said that new home sales jumped +9.6% in July which was the largest gain in four years to an annual rate of +433,000.
On Thursday, stocks positively reversed (overcame earlier weakness and closed higher) after the preliminary second quarter GDP report's headline number showed a better-than-expected -1.0% annualized decline. Consumer spending during Q2 also topped expectations by contracting -1.0%, an improvement from the previous -1.2% decline. Meanwhile, initial jobless claims were reported in-line with expectations at 570,000, down 10,000 from the previous week. Continuing claims at 6.13 million were below expectations and down more than 100,000 from the previous week as more unemployed workers lost their jobless benefits.
On Friday, stocks ended lower as the US dollar advanced. For the past few years, the inverse relationship between the US dollar and US stocks has been intact which means stocks tend to decline when the USD rallies and the converse is also true. Since the market is still in "rally mode" it is very important to remain objective and only buy the strongest stocks that are breaking out of the strongest bases.
Money Management Services: Free Portfolio Review!
Investors often inquire looking for a money manager who follows a proven set of rules and who has completed the Master's Program, demonstrating a high level of skill at using this powerful investment system. Well, you are in luck! If you qualify to open an account with us you will have not one, but two highly qualified portfolio managers who have completed the Master's Program and follow the rules of this powerful investment system. Learn more about having your account professionally managed using this fact-based investment system by clicking HERE. *Accounts over $250,000 please. ** Serious inquiries only.
PICTURED: The Nasdaq Composite Index closed in a very tight range all week.
|
|
|
 |
Semiconductor Index Hits 2009 High
Kenneth J. Gruneisen - Passed the CAN SLIM® Master's Exam
Modest gains from the financial group on Friday helped the Bank Index ($BKX +0.66%) and Broker/Dealer Index ($XBD +1.10%) post gains. The Gold & Silver Index ($XAU +1.82%) was also a positive influence while the Healthcare Index ($HMO -2.03%) was a clear laggard. Energy shares showed little direction as the Integrated Oil Index ($XOI -0.35%) edged lower and the Oil Services Index ($OSX +0.15%) edged higher. The Retail Index ($RLX +0.03%) finished flat. Small gains from the Internet Index ($IIX +0.28%), Networking Index ($NWX +0.37%), and Biotechnology Index ($BTK +0.49%) were outmatched by the Semiconductor Index ($SOX +2.44%) show below.
Charts courtesy www.stockcharts.com
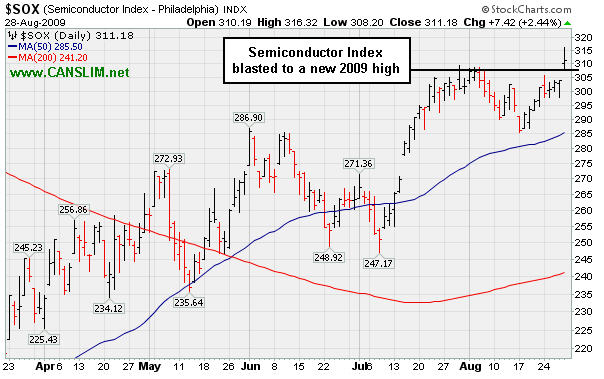
PICTURED: The Semiconductor Index ($SOX +2.44%) blasted to a new 2009 high. Among the chip group's big gainers on Friday were STMicroelectronics NV (STM +11.73%), Pixelworks Inc. (PXLW +13.71%), OmniVision Technologies Inc. (OVTI +12.26%), and Trident Microsystems Inc. (TRID +8.77%), none of which has the strong earnings history needed to earn high enough ranks to make it into the CANSLIM.net Leaders List.
| Oil Services |
$OSX |
178.43 |
+0.26 |
+0.15% |
+46.99% |
| Healthcare |
$HMO |
1,208.00 |
-25.07 |
-2.03% |
+25.81% |
| Integrated Oil |
$XOI |
993.73 |
-3.50 |
-0.35% |
+1.43% |
| Semiconductor |
$SOX |
311.18 |
+7.42 |
+2.44% |
+46.67% |
| Networking |
$NWX |
214.97 |
+0.80 |
+0.37% |
+49.40% |
| Internet |
$IIX |
205.18 |
+0.57 |
+0.28% |
+53.38% |
| Broker/Dealer |
$XBD |
113.52 |
+1.23 |
+1.10% |
+46.53% |
| Retail |
$RLX |
370.35 |
+0.11 |
+0.03% |
+32.62% |
| Gold & Silver |
$XAU |
150.49 |
+2.69 |
+1.82% |
+21.51% |
| Bank |
$BKX |
47.52 |
+0.31 |
+0.66% |
+7.22% |
| Biotech |
$BTK |
921.13 |
+4.51 |
+0.49% |
+42.33% |
|
|
|
 |
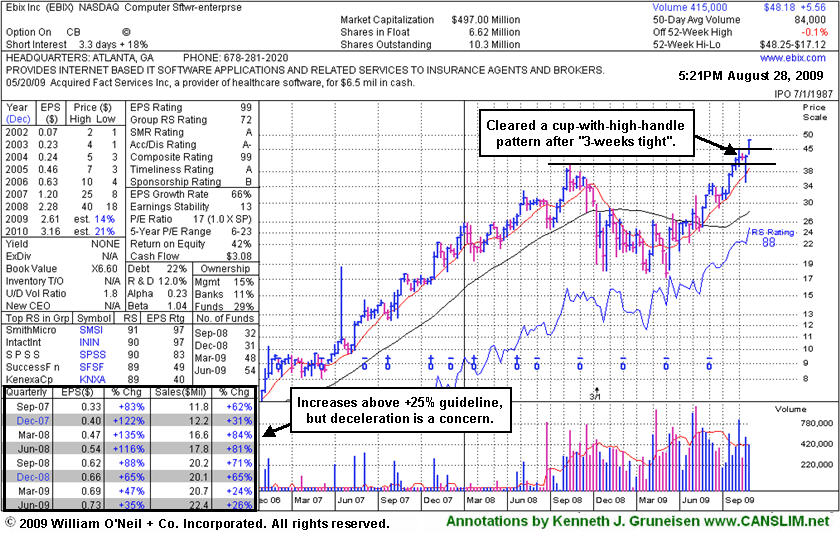
Software Firm Ended Strong After Mid-Day Report Appearance
Kenneth J. Gruneisen - Passed the CAN SLIM® Master's Exam
Ebix Inc (EBIX +$3.36 or +6.97% to $48.18) was highlighted in yellow with new pivot point and max buy levels noted in the 8/28/09 CANSLIM.net Mid-Day BreakOuts Report today (read here) as it was reaching a new all-time high. It triggered a technical buy signal and closed the session near its intra-day high with a considerable gain backed by volume +81.94% above average as it cleared a cup-with-high-handle pattern after "3-weeks tight". It formed the big cup-with-high-handle shaped pattern (finding great support at its 50 DMA line) since weak action prompted it to be dropped from the Featured Stocks list on 10/07/08. Sales and earnings increases in quarterly comparisons have been strong, but they have shown steady sequential deceleration which is of some concern.
EBIX traded up more than +59% after it was first featured in the March 2008 CANSLIM.net News (read here). At that time its 50-day average daily volume was only 4,900 shares, whereas today its average volume is at 84,000 shares. Today there are 6.62 million shares (the S criteria) in the public float, so its share price still could be very volatile in the event of heavy institutional buying or selling. The number of top-rated funds owning an interest in its shares rose from 31 in Dec '08 to 54 in Jun '09, which is a good sign concerning the I criteria of the investment system. Do not be confused by the 3:1 split that took effect on 10/09/08. It has rebounded impressively and cleared its August '08 highs in the $40 area recently, after steadily climbing from this year's lows in the $17 range.
|
|
|
Color Codes Explained :
Y - Better candidates highlighted by our
staff of experts.
G - Previously featured
in past reports as yellow but may no longer be buyable under the
guidelines.
***Last / Change / Volume quote data in this table corresponds with the timestamp on the note***
Symbol/Exchange
Company Name
Industry Group |
Last |
Chg. |
Vol
% DAV |
Date Featured |
Price Featured |
Latest Pivot Point
Featured |
Status |
| Latest Max Buy Price |
ARO
- NYSE
Aeropostale Inc
RETAIL - Apparel Stores
|
$39.70
|
-0.60
|
3,045,794
100% DAV
3,042,200
|
8/21/2009
(Date
Featured) |
$39.21
(Price
Featured) |
PP = $38.84 |
Y |
| MB = $40.78 |
Most Recent Note - 8/28/2009 6:06:30 PM
Y - This high-ranked leader in the Retail - Clothing/shoe group is still consolidating below its max buy level and above prior highs in the $38 area that should act as an initial chart support level now. A gap up gain for a new all-time high on 8/21/09 helped triggering a technical buy signal as it rose from a flat base pattern with almost 3 times average volume. It was featured in yellow with new pivot point and max buy levels noted in the 8/21/09 Mid-Day BreakOuts Report (read here). It has a good annual earnings history (the A criteria), and the 2 latest quarterly comparisons showed +81% and +84% earnings increases, well above the investment system's +25% guideline.
>>> The latest Featured Stock Update with an annotated graph appeared on 8/21/2009. click here.
|
|
C
A
S
I |
News |
Chart |
SEC
View all notes Alert
me of new notes
Company
Profile
|
CPLA
- NASDAQ
Capella Education Co
DIVERSIFIED SERVICES - Education and Training Services
|
$64.03
|
+0.16
|
59,625
31% DAV
191,100
|
7/9/2009
(Date
Featured) |
$59.69
(Price
Featured) |
PP = $62.06 |
Y |
| MB = $65.16 |
Most Recent Note - 8/28/2009 6:07:36 PM
Y - Still quietly consolidating in a tight range on light volume, just 3% from its 52-week high. The Commercial Services-Schools Group has shown some isolated leadership which is somewhat reassuring for the L criteria, but the groups still has low ranks and CPLA's Relative Strength rank has slumped to 56, under the 80+ guideline. Its small supply of only 13.9 million shares in the float could contribute to greater price volatility in the event of institutional accumulation or distribution. The number of top-rated funds owning an interest rose from 91 in Sept '08, to 137 as of June '09, which is reassuring with respect to the I criteria. It has a very good earnings history that satisfies the C & A criteria.
>>> The latest Featured Stock Update with an annotated graph appeared on 8/19/2009. click here.
|
|
C
A
S
I |
News |
Chart |
SEC
View all notes Alert
me of new notes
Company
Profile
|
CRM
- NYSE
Salesforce.com Inc
INTERNET - Internet Software & Services
|
$52.25
|
-0.43
|
1,846,423
96% DAV
1,917,800
|
8/16/2009
(Date
Featured) |
$47.12
(Price
Featured) |
PP = $45.59 |
Y |
| MB = $47.87 |
Most Recent Note - 8/28/2009 6:08:17 PM
Y - Holding its ground in a very tight range since its "breakaway gap" for a considerable gain on 8/21/09 with more than 5 times average volume. The stock's exceptional action was discussed further in the "Ken's Mailbag" Q&A with a member in the 8/21/09 After Market Update (read here). A Stock Bulletin was published with detailed analysis and an annotated graph on 8/16/09 (read here).
>>> The latest Featured Stock Update with an annotated graph appeared on 8/16/2009. click here.
|
|
C
A
S
I |
News |
Chart |
SEC
View all notes Alert
me of new notes
Company
Profile
|
EBIX
- NASDAQ
Ebix Inc
COMPUTER SOFTWARE & SERVICES - Business Software & Services
|
$48.18
|
+3.36
|
152,829
182% DAV
84,000
|
8/28/2009
(Date
Featured) |
$45.86
(Price
Featured) |
PP = $45.35 |
Y |
| MB = $47.62 |
Most Recent Note - 8/28/2009 6:17:32 PM
Y - Triggered a technical buy signal as it blasted to a new all-time high today, rising from a big cup-with-high-handle shaped pattern. It has rebounded impressively and was re-featured in yellow at $45.86 with new pivot point and max buy levels noted in the 8/28/09 Mid-Day BreakOuts Report (read here). Sales and earnings increases in quarterly comparisons have been strong, but they have shown steady sequential deceleration. This high-ranked leader had traded up more than +59% after it was first featured in the March 2008 CANSLIM.net News (read here), but weak action later in the year subsequently prompted it to be dropped from the Featured Stocks list. Do not be confused by the 3:1 split that took effect on 10/09/08.
>>> The latest Featured Stock Update with an annotated graph appeared on 8/28/2009. click here.
|
|
C
A
S
I |
News |
Chart |
SEC
View all notes Alert
me of new notes
Company
Profile
|
GMCR
- NASDAQ
Green Mtn Coffee Roastrs
FOOD & BEVERAGE - Processed & Packaged Goods
|
$60.37
|
+0.66
|
569,284
34% DAV
1,665,900
|
7/17/2009
(Date
Featured) |
$60.15
(Price
Featured) |
PP = $63.79 |
G |
| MB = $66.98 |
Most Recent Note - 8/28/2009 6:18:42 PM
G - Posted another small gain on very light volume today. Its outlook is increasingly questionable the longer it stays trading under its 50 DMA line which is now downward sloping and a source of technical resistance. The next support is at prior chart lows in the $54-53 area. As previously noted, "its gap down and considerable loss on 8/17/09 on heavy volume triggered technical sell signals." GMCR traded up more than +168% since appearing with an annotated graph under the headline "It May Soon Be Time To Go Green" when featured in the January 2009 CANSLIM.net News (read here).
>>> The latest Featured Stock Update with an annotated graph appeared on 8/26/2009. click here.
|
|
C
A
S
I |
News |
Chart |
SEC
View all notes Alert
me of new notes
Company
Profile
|
LFT
-
|
$25.37
|
-0.80
|
754,462
97% DAV
775,200
|
8/10/2009
(Date
Featured) |
$31.49
(Price
Featured) |
PP = $30.57 |
G |
| MB = $32.10 |
Most Recent Note - 8/28/2009 6:25:18 PM
G - Weak action in the past week led to a violation of its 50 DMA line again, and volume behind recent gains has been very light since previously noted "substantial losses on heavy volume indicative of distributional pressure." It is trading near recent chart lows an its multi-month upward trendline connecting the February, July, and August chart lows where further deterioration would raise more serious concerns and trigger additional technical sell signals. It would need to rally back above its 50 DMA and recent chart highs for its outlook to improve.
>>> The latest Featured Stock Update with an annotated graph appeared on 8/25/2009. click here.
|
|
C
A
S
I |
News |
Chart |
SEC
View all notes Alert
me of new notes
Company
Profile
|
NTES
- NASDAQ
Netease Inc Adr
INTERNET - Internet Information Providers
|
$42.05
|
-0.40
|
1,305,364
57% DAV
2,281,300
|
7/17/2009
(Date
Featured) |
$39.29
(Price
Featured) |
PP = $38.74 |
G |
| MB = $40.68 |
Most Recent Note - 8/28/2009 6:31:52 PM
G - Volume is still drying up while consolidating in a tight range above support at its 50 DMA line and above prior chart highs in the $38 area. Deterioration below those levels would raise more serious concerns and triggger additional sell signals. As previously noted, "a 8/13/09 gap down for a considerable loss on nearly 4 times average volume triggered a technical sell signal."
>>> The latest Featured Stock Update with an annotated graph appeared on 8/27/2009. click here.
|
|
C
A
S
I |
News |
Chart |
SEC
View all notes Alert
me of new notes
Company
Profile
|
NVEC
- NASDAQ
N V E Corp
ELECTRONICS - Semiconductor - Specialized
|
$54.23
|
-0.59
|
41,416
44% DAV
94,200
|
8/26/2009
(Date
Featured) |
$55.32
(Price
Featured) |
PP = $57.60 |
Y |
| MB = $60.48 |
Most Recent Note - 8/28/2009 6:35:18 PM
Y - Quiet consolidation continues within close striking range of all-time highs and its latest pivot point. Basing for 5 weeks above important initial support at its 50 DMA line and prior chart highs. Quarterly sales revenues in the 6 million dollar range are still rather minuscule, leaving concerns.
>>> The latest Featured Stock Update with an annotated graph appeared on 8/18/2009. click here.
|
|
C
A
S
I |
News |
Chart |
SEC
View all notes Alert
me of new notes
Company
Profile
|
PEGA
- NASDAQ
Pegasystems Inc
COMPUTER SOFTWARE & SERVICES - Business Software & Services
|
$31.30
|
-1.02
|
294,543
82% DAV
359,100
|
7/29/2009
(Date
Featured) |
$27.53
(Price
Featured) |
PP = $27.49 |
G |
| MB = $28.86 |
Most Recent Note - 8/28/2009 6:38:13 PM
G - Pulled back today, falling for a 3rd consecutive session on below average volume after an impressive 6 session winning streak since finding support at its 50 DMA line.
>>> The latest Featured Stock Update with an annotated graph appeared on 8/24/2009. click here.
|
|
C
A
S
I |
News |
Chart |
SEC
View all notes Alert
me of new notes
Company
Profile
|
UTA
-
|
$10.06
|
-1.27
|
1,095,904
N/A
|
7/28/2009
(Date
Featured) |
$12.87
(Price
Featured) |
PP = $12.70 |
|
| MB = $13.34 |
Most Recent Note - 8/28/2009
Considerable loss today on above average volume violated its 8/18/09 low ($10.91), raising more serious concerns. Based on weak technical action it will be dropped from the Featured Stocks list tonight. It violated its 50 DMA line on 8/27/09 triggering a technical sell signal. There has been a lack of volume behind gains since its negative reversal on 8/13/09 for a loss on very heavy volume was noted as "a clear sign of worrisome distributional pressure." Strong action prompted it to be featured in yellow with pivot point and max buy levels noted in the 7/28/09 mid-day breakouts report (read here), with additional analysis included in the after market update (read here).
>>> The latest Featured Stock Update with an annotated graph appeared on 8/20/2009. click here.
|
|
C
A
S
I |
News |
Chart |
SEC
View all notes Alert
me of new notes
Company
Profile
|
|
|
|
THESE ARE NOT BUY RECOMMENDATIONS!
Comments contained in the body of this report are technical
opinions only. The material herein has been obtained
from sources believed to be reliable and accurate, however,
its accuracy and completeness cannot be guaranteed.
This site is not an investment advisor, hence it does
not endorse or recommend any securities or other investments.
Any recommendation contained in this report may not
be suitable for all investors and it is not to be deemed
an offer or solicitation on our part with respect to
the purchase or sale of any securities. All trademarks,
service marks and trade names appearing in this report
are the property of their respective owners, and are
likewise used for identification purposes only.
This report is a service available
only to active Paid Premium Members.
You may opt-out of receiving report notifications
at any time. Questions or comments may be submitted
by writing to Premium Membership Services 665 S.E. 10 Street, Suite 201 Deerfield Beach, FL 33441-5634 or by calling 1-800-965-8307
or 954-785-1121.
|
|
|


