***Last / Change / Volume data in this table is the closing quote data***
Symbol/Exchange
Company Name
Industry Group |
PRICE |
CHANGE
(%Change) |
Day High |
Volume
(% DAV)
(% 50 day avg vol) |
52 Wk Hi
% From Hi |
Featured
Date |
Price
Featured |
Pivot Featured |
|
Max Buy |
ABV
-
NYSE
Comp De Bebidas Adr
FOOD and BEVERAGE - Beverages - Brewers
|
$107.77
|
-0.81
-0.75% |
$109.12
|
374,147
56.52% of 50 DAV
50 DAV is 662,000
|
$112.60
-4.29%
|
6/29/2010
|
$104.74
|
PP = $109.33
|
|
MB = $114.80
|
Most Recent Note - 8/27/2010 4:22:01 PM
G - This Brazil-based beverage firm posted a small gain today on light volume, making a stand at its 50 DMA line.
>>> The latest Featured Stock Update with an annotated graph appeared on 8/18/2010. Click here.
View all notes |
Alert me of new notes |
CANSLIM.net Company Profile |
SEC |
Zacks Reports |
StockTalk |
News |
Chart |
Request a new note
C
A N
S L
I M


|
ARUN
-
NASDAQ
Aruba Networks Inc
COMPUTER HARDWARE - Networking andamp; Communication Dev
|
$18.06
|
-0.33
-1.79% |
$18.70
|
2,635,845
154.76% of 50 DAV
50 DAV is 1,703,200
|
$18.69
-3.37%
|
8/30/2010
|
$18.12
|
PP = $18.51
|
|
MB = $19.44
|
 Most Recent Note - 8/30/2010 12:36:43 PM
Y - Pulling back today after a considerable gain on Friday following another strong quarterly earnings report. Technically, its 8/27/10 gain with heavy volume helped it rise to a new 52-week high on the right side of a 5-week base during which its 50 DMA line acted as a support level. Color code is changed to yellow. Confirming gains and a follow-through day for the major averages (M criteria) would be reassuring signs, especially since its prior highs may act as resistance. It rebounded impressively since dropped from the Featured Stocks list on 5/06/10 as it and the broader market endured heavy distributional pressure.
>>> The latest Featured Stock Update with an annotated graph appeared on 4/29/2010. Click here.
View all notes |
Alert me of new notes |
CANSLIM.net Company Profile |
SEC |
Zacks Reports |
StockTalk |
News |
Chart |
Request a new note
C
A N
S L
I M
|
BIDU
-
NASDAQ
Baidu Inc Ads
INTERNET - Internet Information Providers
|
$77.24
|
-2.13
-2.68% |
$80.60
|
6,707,892
61.01% of 50 DAV
50 DAV is 10,995,200
|
$88.32
-12.55%
|
7/14/2010
|
$75.03
|
PP = $78.59
|
|
MB = $82.52
|
Most Recent Note - 8/30/2010 5:32:29 PM
G - Negative reversal today led to a close below its 50 DMA line again.
>>> The latest Featured Stock Update with an annotated graph appeared on 8/13/2010. Click here.
View all notes |
Alert me of new notes |
CANSLIM.net Company Profile |
SEC |
Zacks Reports |
StockTalk |
News |
Chart |
Request a new note
C
A N
S L
I M
|
CACC
-
NASDAQ
Credit Acceptance Corp
FINANCIAL SERVICES - Credit Services
|
$56.73
|
-2.94
-4.93% |
$59.67
|
42,039
78.14% of 50 DAV
50 DAV is 53,800
|
$61.41
-7.62%
|
7/29/2010
|
$52.04
|
PP = $54.07
|
|
MB = $56.77
|
Most Recent Note - 8/30/2010 3:25:43 PM
G - Consolidating near its "max buy" level at its low today with volume totals recently cooling. Support to watch is its 50 DMA and old high near $54. It traded up in 19 of the past 21 months.
>>> The latest Featured Stock Update with an annotated graph appeared on 8/2/2010. Click here.
View all notes |
Alert me of new notes |
CANSLIM.net Company Profile |
SEC |
Zacks Reports |
StockTalk |
News |
Chart |
Request a new note
C
A N
S L
I M
|
CRM
-
NYSE
Salesforce.Com Inc
INTERNET - Internet Software and Services
|
$109.17
|
-2.31
-2.07% |
$112.28
|
2,218,192
86.40% of 50 DAV
50 DAV is 2,567,300
|
$114.15
-4.36%
|
6/2/2010
|
$88.44
|
PP = $89.60
|
|
MB = $94.08
|
Most Recent Note - 8/30/2010 5:33:46 PM
G - Down today with below average volume. It is still extended from any sound base, not currently buyable under the investment system guidelines.
>>> The latest Featured Stock Update with an annotated graph appeared on 8/16/2010. Click here.
View all notes |
Alert me of new notes |
CANSLIM.net Company Profile |
SEC |
Zacks Reports |
StockTalk |
News |
Chart |
Request a new note
C
A N
S L
I M
|
Symbol/Exchange
Company Name
Industry Group |
PRICE |
CHANGE
(%Change) |
Day High |
Volume
(% DAV)
(% 50 day avg vol) |
52 Wk Hi
% From Hi |
Featured
Date |
Price
Featured |
Pivot Featured |
|
Max Buy |
EGO
-
NYSE
Eldorado Gold Corp
METALS and MINING - Gold
|
$19.31
|
-0.32
-1.63% |
$19.72
|
3,168,105
74.75% of 50 DAV
50 DAV is 4,238,100
|
$19.63
-1.63%
|
8/19/2010
|
$18.25
|
PP = $19.17
|
|
MB = $20.13
|
Most Recent Note - 8/27/2010 4:36:54 PM
Y - Closed near the session high today with a 3rd consecutive gain backed by above average volume for the Canada-based mining firm. It triggered a technical buy signal this week, but keep in mind that 3 out of 4 stocks go the direction of the major averages and the M criteria argues against new buying efforts until a follow-through day confirms a new rally.
>>> The latest Featured Stock Update with an annotated graph appeared on 8/19/2010. Click here.
View all notes |
Alert me of new notes |
CANSLIM.net Company Profile |
SEC |
Zacks Reports |
StockTalk |
News |
Chart |
Request a new note
C
A N
S L
I M
|
FFIV
-
NASDAQ
F 5 Networks Inc
INTERNET - Internet Software and Services
|
$89.24
|
+0.22
0.25% |
$90.97
|
1,203,312
71.62% of 50 DAV
50 DAV is 1,680,200
|
$92.70
-3.73%
|
6/16/2010
|
$74.50
|
PP = $74.10
|
|
MB = $77.81
|
Most Recent Note - 8/27/2010 4:44:52 PM
G - Consolidating in an orderly fashion, its 50 DMA and recent low coincide near $80, defining support.
>>> The latest Featured Stock Update with an annotated graph appeared on 8/4/2010. Click here.
View all notes |
Alert me of new notes |
CANSLIM.net Company Profile |
SEC |
Zacks Reports |
StockTalk |
News |
Chart |
Request a new note
C
A N
S L
I M
|
FOSL
-
NASDAQ
Fossil Inc
CONSUMER DURABLES - Recreational Goods, Other
|
$47.95
|
+1.94
4.22% |
$49.50
|
2,002,398
232.08% of 50 DAV
50 DAV is 862,800
|
$46.33
3.50%
|
8/10/2010
|
$45.54
|
PP = $42.69
|
|
MB = $44.82
|
Most Recent Note - 8/30/2010 12:39:10 PM
G - Trading up considerably today for a new high, posting its 7th consecutive gain with ever increasing volume, reacting positively to news its board approved a stock buyback plan.
>>> The latest Featured Stock Update with an annotated graph appeared on 8/11/2010. Click here.
View all notes |
Alert me of new notes |
CANSLIM.net Company Profile |
SEC |
Zacks Reports |
StockTalk |
News |
Chart |
Request a new note
C
A N
S L
I M
|
GMCR
-
NASDAQ
Green Mtn Coffee Roastrs
FOOD and BEVERAGE - Processed and Packaged Goods
|
$30.18
|
-0.40
-1.31% |
$30.60
|
1,478,478
64.81% of 50 DAV
50 DAV is 2,281,400
|
$33.98
-11.18%
|
8/17/2010
|
$33.62
|
PP = $33.30
|
|
MB = $34.97
|
Most Recent Note - 8/27/2010 4:50:09 PM
G - Small gain today on light volume halted its slide near its 50 DMA line. Possible handle may be forming after the previously noted cup shaped pattern.
>>> The latest Featured Stock Update with an annotated graph appeared on 8/17/2010. Click here.
View all notes |
Alert me of new notes |
CANSLIM.net Company Profile |
SEC |
Zacks Reports |
StockTalk |
News |
Chart |
Request a new note
C
A N
S L
I M
|
HS
-
NYSE
Healthspring Inc
HEALTH SERVICES - Health Care Plans
|
$20.35
|
-0.15
-0.73% |
$20.66
|
997,500
176.96% of 50 DAV
50 DAV is 563,700
|
$20.52
-0.83%
|
8/27/2010
|
$19.91
|
PP = $19.75
|
|
MB = $20.74
|
Most Recent Note - 8/30/2010 12:42:00 PM
Y - Pulling back today following a considerable gap up gain on 8/27/10 after announcing news that it will acquire Bravo Health for $545 million. Rallied from a short flat base as it was featured in the mid-day report (read here) and then went on to close strong and hit a new 52-week high with more than 3 times average volume behind its gain. It found support above its 50 and 200 DMA lines during its light volume pullback following an earlier (7/29/10) breakout. The M criteria remains a concern until a follow-through day emerges. Quarterly and annual earnings comparisons have showed strong +25%. or greater increases (good C and A criteria) history.
>>> The latest Featured Stock Update with an annotated graph appeared on 8/27/2010. Click here.
View all notes |
Alert me of new notes |
CANSLIM.net Company Profile |
SEC |
Zacks Reports |
StockTalk |
News |
Chart |
Request a new note
C
A N
S L
I M
|
Symbol/Exchange
Company Name
Industry Group |
PRICE |
CHANGE
(%Change) |
Day High |
Volume
(% DAV)
(% 50 day avg vol) |
52 Wk Hi
% From Hi |
Featured
Date |
Price
Featured |
Pivot Featured |
|
Max Buy |
MELI
-
NASDAQ
Mercadolibre Inc
INTERNET - Internet Software and; Services
|
$64.74
|
-1.64
-2.47% |
$66.65
|
275,182
26.49% of 50 DAV
50 DAV is 1,038,800
|
$70.95
-8.75%
|
5/13/2010
|
$54.21
|
PP = $55.85
|
|
MB = $58.64
|
Most Recent Note - 8/30/2010 3:39:14 PM
G - Consolidating quietly well above prior highs in the $62 area and its 50 DMA line defining chart support. Recently noted - "The pullback may be offering investors a secondary buy point, however weakened market conditions (M criteria) are a concern now arguing against new buying effort until a new follow-through day occurs."
>>> The latest Featured Stock Update with an annotated graph appeared on 8/26/2010. Click here.
View all notes |
Alert me of new notes |
CANSLIM.net Company Profile |
SEC |
Zacks Reports |
StockTalk |
News |
Chart |
Request a new note
C
A N
S L
I M
|
MRX
-
NYSE
Medicis Pharmaceut Cl A
DRUGS - Biotechnology
|
$27.23
|
+0.30
1.11% |
$27.80
|
1,349,074
116.98% of 50 DAV
50 DAV is 1,153,300
|
$28.15
-3.27%
|
8/12/2010
|
$26.88
|
PP = $26.71
|
|
MB = $28.05
|
Most Recent Note - 8/30/2010 1:07:49 PM
Y - Rallying today near its 52-week high with little resistance remaining due to overhead supply. The high-ranked Medical - Ethical Drugs firm found support recently while consolidating near prior chart highs.
>>> The latest Featured Stock Update with an annotated graph appeared on 8/12/2010. Click here.
View all notes |
Alert me of new notes |
CANSLIM.net Company Profile |
SEC |
Zacks Reports |
StockTalk |
News |
Chart |
Request a new note
C
A N
S L
I M
|
MWIV
-
NASDAQ
M W I Veterinary Supply
HEALTH SERVICES - Medical Instruments and; Supplies
|
$52.84
|
-1.14
-2.11% |
$54.40
|
24,150
30.92% of 50 DAV
50 DAV is 78,100
|
$55.46
-4.72%
|
7/29/2010
|
$52.05
|
PP = $52.09
|
|
MB = $54.69
|
Most Recent Note - 8/30/2010 5:35:40 PM
Y - Negatively reversed today after a small gap up, closing at the session low. Recent lows in the $46 area define an important chart support level.
>>> The latest Featured Stock Update with an annotated graph appeared on 7/30/2010. Click here.
View all notes |
Alert me of new notes |
CANSLIM.net Company Profile |
SEC |
Zacks Reports |
StockTalk |
News |
Chart |
Request a new note
C
A N
S L
I M
|
NEM
-
NYSE
Newmont Mining Corp
METALS and MINING - Gold
|
$59.92
|
-0.03
-0.05% |
$60.54
|
3,880,550
51.80% of 50 DAV
50 DAV is 7,491,100
|
$63.38
-5.46%
|
6/22/2010
|
$59.60
|
PP = $59.67
|
|
MB = $62.65
|
Most Recent Note - 8/27/2010 6:05:35 PM
G - Closed at its best level in 6 weeks as a 3rd consecutive gain today with light volume helped it rise further above its 50 DMA line. Leadership in the Mining - Gold/Silver/Gems group (L criteria) is a nice reassurance.
>>> The latest Featured Stock Update with an annotated graph appeared on 8/6/2010. Click here.
View all notes |
Alert me of new notes |
CANSLIM.net Company Profile |
SEC |
Zacks Reports |
StockTalk |
News |
Chart |
Request a new note
C
A N
S L
I M
|
NEOG
-
NASDAQ
Neogen Corp
DRUGS - Diagnostic Substances
|
$28.58
|
-0.90
-3.05% |
$29.37
|
81,404
97.61% of 50 DAV
50 DAV is 83,400
|
$30.39
-5.96%
|
7/22/2010
|
$27.19
|
PP = $27.87
|
|
MB = $29.26
|
Most Recent Note - 8/30/2010 3:32:01 PM
Y- Consolidating -5% off its all-time high with volume cooling today. Recently rallied up from its 50 DMA line and prior highs in the $27 area defining important technical support.
>>> The latest Featured Stock Update with an annotated graph appeared on 8/20/2010. Click here.
View all notes |
Alert me of new notes |
CANSLIM.net Company Profile |
SEC |
Zacks Reports |
StockTalk |
News |
Chart |
Request a new note
C
A N
S L
I M
|
Symbol/Exchange
Company Name
Industry Group |
PRICE |
CHANGE
(%Change) |
Day High |
Volume
(% DAV)
(% 50 day avg vol) |
52 Wk Hi
% From Hi |
Featured
Date |
Price
Featured |
Pivot Featured |
|
Max Buy |
NFLX
-
NASDAQ
Netflix Inc
SPECIALTY RETAIL - Music and Video Stores
|
$123.10
|
-3.00
-2.38% |
$125.70
|
2,663,200
60.61% of 50 DAV
50 DAV is 4,393,800
|
$140.90
-12.63%
|
8/10/2010
|
$124.05
|
PP = $124.00
|
|
MB = $130.20
|
Most Recent Note - 8/30/2010 3:33:06 PM
Y- Holding its ground, consolidating near its prior high of $124 noted as an important support level to watch. Color code was changed to yellow while finding recent support near its pivot point.
>>> The latest Featured Stock Update with an annotated graph appeared on 8/10/2010. Click here.
View all notes |
Alert me of new notes |
CANSLIM.net Company Profile |
SEC |
Zacks Reports |
StockTalk |
News |
Chart |
Request a new note
C
A N
S L
I M
|
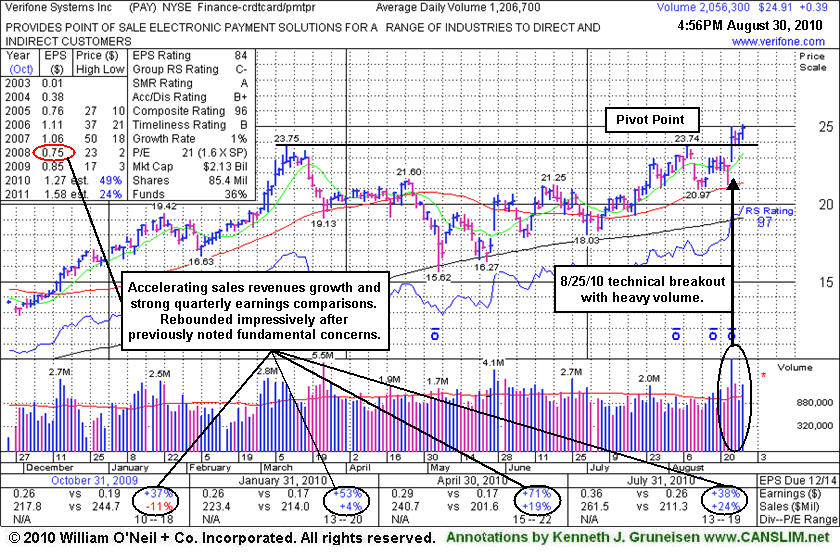
PAY
-
NYSE
Verifone Systems Inc
COMPUTER HARDWARE - Transaction Automation Systems
|
$24.91
|
+0.39
1.59% |
$25.12
|
2,058,219
170.57% of 50 DAV
50 DAV is 1,206,700
|
$25.04
-0.51%
|
8/25/2010
|
$24.30
|
PP = $23.74
|
|
MB = $24.93
|
Most Recent Note - 8/30/2010 3:36:29 PM
G - Hit another new 52-week high today and its color code is changed to green after inching above its "max buy" level. Blasted higher on 8/25/10 following better than expected results, noted in the mid-day report (read here) while then rising from a cup-with-handle base - "Long ago, based on disappointing fundamental news and very weak technical action, it was dropped from the Featured Stocks list on 12/3/2007 as it gapped down for a considerable loss after the company said it would restate its earnings for the past three quarters, with the added warning that revelations of deeper problems may follow. It has rebounded impressively and is now clear of overhead supply after a powerful technical breakout with 6 times average volume, however the M criteria is now arguing against new buying efforts until a new follow-through day occurs from at least one of the major averages."
>>> The latest Featured Stock Update with an annotated graph appeared on 8/30/2010. Click here.
View all notes |
Alert me of new notes |
CANSLIM.net Company Profile |
SEC |
Zacks Reports |
StockTalk |
News |
Chart |
Request a new note
C
A N
S L
I M
|
ROVI
-
NASDAQ
Rovi Corp
COMPUTER SOFTWARE andamp; SERVICES - Security Software andamp; Services
|
$42.05
|
-0.51
-1.20% |
$42.93
|
406,740
35.86% of 50 DAV
50 DAV is 1,134,400
|
$44.96
-6.47%
|
6/3/2010
|
$38.70
|
PP = $40.16
|
|
MB = $42.17
|
Most Recent Note - 8/27/2010 6:18:01 PM
G - Building a base-on-base type pattern. Testing support at its 50 DMA line this week, while prior highs in the $40 area define the next chart support.
>>> The latest Featured Stock Update with an annotated graph appeared on 8/24/2010. Click here.
View all notes |
Alert me of new notes |
CANSLIM.net Company Profile |
SEC |
Zacks Reports |
StockTalk |
News |
Chart |
Request a new note
C
A N
S L
I M
|
SHOO
-
NASDAQ
Steven Madden Limited
CONSUMER NON-DURABLES - Textile - Apparel Footwear
|
$34.05
|
-1.84
-5.13% |
$36.00
|
358,097
83.28% of 50 DAV
50 DAV is 430,000
|
$40.98
-16.91%
|
8/5/2010
|
$39.55
|
PP = $41.08
|
|
MB = $43.13
|
Most Recent Note - 8/30/2010 3:23:38 PM
G - Considerable loss today, violating its 50 DMA line and recent lows, raising concerns. The next support is at its 200 DMA line and prior chart lows in the $30 area.
>>> The latest Featured Stock Update with an annotated graph appeared on 8/5/2010. Click here.
View all notes |
Alert me of new notes |
CANSLIM.net Company Profile |
SEC |
Zacks Reports |
StockTalk |
News |
Chart |
Request a new note
C
A N
S L
I M
|
SLW
-
NYSE
Silver Wheaton Corp
METALS and; MINING - Silver
|
$22.86
|
+0.06
0.26% |
$23.18
|
4,509,121
97.73% of 50 DAV
50 DAV is 4,613,700
|
$22.84
0.09%
|
8/25/2010
|
$21.40
|
PP = $21.99
|
|
MB = $23.09
|
Most Recent Note - 8/30/2010 1:13:33 PM
Y - Hit another new all-time high today, trading near its "max buy" level. Its gain on 8/26/10 with +69% above average volume helped it trigger a technical buy signal and close above the pivot point cited in the 8/25/10 mid-day report. The M criteria is a concern until a follow-through day confirms a new rally.
>>> The latest Featured Stock Update with an annotated graph appeared on 8/25/2010. Click here.
View all notes |
Alert me of new notes |
CANSLIM.net Company Profile |
SEC |
Zacks Reports |
StockTalk |
News |
Chart |
Request a new note
C
A N
S L
I M
|
Symbol/Exchange
Company Name
Industry Group |
PRICE |
CHANGE
(%Change) |
Day High |
Volume
(% DAV)
(% 50 day avg vol) |
52 Wk Hi
% From Hi |
Featured
Date |
Price
Featured |
Pivot Featured |
|
Max Buy |
VIT
-
NYSE
Vanceinfo Tech Inc Ads
COMPUTER SOFTWARE and SERVICES - Business Software and Services
|
$28.49
|
-0.06
-0.21% |
$28.79
|
460,505
81.98% of 50 DAV
50 DAV is 561,700
|
$28.68
-0.66%
|
7/8/2010
|
$25.20
|
PP = $26.58
|
|
MB = $27.91
|
Most Recent Note - 8/27/2010 6:21:51 PM
G - Gain today with +50% above average volume helped it rally to a new all-time high and close above its "max buy" level. Color code is changed to green. No resistance is remaining due to overhead supply.
>>> The latest Featured Stock Update with an annotated graph appeared on 7/26/2010. Click here.
View all notes |
Alert me of new notes |
CANSLIM.net Company Profile |
SEC |
Zacks Reports |
StockTalk |
News |
Chart |
Request a new note
C
A N
S L
I M
|
WCRX
-
NASDAQ
Warner Chilcott Plc
DRUGS - Drug Manufacturers - Other
|
$28.62
|
+0.04
0.14% |
$29.15
|
1,989,093
115.58% of 50 DAV
50 DAV is 1,720,900
|
$30.57
-6.38%
|
8/23/2010
|
$29.54
|
PP = $29.34
|
|
MB = $30.81
|
Most Recent Note - 8/27/2010 6:24:02 PM
Y - Posted a gain today with heavy volume, yet it ended the session still below its pivot point after 2 prior losses on lighter volume. It was featured in yellow in the mid-day report on 8/23/10 (read here), rising from a cup shaped base.
>>> The latest Featured Stock Update with an annotated graph appeared on 8/23/2010. Click here.
View all notes |
Alert me of new notes |
CANSLIM.net Company Profile |
SEC |
Zacks Reports |
StockTalk |
News |
Chart |
Request a new note
C
A N
S L
I M
|