You are not logged in.
This means you
CAN ONLY VIEW reports that were published prior to Monday, April 14, 2025.
You
MUST UPGRADE YOUR MEMBERSHIP if you want to see any current reports.
AFTER MARKET UPDATE - TUESDAY, AUGUST 27TH, 2013
Previous After Market Report Next After Market Report >>>
|
|
|
|
DOW |
-170.33 |
14,776.13 |
-1.14% |
|
Volume |
683,190,800 |
+25% |
|
Volume |
1,590,749,680 |
+17% |
|
NASDAQ |
-79.05 |
3,578.52 |
-2.16% |
|
Advancers |
605 |
19% |
|
Advancers |
324 |
12% |
|
S&P 500 |
-26.30 |
1,630.48 |
-1.59% |
|
Decliners |
2,463 |
78% |
|
Decliners |
2,228 |
85% |
|
Russell 2000 |
-24.98 |
1,013.49 |
-2.41% |
|
52 Wk Highs |
14 |
|
|
52 Wk Highs |
29 |
|
|
S&P 600 |
-13.18 |
574.93 |
-2.24% |
|
52 Wk Lows |
80 |
|
|
52 Wk Lows |
31 |
|
|
 |
Major Averages Encounter More Damaging Distributional Pressure
Kenneth J. Gruneisen - Passed the CAN SLIM® Master's Exam
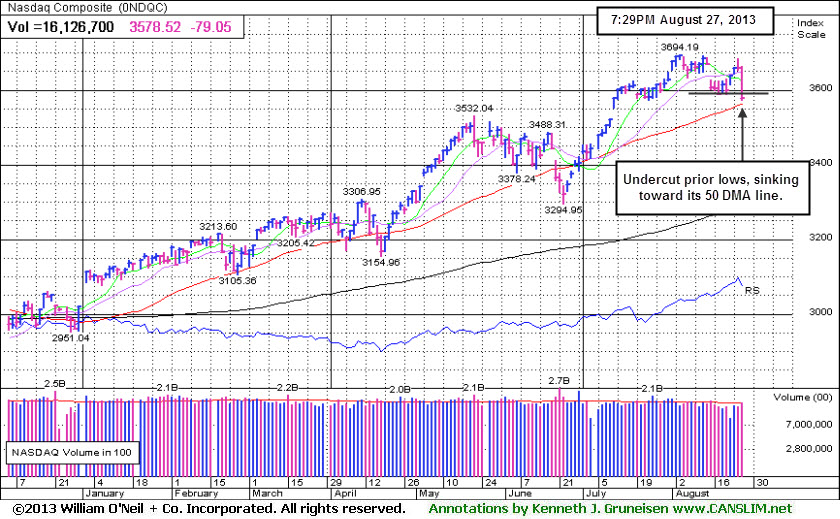
The major averages extended losses into the closing bell to finish firmly in negative territory on Tuesday. The volume totals were reported higher than the prior session totals on the NYSE and on the Nasdaq exchange, indicating an increase in institutional selling pressure. Breadth was solidly negative as decliners led advancers by a 4-1 margin on the NYSE and by a 7-1 margin on the Nasdaq exchange. There were only 3 high-ranked companies from the CANSLIM.net Leaders List that made new 52-week highs and appeared on the CANSLIM.net BreakOuts Page, down abruptly from a total of 39 stocks on the prior session. The list of stocks hitting new 52-week lows outnumbered new 52-week highs on the NYSE and on the Nasdaq exchange. There were losses for all 16 high-ranked companies currently included on the Featured Stocks Page. The market (M criteria) clearly signaled that the major averages are in a "correction" based on recent technical damage. Individual holdings should be closely monitored for any worrisome technical sell signals. This is precisely how the fact-based system helps investors avoid serious setbacks and raise cash levels during market downdrafts. Historic studies suggest that no new buying efforts should be made during market corrections.
The major averages retreated for a second day amid the building tension of possible military action in Syria over the use of chemical weapons. A renewed debate in Washington over the debt ceiling and speculation surrounding the Fed tapering its asset purchases also provided headwinds to the market. The heightened uncertainty in the Middle East overshadowed the latest economic data. Before the open, a report showed home prices were up 12.1% in June versus a year ago. A separate release revealed consumer confidence unexpectedly increased in August.
All 10 sectors in the S&P 500 were down today. Financials including Morgan Stanley (MS -3.53%), technology firms like Apple Inc (AAPL -2.86%), and industrials including FedEx Corp (FDX -3.20%) slumped amid widespread losses. Utilities were the best performing sector on the session as NextEra Energy (NEE +0.66%) was among several that gained ground.
Treasuries rallied to extend their winning streak to a fourth day. The price of the 10-year note gained 20/32 to yield 2.71%.
Stay familiar with companies listed on the CANSLIM.net Featured Stocks Page - a page showing the most action-worthy candidates' latest notes and links to additional resources including detailed analysis with data-packed graphs which are annotated by a Certified expert. The Premium Member Homepage - includes "dynamic archives" to all prior pay reports published. Watch for an announcement via email concerning the next WEBCAST.
PICTURED: The Nasdaq Composite Index slumped below prior lows toward its 50-day moving average (DMA) line.
|
 Kenneth J. Gruneisen started out as a licensed stockbroker in August 1987, a couple of months prior to the historic stock market crash that took the Dow Jones Industrial Average down -22.6% in a single day. He has published daily fact-based fundamental and technical analysis on high-ranked stocks online for two decades. Through FACTBASEDINVESTING.COM, Kenneth provides educational articles, news, market commentary, and other information regarding proven investment systems that work in good times and bad.
Comments contained in the body of this report are technical opinions only and are not necessarily those of Gruneisen Growth Corp. The material herein has been obtained from sources believed to be reliable and accurate, however, its accuracy and completeness cannot be guaranteed. Our firm, employees, and customers may effect transactions, including transactions contrary to any recommendation herein, or have positions in the securities mentioned herein or options with respect thereto. Any recommendation contained in this report may not be suitable for all investors and it is not to be deemed an offer or solicitation on our part with respect to the purchase or sale of any securities. |
|
 |
Widespread Losses Dragged All Groups Lower
Kenneth J. Gruneisen - Passed the CAN SLIM® Master's Exam
The Gold & Silver Index ($XAU -4.42%) was a standout decliner on Tuesday's widely negative session. The tech sector saw unanimous losses from the Biotechnology Index ($BTK -3.52%), Networking Index ($NWX -2.73%), Semiconductor Index ($SOX -2.53%), and the Internet Index ($IIX -2.12%). Influential financial shares also created a drag on the major averages as the Bank Index ($BKX -3.12%) and the Broker/Dealer Index ($XBD -2.47%) both fell. The Retail Index ($RLX -1.79%) and the Healthcare Index ($HMO -1.79%) lost ground. Energy-related shares fared better than most groups although the Oil Services Index ($OSX -1.11%) and Integrated Oil Index ($XOI -0.35%) also ended the session with small losses.
Charts courtesy www.stockcharts.com
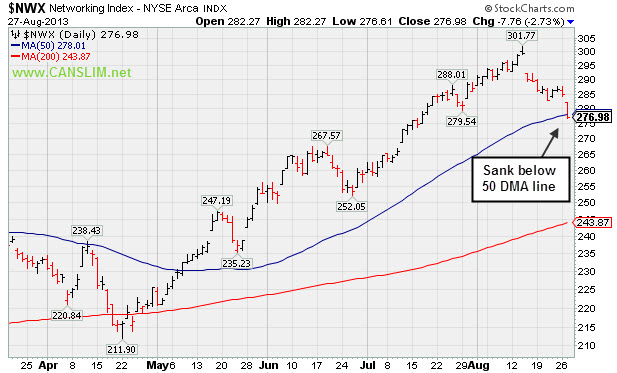
PICTURED: The Networking Index ($NWX -2.73%) sank below its 50-day moving average (DMA) line.
| Oil Services |
$OSX |
258.50 |
-2.91 |
-1.11% |
+17.41% |
| Healthcare |
$HMO |
3,349.85 |
-60.94 |
-1.79% |
+33.24% |
| Integrated Oil |
$XOI |
1,363.45 |
-4.85 |
-0.35% |
+9.79% |
| Semiconductor |
$SOX |
451.22 |
-11.70 |
-2.53% |
+17.49% |
| Networking |
$NWX |
276.98 |
-7.76 |
-2.73% |
+22.26% |
| Internet |
$IIX |
392.42 |
-8.51 |
-2.12% |
+20.01% |
| Broker/Dealer |
$XBD |
131.47 |
-3.33 |
-2.47% |
+39.38% |
| Retail |
$RLX |
807.70 |
-14.68 |
-1.79% |
+23.68% |
| Gold & Silver |
$XAU |
107.31 |
-4.96 |
-4.42% |
-35.20% |
| Bank |
$BKX |
62.37 |
-2.01 |
-3.12% |
+21.63% |
| Biotech |
$BTK |
2,041.43 |
-74.51 |
-3.52% |
+31.96% |
|
|
|
 |
Pulled Back on Lighter Volume
Kenneth J. Gruneisen - Passed the CAN SLIM® Master's Exam
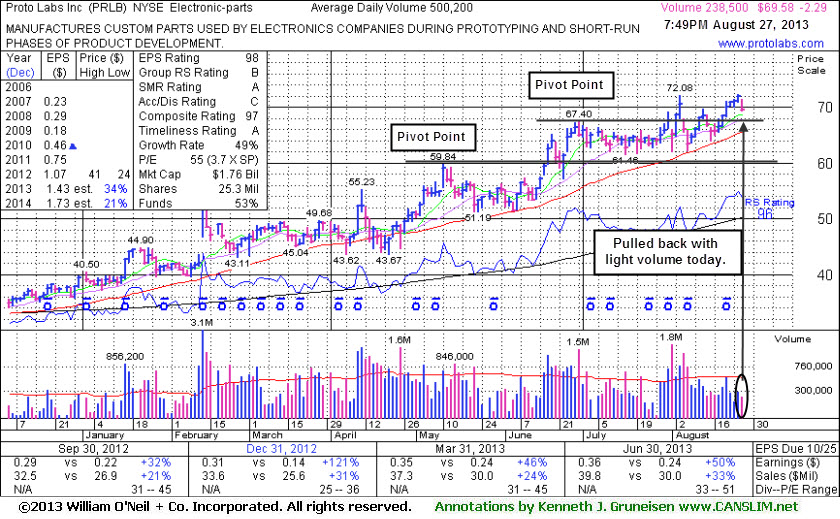
Proto Labs Inc (PRLB -$2.29 or -3.19% to $69.58) pulled back with light volume today. The high-ranked Electronic - Parts firm was last shown in this FSU section with an annotated graph on 8/05/13 under the headline, "Follow Through Gains Backed By Volume", as it rallied with +77% above average volume and powered further above its pivot point for yet another new 52-week high.
Its 50-day moving average (DMA) line defines important support just below its prior highs in the $67 area. Disciplined investors always limit losses by selling if any stock falls more than -7% from their purchase price. Its small supply of only 19 million shares (S criteria) in the publicly traded float is ideal, yet it can contribute to greater price volatility in the event of institutionaal buying or selling.
PRLB was first featured in yellow in the 4/10/13 mid-day report (read here). Earnings were +50% on +33% sales revenues for the Jun '13 quarter, continuing its strong growth trend satisfying the C criteria and helping it earn a very high 98 Earnings Per Share rank. The number of top-rated funds owning its shares rose from 131 in Jun '12 to 228 in Jun '13, a reassuring trend concerning the I criteria.
|
|
|
Color Codes Explained :
Y - Better candidates highlighted by our
staff of experts.
G - Previously featured
in past reports as yellow but may no longer be buyable under the
guidelines.
***Last / Change / Volume data in this table is the closing quote data***
Symbol/Exchange
Company Name
Industry Group |
PRICE |
CHANGE
(%Change) |
Day High |
Volume
(% DAV)
(% 50 day avg vol) |
52 Wk Hi
% From Hi |
Featured
Date |
Price
Featured |
Pivot Featured |
|
Max Buy |
BITA
-
NYSE
Bitauto Hldgs Ltd Ads
INTERNET - Internet Information Providers
|
$14.25
|
-0.86
-5.69% |
$15.08
|
323,873
146.55% of 50 DAV
50 DAV is 221,000
|
$18.10
-21.27%
|
8/7/2013
|
$12.01
|
PP = $13.30
|
|
MB = $13.97
|
 Most Recent Note - 8/27/2013 7:41:23 PM
G - Down considerably today with above average volume. Still consolidating well above its 50 DMA line and prior highs. Disciplined investors always limit losses if any stock falls more than -7-8% from their purchase price.
>>> The latest Featured Stock Update with an annotated graph appeared on 8/7/2013. Click here.
View all notes |
Alert me of new notes |
CANSLIM.net Company Profile |
SEC |
Zacks Reports |
StockTalk |
News |
Chart |
Request a new note
C
A N
S L
I M


|
CELG
-
NASDAQ
Celgene Corp
DRUGS - Drug Manufacturers - Major
|
$136.96
|
-4.20
-2.98% |
$139.93
|
2,650,926
105.58% of 50 DAV
50 DAV is 2,510,900
|
$149.92
-8.64%
|
7/11/2013
|
$133.25
|
PP = $131.92
|
|
MB = $138.52
|
Most Recent Note - 8/27/2013 7:53:51 PM
Y - Down today amid widespread market weakness (M criteria). Still consolidating above prior highs in the $131 area and above its 50 DMA line, defining important chart support.
>>> The latest Featured Stock Update with an annotated graph appeared on 8/21/2013. Click here.
View all notes |
Alert me of new notes |
CANSLIM.net Company Profile |
SEC |
Zacks Reports |
StockTalk |
News |
Chart |
Request a new note
C
A N
S L
I M
|
FLT
-
NYSE
Fleetcor Technologies
DIVERSIFIED SERVICES - Business/Management Services
|
$103.17
|
-1.53
-1.46% |
$104.00
|
808,602
115.68% of 50 DAV
50 DAV is 699,000
|
$108.38
-4.81%
|
8/19/2013
|
$99.01
|
PP = $100.97
|
|
MB = $106.02
|
Most Recent Note - 8/26/2013 8:16:45 PM
Y- Rallied with above average volume again today for a new high. Rising from an advanced "3-weeks tight" base, albeit a riskier "late stage" base. Keep in mind the M criteria argues against new buying efforts until a new confirmed rally.
>>> The latest Featured Stock Update with an annotated graph appeared on 8/12/2013. Click here.
View all notes |
Alert me of new notes |
CANSLIM.net Company Profile |
SEC |
Zacks Reports |
StockTalk |
News |
Chart |
Request a new note
C
A N
S L
I M
|
GNRC
-
NYSE
Generac Hldgs Inc
CONSUMER DURABLES - Electronic Equipment
|
$41.10
|
-1.16
-2.74% |
$42.16
|
578,986
56.01% of 50 DAV
50 DAV is 1,033,800
|
$44.30
-7.22%
|
7/30/2013
|
$42.60
|
PP = $42.10
|
|
MB = $44.21
|
Most Recent Note - 8/22/2013 5:46:33 PM
Y - Holding its ground stubbornly after it recently rallied from an advanced "3-weeks tight" base and priced a Secondary Offering. Disciplined investors always limit losses by selling if any stock falls more than -7% from its purchase price. See the latest FSU analysis for more details and a new annotated graph.
>>> The latest Featured Stock Update with an annotated graph appeared on 8/22/2013. Click here.
View all notes |
Alert me of new notes |
CANSLIM.net Company Profile |
SEC |
Zacks Reports |
StockTalk |
News |
Chart |
Request a new note
C
A N
S L
I M
|
KORS
-
NYSE
Michael Kors Hldgs Ltd
RETAIL - Apparel Stores
|
$71.23
|
-1.34
-1.85% |
$72.77
|
3,161,914
93.48% of 50 DAV
50 DAV is 3,382,400
|
$73.59
-3.21%
|
8/6/2013
|
$69.66
|
PP = $66.28
|
|
MB = $69.59
|
Most Recent Note - 8/23/2013 6:50:01 PM
G - Finished at a new high close today with a 4th consecutive gain on below average volume. Prior highs in the $66 area define initial support to watch on pullbacks.
>>> The latest Featured Stock Update with an annotated graph appeared on 8/6/2013. Click here.
View all notes |
Alert me of new notes |
CANSLIM.net Company Profile |
SEC |
Zacks Reports |
StockTalk |
News |
Chart |
Request a new note
C
A N
S L
I M
|
Symbol/Exchange
Company Name
Industry Group |
PRICE |
CHANGE
(%Change) |
Day High |
Volume
(% DAV)
(% 50 day avg vol) |
52 Wk Hi
% From Hi |
Featured
Date |
Price
Featured |
Pivot Featured |
|
Max Buy |
LOPE
-
NASDAQ
Grand Canyon Education
DIVERSIFIED SERVICES - Education and; Training Services
|
$34.51
|
-0.14
-0.40% |
$34.60
|
322,171
72.38% of 50 DAV
50 DAV is 445,100
|
$37.17
-7.16%
|
6/19/2013
|
$31.47
|
PP = $34.17
|
|
MB = $35.88
|
Most Recent Note - 8/21/2013 9:47:50 PM
G - Color code is changed to green as it has slumped below its 50 DMA line. Recently reported earnings +15% on +19% sales for the Jun '13 quarter, below the +25% minimum earnings guideline (C criteria), raising fundamental concerns.
>>> The latest Featured Stock Update with an annotated graph appeared on 8/14/2013. Click here.
View all notes |
Alert me of new notes |
CANSLIM.net Company Profile |
SEC |
Zacks Reports |
StockTalk |
News |
Chart |
Request a new note
C
A N
S L
I M
|
PCLN
-
NASDAQ
Priceline.Com Inc
INTERNET - Internet Software and Services
|
$935.60
|
-13.94
-1.47% |
$944.27
|
487,238
69.65% of 50 DAV
50 DAV is 699,600
|
$994.98
-5.97%
|
7/8/2013
|
$878.28
|
PP = $847.43
|
|
MB = $889.80
|
Most Recent Note - 8/23/2013 6:51:58 PM
G - Posted a 3rd consecutive gain on light volume, consolidating above prior highs, extended from any sound base. Reported earnings +24% on +27% sales revenues for the Jun '13 quarter, just under the +25% minimum earnings guideline (C criteria).
>>> The latest Featured Stock Update with an annotated graph appeared on 8/19/2013. Click here.
View all notes |
Alert me of new notes |
CANSLIM.net Company Profile |
SEC |
Zacks Reports |
StockTalk |
News |
Chart |
Request a new note
C
A N
S L
I M
|
PRAA
-
NASDAQ
Portfolio Recovery Assoc
DIVERSIFIED SERVICES - Business/Management Services
|
$53.00
|
-2.26
-4.09% |
$55.43
|
327,153
62.21% of 50 DAV
50 DAV is 525,900
|
$57.57
-7.94%
|
7/31/2013
|
$51.43
|
PP = $54.72
|
|
MB = $57.46
|
Most Recent Note - 8/21/2013 9:53:49 PM
Y - Holding its ground near prior highs with volume totals cooling in recent weeks. Any slump below its old high close ($53.86 on 6/17/13) would raise greater concerns as it would completely negate the recent technical breakout.
>>> The latest Featured Stock Update with an annotated graph appeared on 8/2/2013. Click here.
View all notes |
Alert me of new notes |
CANSLIM.net Company Profile |
SEC |
Zacks Reports |
StockTalk |
News |
Chart |
Request a new note
C
A N
S L
I M
|
PRLB
-
NYSE
Proto Labs Inc
MANUFACTURING - Small Tools and Accessories
|
$69.58
|
-2.29
-3.19% |
$71.46
|
239,068
47.79% of 50 DAV
50 DAV is 500,200
|
$72.25
-3.70%
|
7/29/2013
|
$64.86
|
PP = $67.50
|
|
MB = $70.88
|
Most Recent Note - 8/27/2013 8:10:44 PM
Y - Pulled back on light volume today, consolidating above support at its 50 DMA line. See the latest FSU analysis for more details and a new annotated graph.
>>> The latest Featured Stock Update with an annotated graph appeared on 8/27/2013. Click here.
View all notes |
Alert me of new notes |
CANSLIM.net Company Profile |
SEC |
Zacks Reports |
StockTalk |
News |
Chart |
Request a new note
C
A N
S L
I M
|
QCOR
-
NASDAQ
Questcor Pharmaceuticals
DRUGS - Biotechnology
|
$68.49
|
-3.85
-5.32% |
$73.12
|
1,707,782
99.35% of 50 DAV
50 DAV is 1,719,000
|
$74.76
-8.39%
|
7/31/2013
|
$66.46
|
PP = $59.01
|
|
MB = $61.96
|
Most Recent Note - 8/27/2013 8:12:17 PM
G - Down today amid a widely negative market (M criteria). It is extended beyond its "max buy" level.
>>> The latest Featured Stock Update with an annotated graph appeared on 8/26/2013. Click here.
View all notes |
Alert me of new notes |
CANSLIM.net Company Profile |
SEC |
Zacks Reports |
StockTalk |
News |
Chart |
Request a new note
C
A N
S L
I M
|
Symbol/Exchange
Company Name
Industry Group |
PRICE |
CHANGE
(%Change) |
Day High |
Volume
(% DAV)
(% 50 day avg vol) |
52 Wk Hi
% From Hi |
Featured
Date |
Price
Featured |
Pivot Featured |
|
Max Buy |
SFUN
-
NYSE
Soufun Hldgs Ltd Ads A
INTERNET - Internet Information Providers
|
$36.83
|
-1.60
-4.16% |
$38.62
|
348,985
61.41% of 50 DAV
50 DAV is 568,300
|
$42.15
-12.62%
|
7/16/2013
|
$29.54
|
PP = $27.90
|
|
MB = $29.30
|
Most Recent Note - 8/27/2013 8:13:48 PM
G - Down considerably today amid widespread market (M criteria) weakness. Prior reports cautioned - "Disciplined investors avoid chasing stocks too extended from sound bases."
>>> The latest Featured Stock Update with an annotated graph appeared on 8/8/2013. Click here.
View all notes |
Alert me of new notes |
CANSLIM.net Company Profile |
SEC |
Zacks Reports |
StockTalk |
News |
Chart |
Request a new note
C
A N
S L
I M
|
SSNC
-
NASDAQ
S S & C Technologies
COMPUTER SOFTWARE and SERVICES - Application Software
|
$35.59
|
-0.72
-1.98% |
$36.23
|
287,245
67.92% of 50 DAV
50 DAV is 422,900
|
$38.80
-8.27%
|
7/11/2013
|
$35.80
|
PP = $34.54
|
|
MB = $36.27
|
Most Recent Note - 8/23/2013 6:53:34 PM
Y - Recently consolidating above its 50 DMA line and prior highs in the $34 area defining important support. Disciplined investors always limit losses if ever any stock falls more than -7% from their purchase price.
>>> The latest Featured Stock Update with an annotated graph appeared on 8/9/2013. Click here.
View all notes |
Alert me of new notes |
CANSLIM.net Company Profile |
SEC |
Zacks Reports |
StockTalk |
News |
Chart |
Request a new note
C
A N
S L
I M
|
SSYS
-
NASDAQ
Stratasys Ltd
COMPUTER HARDWARE - Computer Peripherals
|
$104.24
|
-5.80
-5.27% |
$108.64
|
1,290,351
154.42% of 50 DAV
50 DAV is 835,600
|
$113.49
-8.15%
|
7/8/2013
|
$91.44
|
PP = $95.00
|
|
MB = $99.75
|
Most Recent Note - 8/27/2013 8:15:20 PM
G - Down considerably today on higher volume amid widespread market weakness. It is extended from its prior base. Prior highs in the $96 area define initial support to watch on pullbacks.
>>> The latest Featured Stock Update with an annotated graph appeared on 8/16/2013. Click here.
View all notes |
Alert me of new notes |
CANSLIM.net Company Profile |
SEC |
Zacks Reports |
StockTalk |
News |
Chart |
Request a new note
C
A N
S L
I M
|
STMP
-
NASDAQ
Stamps.Com Inc
INTERNET - Internet Software and Services
|
$40.65
|
-1.15
-2.75% |
$41.78
|
96,433
72.51% of 50 DAV
50 DAV is 133,000
|
$46.47
-12.52%
|
7/31/2013
|
$40.00
|
PP = $42.98
|
|
MB = $45.13
|
Most Recent Note - 8/23/2013 6:44:17 PM
Y - Recently found support at its 50 DMA line. See the latest FSU analysis for more details and a new annotated graph.
>>> The latest Featured Stock Update with an annotated graph appeared on 8/23/2013. Click here.
View all notes |
Alert me of new notes |
CANSLIM.net Company Profile |
SEC |
Zacks Reports |
StockTalk |
News |
Chart |
Request a new note
C
A N
S L
I M
|
VRX
-
NYSE
Valeant Pharmaceuticals
DRUGS - Drug Manufacturers - Other
|
$95.80
|
-3.80
-3.82% |
$98.90
|
1,638,951
102.13% of 50 DAV
50 DAV is 1,604,700
|
$105.40
-9.11%
|
4/30/2013
|
$60.24
|
PP = $76.66
|
|
MB = $80.49
|
Most Recent Note - 8/23/2013 6:48:24 PM
G- Holding its ground -5.6% off its 52-week high. Reported earnings +33% on +34% sales revenues for the Jun '13 quarter, above the +25% minimum earnings guideline (C criteria).
>>> The latest Featured Stock Update with an annotated graph appeared on 8/15/2013. Click here.
View all notes |
Alert me of new notes |
CANSLIM.net Company Profile |
SEC |
Zacks Reports |
StockTalk |
News |
Chart |
Request a new note
C
A N
S L
I M
|
Symbol/Exchange
Company Name
Industry Group |
PRICE |
CHANGE
(%Change) |
Day High |
Volume
(% DAV)
(% 50 day avg vol) |
52 Wk Hi
% From Hi |
Featured
Date |
Price
Featured |
Pivot Featured |
|
Max Buy |
YNDX
-
NASDAQ
Yandex N V Class A
INTERNET - Internet Information Providers
|
$32.14
|
-1.10
-3.31% |
$32.97
|
1,807,184
74.80% of 50 DAV
50 DAV is 2,415,900
|
$34.79
-7.62%
|
7/10/2013
|
$29.29
|
PP = $29.59
|
|
MB = $31.07
|
Most Recent Note - 8/26/2013 8:14:57 PM
G - Volume totals have been cooling while consolidating neat its 52-week high in a tight range. Its 50 DMA line defines important near-term support to watch.
>>> The latest Featured Stock Update with an annotated graph appeared on 8/20/2013. Click here.
View all notes |
Alert me of new notes |
CANSLIM.net Company Profile |
SEC |
Zacks Reports |
StockTalk |
News |
Chart |
Request a new note
C
A N
S L
I M
|
|
|
|
THESE ARE NOT BUY RECOMMENDATIONS!
Comments contained in the body of this report are technical
opinions only. The material herein has been obtained
from sources believed to be reliable and accurate, however,
its accuracy and completeness cannot be guaranteed.
This site is not an investment advisor, hence it does
not endorse or recommend any securities or other investments.
Any recommendation contained in this report may not
be suitable for all investors and it is not to be deemed
an offer or solicitation on our part with respect to
the purchase or sale of any securities. All trademarks,
service marks and trade names appearing in this report
are the property of their respective owners, and are
likewise used for identification purposes only.
This report is a service available
only to active Paid Premium Members.
You may opt-out of receiving report notifications
at any time. Questions or comments may be submitted
by writing to Premium Membership Services 665 S.E. 10 Street, Suite 201 Deerfield Beach, FL 33441-5634 or by calling 1-800-965-8307
or 954-785-1121.
|
|
|

