You are not logged in.
This means you
CAN ONLY VIEW reports that were published prior to Monday, April 14, 2025.
You
MUST UPGRADE YOUR MEMBERSHIP if you want to see any current reports.
AFTER MARKET UPDATE - THURSDAY, AUGUST 27TH, 2009
Previous After Market Report Next After Market Report >>>
|
|
|
|
DOW |
+37.11 |
9,580.63 |
+0.39% |
|
Volume |
1,161,441,900 |
+10% |
|
Volume |
2,178,871,980 |
+4% |
|
NASDAQ |
+3.30 |
2,027.73 |
+0.16% |
|
Advancers |
1,613 |
52% |
|
Advancers |
1,294 |
46% |
|
S&P 500 |
+2.86 |
1,030.98 |
+0.28% |
|
Decliners |
1,371 |
44% |
|
Decliners |
1,386 |
49% |
|
Russell 2000 |
-0.25 |
583.77 |
-0.04% |
|
52 Wk Highs |
69 |
|
|
52 Wk Highs |
42 |
|
|
S&P 600 |
+0.08 |
308.37 |
+0.03% |
|
52 Wk Lows |
1 |
|
|
52 Wk Lows |
6 |
|
|
 |
After Early Weakness Stocks Ended Slightly Higher
Kenneth J. Gruneisen - Passed the CAN SLIM® Master's Exam
On Thursday the major averages overcame early weakness and ended the session slightly higher while trading continued in an unusually tight range. Decliners trailed advancers narrowly on the NYSE, yet advancers outnumbered decliners slightly on the Nasdaq exchange. Volume totals were reported slightly higher on the NYSE and on the Nasdaq exchange versus the prior session while both totals remained at below average levels typical of the "summer doldrums" when many fund managers are still vacationing. There were 13 high-ranked companies from the CANSLIM.net Leaders List that made a new 52-week high and appeared on the CANSLIM.net BreakOuts Page, lower than the 23 issues that appeared on the prior session. New 52-week highs solidly outnumbered new 52-week lows on both exchanges while new lows were in the single digits again.
In addition to seeing a contraction in the number of high-ranked stocks hitting new 52-week highs, there are other signs that new leadership is thinning of late. Take note that on Thursday the Mid-Day report's screen parameter was lowered to include stocks within 10% of their 52-week highs, instead of the usual mid-day screen showing stocks within 5% of 52 week highs. Even after that adjustment, only 10 stocks were listed and noted, whereas on the prior session's screen showing stocks within 5% of their 52 week highs 16 stocks showed up.
Investors did not flinch at the news that the FDIC's Problem List of banks has expanded to a 15-year high and that noncurrent loans and leases increased for a 13th consecutive quarter. A big spike up in AIG (AIG +26.93%) shares was attributed to a short squeeze.
The preliminary second quarter GDP report's headline number showed a better-than-expected 1.0% annualized decline, unchanged from the advance reading. Consumer spending during Q2 also topped expectations by contracting 1.0%, an improvement from the previous 1.2% decline. Meanwhile, initial jobless claims were reported in-line with expectations at 570,000, down 10,000 from the previous week. Continuing claims at 6.13 million were below expectations and down more than 100,000 from the previous week as more unemployed workers lost their jobless benefits.
Remember there is no reason to force a trade. Instead remain patient and wait for an expansion in leadership before accumulating any new positions or adding to current winners.
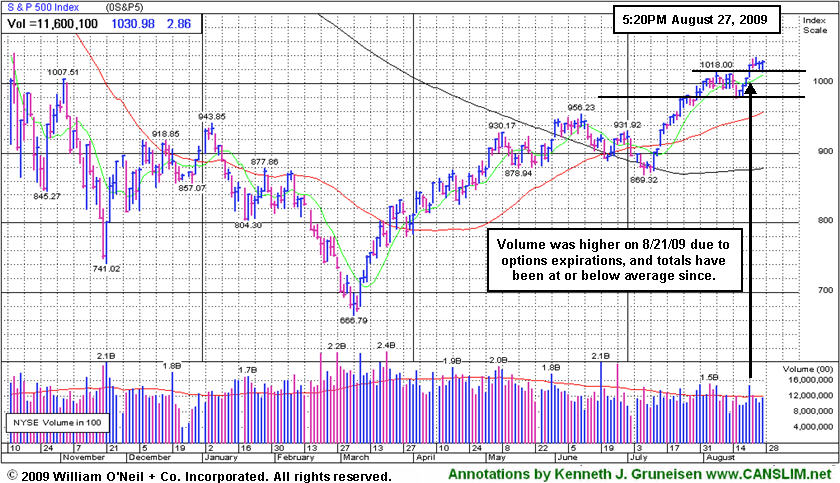
PICTURED: The S&P 500 Index blasted to a new high on 8/21/09 with heavier volume due to options expirations (always on the 3rd Friday of the month). Since then totals have been at or below average while consolidating in a tight range above prior highs.
|
 Kenneth J. Gruneisen started out as a licensed stockbroker in August 1987, a couple of months prior to the historic stock market crash that took the Dow Jones Industrial Average down -22.6% in a single day. He has published daily fact-based fundamental and technical analysis on high-ranked stocks online for two decades. Through FACTBASEDINVESTING.COM, Kenneth provides educational articles, news, market commentary, and other information regarding proven investment systems that work in good times and bad.
Comments contained in the body of this report are technical opinions only and are not necessarily those of Gruneisen Growth Corp. The material herein has been obtained from sources believed to be reliable and accurate, however, its accuracy and completeness cannot be guaranteed. Our firm, employees, and customers may effect transactions, including transactions contrary to any recommendation herein, or have positions in the securities mentioned herein or options with respect thereto. Any recommendation contained in this report may not be suitable for all investors and it is not to be deemed an offer or solicitation on our part with respect to the purchase or sale of any securities. |
|
 |
Financial Shares Shug Off Negative FDIC Headlines
Kenneth J. Gruneisen - Passed the CAN SLIM® Master's Exam
Financial shares held up well in the face of the FDIC-related news headlines (mentioned above) as the Broker/Dealer Index ($XBD +0.48%) and Bank Index ($BKX +1.33%) were among the session's best gainers. It is an encouraging sign of a healthier market environment whenever stocks are resilient and can rally in the face of negative news. It was a mostly quiet session otherwise on Thursday, with small gains for the Retail Index ($RLX +0.17%), Internet Index ($IIX +0.11%), Semiconductor Index ($SOX +0.25%), and Integrated Oil Index ($XOI +0.23%) and virtually no change for the Oil Services Index ($OSX -0.03%) and Networking Index ($NWX -0.03%). For the session, the Biotechnology Index ($BTK -2.21%) was a relative laggard as it sank more than -2%.
Charts courtesy www.stockcharts.com
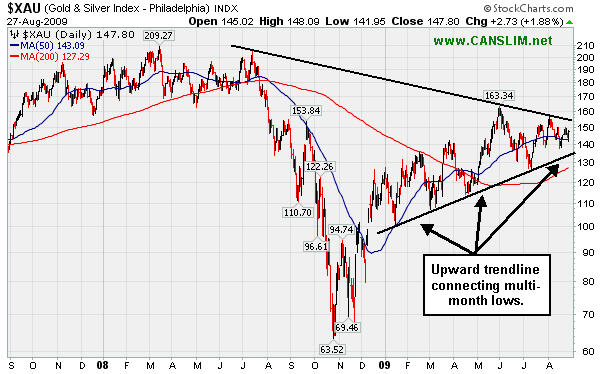
PICTURED: The Gold & Silver Index ($XAU +1.88%) has a well established upward trend in recent months. At the same time, one can connect at least 3 clear prior chart highs to identify its longer-term downward trendline. A subsequent break above or below either trendline would provide an important hint for investors about where the XAU is ultimately headed.
| Oil Services |
$OSX |
178.17 |
-0.06 |
-0.03% |
+46.77% |
| Healthcare |
$HMO |
1,233.07 |
+8.70 |
+0.71% |
+28.42% |
| Integrated Oil |
$XOI |
997.23 |
+2.25 |
+0.23% |
+1.79% |
| Semiconductor |
$SOX |
303.76 |
+0.77 |
+0.25% |
+43.17% |
| Networking |
$NWX |
214.17 |
-0.07 |
-0.03% |
+48.84% |
| Internet |
$IIX |
204.61 |
+0.23 |
+0.11% |
+52.96% |
| Broker/Dealer |
$XBD |
112.29 |
+0.54 |
+0.48% |
+44.95% |
| Retail |
$RLX |
370.24 |
+0.61 |
+0.17% |
+32.58% |
| Gold & Silver |
$XAU |
147.80 |
+2.73 |
+1.88% |
+19.34% |
| Bank |
$BKX |
47.21 |
+0.62 |
+1.33% |
+6.52% |
| Biotech |
$BTK |
916.62 |
-20.73 |
-2.21% |
+41.64% |
|
|
|
 |
Quiet Consolidation Continues After Damaging Loss
Kenneth J. Gruneisen - Passed the CAN SLIM® Master's Exam
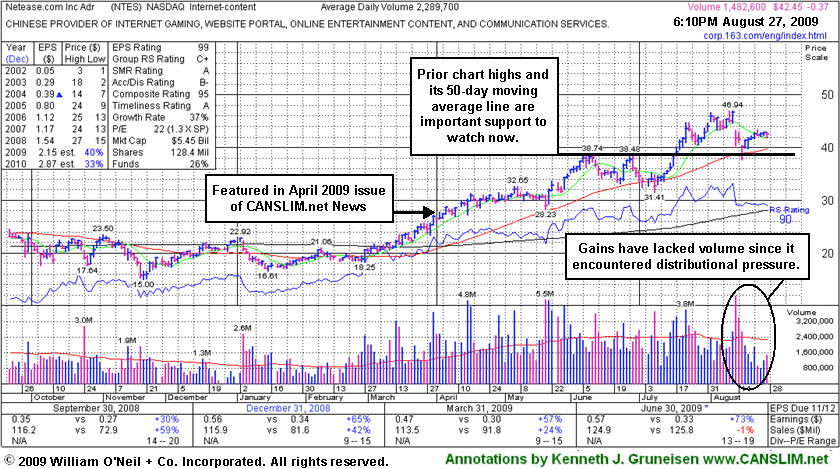
Netease.com Inc (NTES -$0.37 or -0.87% to $42.45) has seen volume totals drying up while recently consolidating in a tight range above support at its 50-day moving average (DMA) line. Gains have lacked volume since it encountered that heavy dose of distributional pressure and it was last shown in this section on 8/13/09 under the headline "Gap Down Loss on Heavy Volume Triggers Sell Signal" (read here). The market's negative reaction was due to the fact that sales revenues for the quarter ended June 30, 2009 were reported at -1% versus the year ago period, which was a continuation of its steady sequential deceleration in sales revenues increases from +79%, +59%, +42% in the Jun, Sep, Dec '08 comparisons and +24% in Mar '09.
Gaps are often a dead giveaway that large institutional investors (the I criteria) are rushing in one direction. In this case, the weak technical action was considered an early sell signal. Any subsequent losses below its 50 DMA line or prior chart highs in the $38 area would raise more serious concerns and trigger additional sell signals. It was also noted before as "an especially ominous sign, after a considerable run up, when a stock experiences its biggest point loss on the highest volume ever." There is not a number by its 8/13/09 volume spike, but that day's considerable loss came as 8.7 million shares traded! NTES traded up as much as +74.8% following its appearance in the April 2009 issue of the monthly newsletter, CANSLIM.net News (read here).
|
|
|
Color Codes Explained :
Y - Better candidates highlighted by our
staff of experts.
G - Previously featured
in past reports as yellow but may no longer be buyable under the
guidelines.
***Last / Change / Volume quote data in this table corresponds with the timestamp on the note***
Symbol/Exchange
Company Name
Industry Group |
Last |
Chg. |
Vol
% DAV |
Date Featured |
Price Featured |
Latest Pivot Point
Featured |
Status |
| Latest Max Buy Price |
ARO
- NYSE
Aeropostale Inc
RETAIL - Apparel Stores
|
$40.30
|
+0.00
|
2,158,557
71% DAV
3,057,800
|
8/21/2009
(Date
Featured) |
$39.21
(Price
Featured) |
PP = $38.84 |
Y |
| MB = $40.78 |
Most Recent Note - 8/27/2009 5:53:51 PM
Y - This high-ranked leader in the Retail - Clothing/shoe group is consolidating below its max buy level and above prior highs in the $38 area that should act as an initial chart support level now. A gap up gain for a new all-time high on 8/21/09 helped triggering a technical buy signal as it rose from a flat base pattern with almost 3 times average volume. It was featured in yellow with new pivot point and max buy levels noted in the 8/21/09 Mid-Day BreakOuts Report (read here). It has a good annual earnings history (the A criteria), and the 2 latest quarterly comparisons showed +81% and +84% earnings increases, well above the investment system's +25% guideline.
>>> The latest Featured Stock Update with an annotated graph appeared on 8/21/2009. click here.
|
|
C
A
S
I |
News |
Chart |
SEC
View all notes Alert
me of new notes
Company
Profile
|
CPLA
- NASDAQ
Capella Education Co
DIVERSIFIED SERVICES - Education and Training Services
|
$63.87
|
-0.24
|
87,050
43% DAV
201,300
|
7/9/2009
(Date
Featured) |
$59.69
(Price
Featured) |
PP = $62.06 |
Y |
| MB = $65.16 |
Most Recent Note - 8/27/2009 5:57:13 PM
Y - Quietly consolidating in a tight range on light volume, just 3% from its 52-week high. The Commercial Services-Schools Group has shown some isolated leadership which is somewhat reassuring for the L criteria, but the groups still has low ranks and CPLA's Relative Strength rank has slumped to 53, under the 80+ guideline. Its small supply of only 13.9 million shares in the float could contribute to greater price volatility in the event of institutional accumulation or distribution. The number of top-rated funds owning an interest rose from 91 in Sept '08, to 137 as of June '09, which is reassuring with respect to the I criteria. It has a very good earnings history that satisfies the C & A criteria.
>>> The latest Featured Stock Update with an annotated graph appeared on 8/19/2009. click here.
|
|
C
A
S
I |
News |
Chart |
SEC
View all notes Alert
me of new notes
Company
Profile
|
CRM
- NYSE
Salesforce.com Inc
INTERNET - Internet Software & Services
|
$52.68
|
-0.19
|
1,942,229
102% DAV
1,904,900
|
8/16/2009
(Date
Featured) |
$47.12
(Price
Featured) |
PP = $45.59 |
Y |
| MB = $47.87 |
Most Recent Note - 8/27/2009 5:58:20 PM
Y - Holding its ground in a tight range with volume cooling off since its "breakaway gap" for a considerable gain on 8/21/09 with more than 5 times average volume. The stock's exceptional action was discussed further in the "Ken's Mailbag" Q&A with a member in the 8/21/09 After Market Update (read here). A Stock Bulletin was published with detailed analysis and an annotated graph on 8/16/09 (read here).
>>> The latest Featured Stock Update with an annotated graph appeared on 8/16/2009. click here.
|
|
C
A
S
I |
News |
Chart |
SEC
View all notes Alert
me of new notes
Company
Profile
|
GMCR
- NASDAQ
Green Mtn Coffee Roastrs
FOOD & BEVERAGE - Processed & Packaged Goods
|
$59.71
|
+0.31
|
952,509
57% DAV
1,668,300
|
7/17/2009
(Date
Featured) |
$60.15
(Price
Featured) |
PP = $63.79 |
G |
| MB = $66.98 |
Most Recent Note - 8/27/2009 5:59:22 PM
G - Posted a small gain on light volume today. Its outlook is increasingly questionable the longer it stays trading under its 50 DMA line which is now downward sloping and a source of technical resistance. The next support is at prior chart lows in the $54-53 area. As previously noted, "its gap down and considerable loss on 8/17/09 on heavy volume triggered technical sell signals." GMCR traded up more than +168% since appearing with an annotated graph under the headline "It May Soon Be Time To Go Green" when featured in the January 2009 CANSLIM.net News (read here).
>>> The latest Featured Stock Update with an annotated graph appeared on 8/26/2009. click here.
|
|
C
A
S
I |
News |
Chart |
SEC
View all notes Alert
me of new notes
Company
Profile
|
LFT
-
|
$26.17
|
+0.17
|
454,984
57% DAV
791,400
|
8/10/2009
(Date
Featured) |
$31.49
(Price
Featured) |
PP = $30.57 |
G |
| MB = $32.10 |
Most Recent Note - 8/27/2009 6:00:39 PM
G - Small gain today after a considerable loss on average volume led to a violation of its 50 DMA line again on the prior session. Recently noted "substantial losses on heavy volume indicative of distributional pressure."
>>> The latest Featured Stock Update with an annotated graph appeared on 8/25/2009. click here.
|
|
C
A
S
I |
News |
Chart |
SEC
View all notes Alert
me of new notes
Company
Profile
|
NTES
- NASDAQ
Netease Inc Adr
INTERNET - Internet Information Providers
|
$42.45
|
-0.37
|
1,484,484
65% DAV
2,289,700
|
7/17/2009
(Date
Featured) |
$39.29
(Price
Featured) |
PP = $38.74 |
G |
| MB = $40.68 |
Most Recent Note - 8/27/2009 6:01:55 PM
G - Volume has been drying up while recently consolidating in a tight range above support at its 50 DMA line and above prior chart highs in the $38 area. As previously noted, "a 8/13/09 gap down for a considerable loss on nearly 4 times average volume triggered a technical sell signal."
>>> The latest Featured Stock Update with an annotated graph appeared on 8/27/2009. click here.
|
|
C
A
S
I |
News |
Chart |
SEC
View all notes Alert
me of new notes
Company
Profile
|
NVEC
- NASDAQ
N V E Corp
ELECTRONICS - Semiconductor - Specialized
|
$54.82
|
-0.50
|
34,798
36% DAV
95,700
|
8/26/2009
(Date
Featured) |
$55.32
(Price
Featured) |
PP = $57.60 |
Y |
| MB = $60.48 |
Most Recent Note - 8/27/2009 6:02:50 PM
Y - Quiet consolidation continues in close striking range of all-time highs. Basing for nearly 5 weeks above important initial support at its 50 DMA line and prior chart highs. Color code was changed to yellow with new pivot point and max buy prices noted. Quarterly sales revenues in the 6 million dollar range are still rather minuscule, leaving concerns.
>>> The latest Featured Stock Update with an annotated graph appeared on 8/18/2009. click here.
|
|
C
A
S
I |
News |
Chart |
SEC
View all notes Alert
me of new notes
Company
Profile
|
PEGA
- NASDAQ
Pegasystems Inc
COMPUTER SOFTWARE & SERVICES - Business Software & Services
|
$32.32
|
-0.47
|
243,517
68% DAV
357,100
|
7/29/2009
(Date
Featured) |
$27.53
(Price
Featured) |
PP = $27.49 |
G |
| MB = $28.86 |
Most Recent Note - 8/27/2009 6:05:28 PM
G - Hovering near all-time highs. Rallied for an impressive 6 session winning streak since finding support at its 50 DMA line, a streak that included a big gap up on 8/24/09 for a considerable gain heavy volume.
>>> The latest Featured Stock Update with an annotated graph appeared on 8/24/2009. click here.
|
|
C
A
S
I |
News |
Chart |
SEC
View all notes Alert
me of new notes
Company
Profile
|
UTA
-
|
$11.33
|
-0.67
|
573,860
102% DAV
563,700
|
7/28/2009
(Date
Featured) |
$12.87
(Price
Featured) |
PP = $12.70 |
G |
| MB = $13.34 |
Most Recent Note - 8/27/2009 6:08:40 PM
G - Violated its 50 DMA line today triggering a technical sell signal with a loss on average volume. Falling near its 8/18/09 low ($10.91), where any further deterioration would raise more serious concerns. There has been a lack of volume behind gains since its negative reversal on 8/13/09 for a loss on very heavy volume was noted as "a clear sign of worrisome distributional pressure." Strong action prompted it to be featured in yellow with pivot point and max buy levels noted in the 7/28/09 mid-day breakouts report (read here), with additional analysis included in the after market update (read here).
>>> The latest Featured Stock Update with an annotated graph appeared on 8/20/2009. click here.
|
|
C
A
S
I |
News |
Chart |
SEC
View all notes Alert
me of new notes
Company
Profile
|
|
|
|
THESE ARE NOT BUY RECOMMENDATIONS!
Comments contained in the body of this report are technical
opinions only. The material herein has been obtained
from sources believed to be reliable and accurate, however,
its accuracy and completeness cannot be guaranteed.
This site is not an investment advisor, hence it does
not endorse or recommend any securities or other investments.
Any recommendation contained in this report may not
be suitable for all investors and it is not to be deemed
an offer or solicitation on our part with respect to
the purchase or sale of any securities. All trademarks,
service marks and trade names appearing in this report
are the property of their respective owners, and are
likewise used for identification purposes only.
This report is a service available
only to active Paid Premium Members.
You may opt-out of receiving report notifications
at any time. Questions or comments may be submitted
by writing to Premium Membership Services 665 S.E. 10 Street, Suite 201 Deerfield Beach, FL 33441-5634 or by calling 1-800-965-8307
or 954-785-1121.
|
|
|

