You are not logged in.
This means you
CAN ONLY VIEW reports that were published prior to Monday, April 14, 2025.
You
MUST UPGRADE YOUR MEMBERSHIP if you want to see any current reports.
AFTER MARKET UPDATE - TUESDAY, AUGUST 26TH, 2014
Previous After Market Report Next After Market Report >>>
|
|
|
|
DOW |
+29.83 |
17,106.70 |
+0.17% |
|
Volume |
501,023,070 |
+4% |
|
Volume |
1,318,990,860 |
+3% |
|
NASDAQ |
+13.29 |
4,570.64 |
+0.29% |
|
Advancers |
2,007 |
63% |
|
Advancers |
1,773 |
63% |
|
S&P 500 |
+2.10 |
2,000.02 |
+0.11% |
|
Decliners |
1,023 |
32% |
|
Decliners |
931 |
33% |
|
Russell 2000 |
+9.95 |
1,175.17 |
+0.85% |
|
52 Wk Highs |
188 |
|
|
52 Wk Highs |
106 |
|
|
S&P 600 |
+4.73 |
673.15 |
+0.71% |
|
52 Wk Lows |
13 |
|
|
52 Wk Lows |
30 |
|
|
 |
Breadth Positive and Volume Totals Higher Behind Indices' Gains
Kenneth J. Gruneisen - Passed the CAN SLIM® Master's Exam
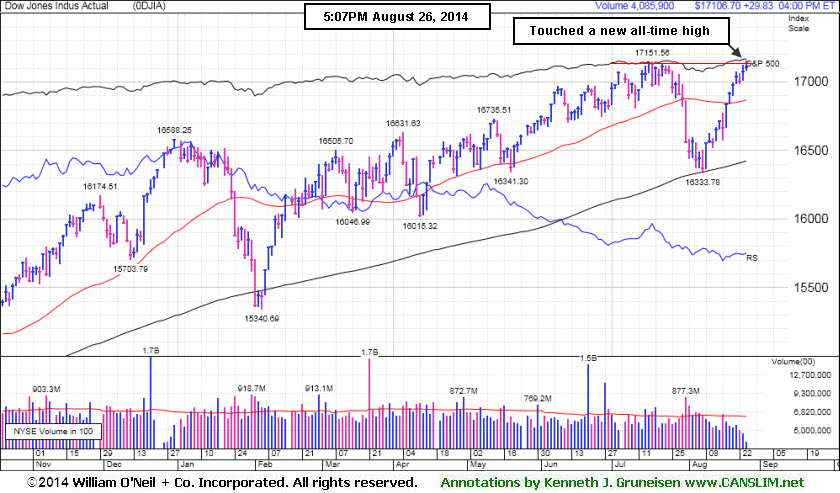
The major averages posted unanimous gains again on Tuesday. The volume totals were higher on the NYSE and on the Nasdaq exchange, a sign of increased institutional buying demand. Advancers led decliners by nearly a 2-1 margin on the NYSE and on the NASDAQ exchange. There were 68 high-ranked companies from the CANSLIM.net Leaders List that made new 52-week highs and appeared on the CANSLIM.net BreakOuts Page, matching the prior session total of 68 stocks. New 52-week highs outnumbered new 52-week lows on the NYSE and on the Nasdaq exchange. There were gains for 9 of the 12 of the high-ranked companies currently included on the Featured Stocks Page. The improved action in the broader market (M criteria) has been considered significant enough to shift back to a "confirmed uptrend" while leadership (stocks hitting new 52-week highs) has remained healthy. Remember that disciplined investors buy stocks with superior fundamentals only after they have triggered a proper technical buy signal.
PICTURED: The Dow Jones Industrial Average hit another new all-time high.
The major averages advanced for a second straight day following a round of encouraging economic data. Durable goods orders jumped 22.6% in July due to a sharp increase in commercial aircraft bookings. Consumer confidence rose to its best level in seven years. The pace of home price increases slowed to an 8.1% annualized rate in June.
In M&A news, Tim Hortons Inc (THI +8.47%) rose again after Burger King Worldwide (BKW -4.32%) agreed to buy the Canadian donut shop for $11.4 billion. On the earnings front, DSW (DSW +9.24%) advanced after the shoe retailer's quarterly results topped estimates and raised its full-year guidance. Best Buy (BBY -6.85%) fell as sales missed analyst projections.
Energy was the best performing sector in the S&P 500. Exxon (XOM +0.9%) rose as the price of crude oil rebounded from a seven month low. Utilities were down the most on the session. Exelon (EXC -1.58%) declined.
Treasuries were little changed. The 10-year note slipped 4/32 to yield 2.40%. In commodity trading, gold futures were up +0.5% to $1,283.80 an ounce. The October contract for West Texas Intermediate crude gained +0.5% to $93.84 a barrel.
The CANSLIM.net Featured Stocks Page shows the most action-worthy candidates and their latest notes and a Headline Link directs members to the latest detailed analysis with data-packed graphs annotated by a Certified expert along with links to additional resources. The Premium Member Homepage includes "dynamic archives" to all prior pay reports published.
|
 Kenneth J. Gruneisen started out as a licensed stockbroker in August 1987, a couple of months prior to the historic stock market crash that took the Dow Jones Industrial Average down -22.6% in a single day. He has published daily fact-based fundamental and technical analysis on high-ranked stocks online for two decades. Through FACTBASEDINVESTING.COM, Kenneth provides educational articles, news, market commentary, and other information regarding proven investment systems that work in good times and bad.
Comments contained in the body of this report are technical opinions only and are not necessarily those of Gruneisen Growth Corp. The material herein has been obtained from sources believed to be reliable and accurate, however, its accuracy and completeness cannot be guaranteed. Our firm, employees, and customers may effect transactions, including transactions contrary to any recommendation herein, or have positions in the securities mentioned herein or options with respect thereto. Any recommendation contained in this report may not be suitable for all investors and it is not to be deemed an offer or solicitation on our part with respect to the purchase or sale of any securities. |
|
 |
Retail, Networking, Biotech, and Commodity-Linked Groups Rose
Kenneth J. Gruneisen - Passed the CAN SLIM® Master's Exam
The Retail Index ($RLX +0.41%) was a positive influence on the major averages and financial shares had a slightly positive bias as the Bank Index ($BKX +0.29%) and the Broker/Dealer Index ($XBD +0.13%) inched higher. The Networking Index ($NWX +1.25%) and the Biotechnology Index ($BTK +0.99%) led the tech sector higher while the Semiconductor Index ($SOX +0.05%) finished flat. The Gold & Silver Index ($XAU +2.17%) posted a solid gain and energy-related shares rose as the Oil Services Index ($OSX +0.96%) outpaced the Integrated Oil Index ($XOI +0.21%).
Charts courtesy www.stockcharts.com
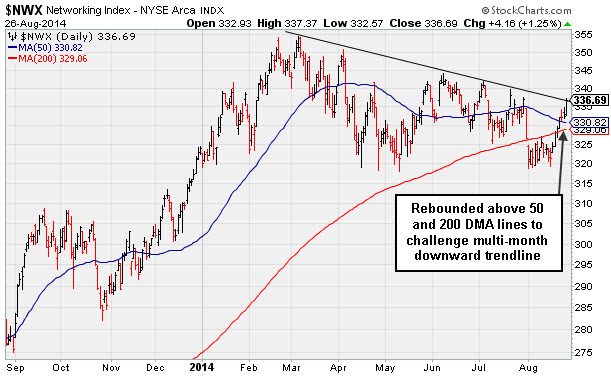
PICTURED: The Networking Index ($NWX +1.25%) rebounded further above its 50-day and 200-day moving average (DMA) lines to challenge a multi-month downward trendline.
| Oil Services |
$OSX |
292.75 |
+2.77 |
+0.96% |
+4.17% |
| Integrated Oil |
$XOI |
1,677.25 |
+3.59 |
+0.21% |
+11.58% |
| Semiconductor |
$SOX |
637.55 |
+0.30 |
+0.05% |
+19.16% |
| Networking |
$NWX |
336.69 |
+4.16 |
+1.25% |
+3.94% |
| Broker/Dealer |
$XBD |
168.59 |
+0.22 |
+0.13% |
+5.00% |
| Retail |
$RLX |
955.93 |
+3.92 |
+0.41% |
+1.72% |
| Gold & Silver |
$XAU |
100.21 |
+2.13 |
+2.17% |
+19.08% |
| Bank |
$BKX |
71.91 |
+0.21 |
+0.29% |
+3.83% |
| Biotech |
$BTK |
3,102.70 |
+30.29 |
+0.99% |
+33.14% |
|
|
|
 |
Holding Ground Near All-Time Highs Despite Fundamental Concerns
Kenneth J. Gruneisen - Passed the CAN SLIM® Master's Exam
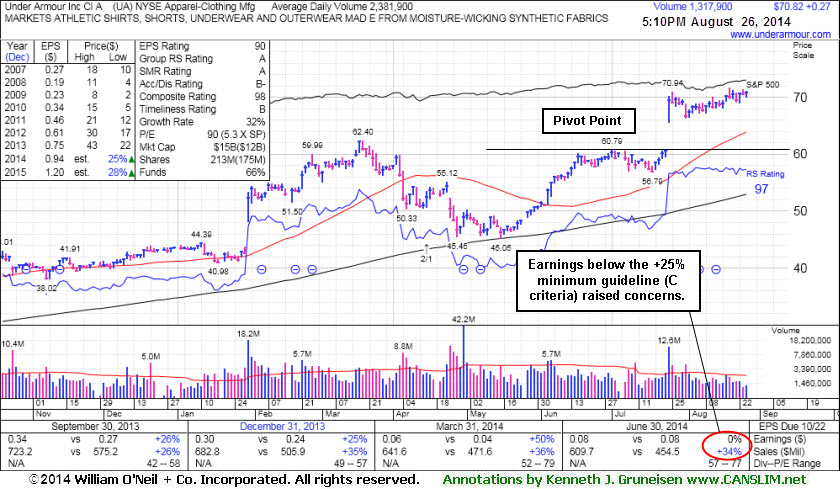
Under Armour Inc (UA +$0.37 or +0.54% to $69.22) is stubbornly holding its ground near its all-time high and no resistance remains due to overhead supply. Fundamental concerns were recently raised as the Apparel - Clothing Manufacturing firm reported earnings +0% on +34% sales revenues for the Jun '14 quarter, below the +25% minimum earnings guideline (C criteria), yet the company raised its guidance. It was last shown in this FSU section on 7/30/14 with annotated graphs under the headline, "Bullish Action Despite Latest Earnings Below +25% Minimum Guideline".
It has been stubbornly holding its ground at its 52-week high following a considerable "breakaway gap" on 7/24/14 with more than 4 times average volume. A breakaway gap is the one noted exception where investors may chase a stock more than +5% above prior highs, but the risks increase the further above prior highs one buys that an ordinary pullback may prompt investors into selling based on the fact-based investment system's rule of always selling if any stock falls more than -7% from the purchase price. However, fundamental concerns were raised by its sub par earnings growth in the most current quarter.
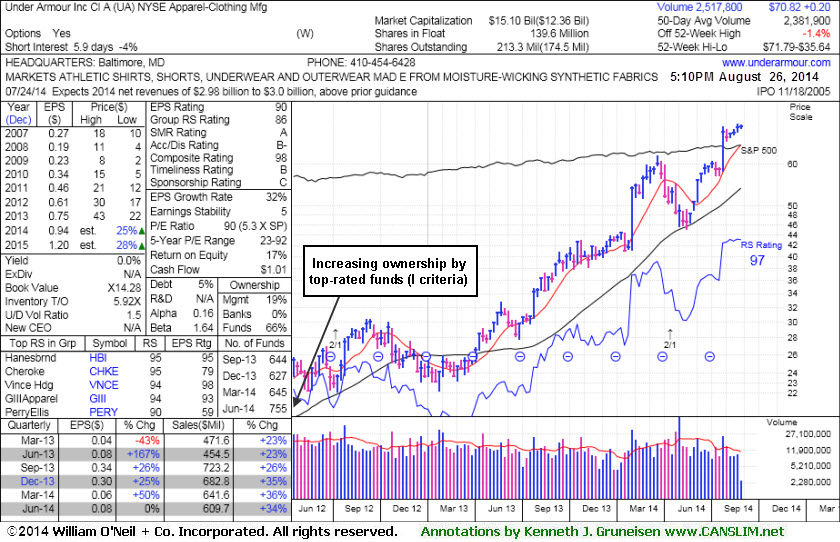
UA was highlighted in yellow with pivot point based on its 7/01/14 high in the 7/10/14 mid-day report (read here). Its annual earnings (A criteria) history has been strong. The number of top-rated funds owning its shares rose from 637 in Dec '13 to 7565 in Jun '14, a reassuring trend concerning the I criteria. Its current Up/Down Volume Ratio of 1.5 is an unbiased indication that its shares have been under accumulation over the past 50 days.
|
|
|
Color Codes Explained :
Y - Better candidates highlighted by our
staff of experts.
G - Previously featured
in past reports as yellow but may no longer be buyable under the
guidelines.
***Last / Change / Volume data in this table is the closing quote data***
Symbol/Exchange
Company Name
Industry Group |
PRICE |
CHANGE
(%Change) |
Day High |
Volume
(% DAV)
(% 50 day avg vol) |
52 Wk Hi
% From Hi |
Featured
Date |
Price
Featured |
Pivot Featured |
|
Max Buy |
ACT
-
NYSE
Actavis plc
Medical-Generic Drugs
|
$227.72
|
+1.11
0.49% |
$228.62
|
1,219,078
47.64% of 50 DAV
50 DAV is 2,559,000
|
$230.77
-1.32%
|
6/20/2014
|
$216.53
|
PP = $230.87
|
|
MB = $242.41
|
Most Recent Note - 8/25/2014 3:28:03 PM
Y - Color code is changed to yellow while no new pivot point has been cited. Perched near its 52-week high today following 9 consecutive gains on light to average volume
>>> FEATURED STOCK ARTICLE : Enduring Distributional Pressure While Sputtering Near 50-Day Average - 8/5/2014
View all notes |
Set NEW NOTE alert |
CANSLIM.net Company Profile |
SEC
News |
Chart |
Request a new note
C
A N
S L
I M


|
AFSI
-
NASDAQ
Amtrust Financial Svcs
INSURANCE - Property and; Casualty Insurance
|
$45.06
|
+0.44
0.99% |
$45.63
|
618,717
132.71% of 50 DAV
50 DAV is 466,200
|
$47.10
-4.33%
|
5/21/2014
|
$44.85
|
PP = $44.85
|
|
MB = $47.09
|
Most Recent Note - 8/22/2014 5:59:19 PM
G - Consolidating above support at its 50 DMA line, still only -6.8% off its 52-week high, however its Relative Strength Rating has slumped to 66, well below the 80+ minimum for buy candidates. Faces resistance due to overhead supply up through the $47 level.
>>> FEATURED STOCK ARTICLE : Relative Strength Rating Slumped While Building Longer Base - 8/18/2014
View all notes |
Set NEW NOTE alert |
CANSLIM.net Company Profile |
SEC
News |
Chart |
Request a new note
C
A N
S L
I M
|
BITA
-
NYSE
Bitauto Hldgs Ltd Ads
Internet-Content
|
$96.14
|
+5.08
5.58% |
$98.28
|
4,726,170
399.85% of 50 DAV
50 DAV is 1,182,000
|
$92.00
4.50%
|
6/26/2014
|
$46.20
|
PP = $47.03
|
|
MB = $49.38
|
 Most Recent Note - 8/26/2014 12:01:16 PM
G - Has the look of a "climax run" with volume-driven gains getting very extended from its prior base. Its 50 DMA line ($58.50) defines important near-term support to watch on pullbacks.
>>> FEATURED STOCK ARTICLE : Perched at High After 3 Consecutive Volume-Driven Gains - 8/8/2014
View all notes |
Set NEW NOTE alert |
CANSLIM.net Company Profile |
SEC
News |
Chart |
Request a new note
C
A N
S L
I M
|
EQM
-
NYSE
E Q T Midstream Partners
ENERGY - Oil and Gas Pipelines
|
$94.93
|
+1.43
1.53% |
$95.25
|
101,984
32.07% of 50 DAV
50 DAV is 318,000
|
$102.51
-7.39%
|
12/12/2013
|
$53.17
|
PP = $56.51
|
|
MB = $59.34
|
Most Recent Note - 8/25/2014 3:29:15 PM
G - Rebounding above its 50 DMA line today helping its technical stance improve. Reported earnings +37% on +21% sales revenues for the Jun '14 quarter, an improvement after 2 sub par quarterly earnings comparisons.
>>> FEATURED STOCK ARTICLE : Following 50-Day Moving Average Violation Gains Lacked Volume - 8/7/2014
View all notes |
Set NEW NOTE alert |
CANSLIM.net Company Profile |
SEC
News |
Chart |
Request a new note
C
A N
S L
I M
|
FB
-
NASDAQ
Facebook Inc Cl A
INTERNET
|
$75.96
|
+0.94
1.25% |
$75.99
|
23,653,343
60.86% of 50 DAV
50 DAV is 38,868,000
|
$76.74
-1.02%
|
7/24/2014
|
$76.00
|
PP = $72.69
|
|
MB = $76.32
|
Most Recent Note - 8/25/2014 3:30:40 PM
Y - Volume totals have cooled while consolidating in a tight range, stubbornly holding its ground since gapping up on 7/24/14. Prior highs in the $72 area define initial support above its 50 DMA line ($69.93).
>>> FEATURED STOCK ARTICLE : Making Limited Headway But Holding Ground Since Gap Up - 8/20/2014
View all notes |
Set NEW NOTE alert |
CANSLIM.net Company Profile |
SEC
News |
Chart |
Request a new note
C
A N
S L
I M
|
Symbol/Exchange
Company Name
Industry Group |
PRICE |
CHANGE
(%Change) |
Day High |
Volume
(% DAV)
(% 50 day avg vol) |
52 Wk Hi
% From Hi |
Featured
Date |
Price
Featured |
Pivot Featured |
|
Max Buy |
PANW
-
NYSE
Palo Alto Networks
Computer Sftwr-Security
|
$85.59
|
+1.02
1.21% |
$85.93
|
866,229
62.95% of 50 DAV
50 DAV is 1,376,000
|
$87.79
-2.51%
|
7/30/2014
|
$84.21
|
PP = $85.88
|
|
MB = $90.17
|
Most Recent Note - 8/25/2014 3:35:58 PM
Y - Quietly hovering near its 52-week high, stubbornly holding its ground. Volume should be at least +40% above average behind gains above a stock's pivot point to trigger a proper technical buy signal. Its 50 DMA line ($81.02) defines important near-term support.
>>> FEATURED STOCK ARTICLE : Building on New Base Pattern Above 50-Day Average - 8/11/2014
View all notes |
Set NEW NOTE alert |
CANSLIM.net Company Profile |
SEC
News |
Chart |
Request a new note
C
A N
S L
I M
|
STRT
-
NASDAQ
Strattec Security Corp
AUTOMOTIVE - Auto Parts
|
$77.05
|
+1.70
2.26% |
$77.33
|
12,823
44.22% of 50 DAV
50 DAV is 29,000
|
$78.00
-1.22%
|
8/22/2014
|
$71.47
|
PP = $73.97
|
|
MB = $77.67
|
Most Recent Note - 8/25/2014 3:24:59 PM
Y - Rallied above its pivot point but volume thus far is below average today. Gains should be backed by volume at least +40% above average to trigger a proper technical buy signal. Highlighted in yellow with pivot point based on its 6/06/14 high plus 10 cents in the 8/22/14 mid-day report (read here). See the latest FSU analysis for more details and annotated graphs.
>>> FEATURED STOCK ARTICLE : Small Supply of Shares and Perched Near All-Time Highs - 8/22/2014
View all notes |
Set NEW NOTE alert |
CANSLIM.net Company Profile |
SEC
News |
Chart |
Request a new note
C
A N
S L
I M
|
TARO
-
NYSE
Taro Pharmaceutical Inds
DRUGS - Drug Manufacturers - Other
|
$160.53
|
-0.69
-0.43% |
$162.00
|
56,509
74.35% of 50 DAV
50 DAV is 76,000
|
$164.00
-2.12%
|
7/30/2014
|
$144.24
|
PP = $149.99
|
|
MB = $157.49
|
Most Recent Note - 8/22/2014 5:55:47 PM
G - Rallied for a new 52-week high with today's volume-driven gain. Recently reported earnings for the Jun '14 quarter below the +25% minimum earnings guideline (C criteria) raising fundamental concerns.
>>> FEATURED STOCK ARTICLE : Still Building on an Advanced Base Pattern - 8/6/2014
View all notes |
Set NEW NOTE alert |
CANSLIM.net Company Profile |
SEC
News |
Chart |
Request a new note
C
A N
S L
I M
|
TRN
-
NYSE
Trinity Industries Inc
TRANSPORTATION - Railroads
|
$48.45
|
-0.10
-0.21% |
$48.83
|
1,913,583
71.64% of 50 DAV
50 DAV is 2,671,000
|
$49.17
-1.46%
|
4/30/2014
|
$37.79
|
PP = $38.03
|
|
MB = $39.93
|
Most Recent Note - 8/25/2014 3:32:30 PM
G - Hitting another new 52-week high with today's 6th consecutive gain. It has not formed a sound base.
>>> FEATURED STOCK ARTICLE : Rallying Into New High Territory Without Forming New Base - 8/25/2014
View all notes |
Set NEW NOTE alert |
CANSLIM.net Company Profile |
SEC
News |
Chart |
Request a new note
C
A N
S L
I M
|
UA
-
NYSE
Under Armour Inc Cl A
CONSUMER NON-DURABLES - Textile - Apparel Clothing
|
$70.82
|
+0.27
0.38% |
$71.19
|
1,313,544
55.17% of 50 DAV
50 DAV is 2,381,000
|
$71.79
-1.35%
|
7/10/2014
|
$58.50
|
PP = $60.79
|
|
MB = $63.83
|
Most Recent Note - 8/25/2014 3:33:55 PM
G - Stubbornly holding its ground near its all-time high and no resistance remains due to overhead supply. Recently reported earnings +0% on +34% sales revenues for the Jun '14 quarter, below the +25% minimum earnings guideline (C criteria), yet the company raised its guidance.
>>> FEATURED STOCK ARTICLE : Holding Ground Near All-Time Highs Despite Fundamental Concerns - 8/26/2014
View all notes |
Set NEW NOTE alert |
CANSLIM.net Company Profile |
SEC
News |
Chart |
Request a new note
C
A N
S L
I M
|
Symbol/Exchange
Company Name
Industry Group |
PRICE |
CHANGE
(%Change) |
Day High |
Volume
(% DAV)
(% 50 day avg vol) |
52 Wk Hi
% From Hi |
Featured
Date |
Price
Featured |
Pivot Featured |
|
Max Buy |
WLK
-
NYSE
Westlake Chemical Corp
CHEMICALS - Specialty Chemicals
|
$94.92
|
-0.05
-0.05% |
$95.51
|
369,995
71.57% of 50 DAV
50 DAV is 517,000
|
$95.36
-0.46%
|
4/29/2014
|
$72.79
|
PP = $69.31
|
|
MB = $72.78
|
Most Recent Note - 8/26/2014 5:33:32 PM
G - Perched at its 52-week high, and its 50 DMA line defines support where a subsequent violation would raise greater concerns and trigger a technical sell signal. Technical strength has continued despite having reported earnings +11% on +6% sales revenues for the Jun '14 quarter, below the +25% minimum earnings guideline (C criteria), raising fundamental concerns.
>>> FEATURED STOCK ARTICLE : Technically Strong Despite Fundamental Concerns Raised By Most Current Quarterly Earnings - 8/21/2014
View all notes |
Set NEW NOTE alert |
CANSLIM.net Company Profile |
SEC
News |
Chart |
Request a new note
C
A N
S L
I M
|
YY
-
NASDAQ
YY Inc Ads
INTERNET - Internet Service Providers
|
$89.98
|
+1.56
1.76% |
$90.88
|
1,282,087
87.16% of 50 DAV
50 DAV is 1,471,000
|
$90.93
-1.04%
|
8/19/2014
|
$85.81
|
PP = $91.03
|
|
MB = $95.58
|
Most Recent Note - 8/26/2014 5:35:51 PM
Y - Finished at a best-ever close following today's 3rd consecutive gain on below average volume. Highlighted in yellow in the 8/19/14 mid-day report (read here), and subsequent volume-driven gains for new highs to trigger a new technical buy signal.
>>> FEATURED STOCK ARTICLE : Encountered Distributional Peressure Near Prior High - 8/19/2014
View all notes |
Set NEW NOTE alert |
CANSLIM.net Company Profile |
SEC
News |
Chart |
Request a new note
C
A N
S L
I M
|
|
|
|
THESE ARE NOT BUY RECOMMENDATIONS!
Comments contained in the body of this report are technical
opinions only. The material herein has been obtained
from sources believed to be reliable and accurate, however,
its accuracy and completeness cannot be guaranteed.
This site is not an investment advisor, hence it does
not endorse or recommend any securities or other investments.
Any recommendation contained in this report may not
be suitable for all investors and it is not to be deemed
an offer or solicitation on our part with respect to
the purchase or sale of any securities. All trademarks,
service marks and trade names appearing in this report
are the property of their respective owners, and are
likewise used for identification purposes only.
This report is a service available
only to active Paid Premium Members.
You may opt-out of receiving report notifications
at any time. Questions or comments may be submitted
by writing to Premium Membership Services 665 S.E. 10 Street, Suite 201 Deerfield Beach, FL 33441-5634 or by calling 1-800-965-8307
or 954-785-1121.
|
|
|