You are not logged in.
This means you
CAN ONLY VIEW reports that were published prior to Monday, April 28, 2025.
You
MUST UPGRADE YOUR MEMBERSHIP if you want to see any current reports.
AFTER MARKET UPDATE - MONDAY, AUGUST 26TH, 2013
Previous After Market Report Next After Market Report >>>
|
|
|
|
DOW |
-64.05 |
14,946.46 |
-0.43% |
|
Volume |
546,183,690 |
-4% |
|
Volume |
1,359,136,040 |
-7% |
|
NASDAQ |
-0.22 |
3,657.57 |
-0.01% |
|
Advancers |
1,249 |
40% |
|
Advancers |
1,137 |
44% |
|
S&P 500 |
-6.72 |
1,656.78 |
-0.40% |
|
Decliners |
1,785 |
57% |
|
Decliners |
1,363 |
52% |
|
Russell 2000 |
+0.23 |
1,038.47 |
+0.02% |
|
52 Wk Highs |
93 |
|
|
52 Wk Highs |
114 |
|
|
S&P 600 |
-0.42 |
588.11 |
-0.07% |
|
52 Wk Lows |
19 |
|
|
52 Wk Lows |
15 |
|
|
 |
Indices Erased Early Gains Closing Lower on Lighter Volume
Kenneth J. Gruneisen - Passed the CAN SLIM® Master's Exam
Stocks closed lower on Monday. The volume totals were reported lighter than the prior session totals on the NYSE and on the Nasdaq exchange. Breadth was negative as decliners led advancers by a 3-2 margin on the NYSE and by a narrower 7-6 margin on the Nasdaq exchange. There were 39 high-ranked companies from the CANSLIM.net Leaders List that made new 52-week highs and appeared on the CANSLIM.net BreakOuts Page, up from a total of 19 stocks on the prior session. The list of stocks hitting new 52-week highs outnumbered new 52-week lows on the NYSE and on the Nasdaq exchange. There were gains for 11 of the 16 high-ranked companies currently included on the Featured Stocks Page. The market (M criteria) clearly signaled that the major averages are in a "correction" based on recent technical damage. Individual holdings should be closely monitored for any worrisome technical sell signals. This is precisely how the fact-based system helps investors avoid serious setbacks and raise cash levels during market downdrafts. Historic studies suggest that no new buying efforts should be made during market corrections.
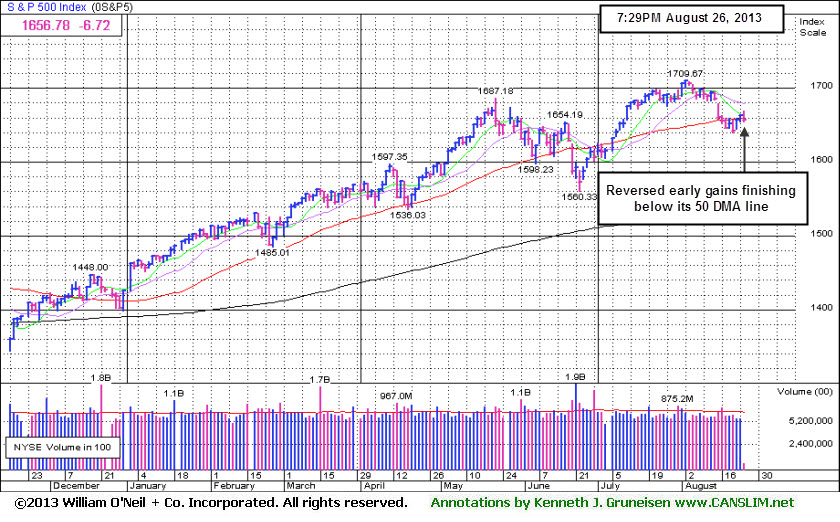
The major averages erased earlier gains after U.S. Secretary of State John Kerry said Syria will be held accountable for the use of chemical weapons. The market was in positive territory for most of the session after weaker-than-expected manufacturing data tempered concerns the Fed will trim its stimulus efforts. Before the open, a report showed durable goods orders dropped -13.4% in July, more than the consensus projection for a -4.2% decline.
Nine of 10 sectors in the S&P 500 were down. Telecom was among the worst performing groups as Verizon Communications Inc (VZ -1.41%). Consumer staples also underperformed with Tyson Foods Inc (TSN -7.34%) after an analyst downgraded the stock this morning. Health care was the lone sector end the session in positive territory. Shares of Amgen Inc (AMGN -7.72%) fell after announcing it agreed to acquire cancer drug developer Onyx Pharmaceuticals Inc(ONXX +5.58%) for $10.4 billion.
Treasuries were higher with the 10-year note up 8/32 to yield 2.79%.
Stay familiar with companies listed on the CANSLIM.net Featured Stocks Page - a page showing the most action-worthy candidates' latest notes and links to additional resources including detailed analysis with data-packed graphs which are annotated by a Certified expert. The Premium Member Homepage - includes "dynamic archives" to all prior pay reports published. Watch for an announcement via email concerning the next WEBCAST.
PICTURED: The S&P 500 Index erased its early gain and slumped to a close just below its 50-day moving average (DMA) line (1,660).
|
 Kenneth J. Gruneisen started out as a licensed stockbroker in August 1987, a couple of months prior to the historic stock market crash that took the Dow Jones Industrial Average down -22.6% in a single day. He has published daily fact-based fundamental and technical analysis on high-ranked stocks online for two decades. Through FACTBASEDINVESTING.COM, Kenneth provides educational articles, news, market commentary, and other information regarding proven investment systems that work in good times and bad.
Comments contained in the body of this report are technical opinions only and are not necessarily those of Gruneisen Growth Corp. The material herein has been obtained from sources believed to be reliable and accurate, however, its accuracy and completeness cannot be guaranteed. Our firm, employees, and customers may effect transactions, including transactions contrary to any recommendation herein, or have positions in the securities mentioned herein or options with respect thereto. Any recommendation contained in this report may not be suitable for all investors and it is not to be deemed an offer or solicitation on our part with respect to the purchase or sale of any securities. |
|
 |
Defensive Groups and Biotechnology Index Rose
Kenneth J. Gruneisen - Passed the CAN SLIM® Master's Exam
The Bank Index ($BKX -0.82%) was a negative influence that created a drag on the major averages while the Broker/Dealer Index ($XBD +0.13%) eked out a tiny gain and the Retail Index ($RLX -0.01%) finished flat. The Networking Index ($NWX -0.67%), Internet Index ($IIX -0.23%), and the Semiconductor Index ($SOX -0.19%) each edged lower. Energy-related shares also had a slightly negative tilt as the Integrated Oil Index ($XOI -0.25%) and Oil Services Index ($OSX -0.04%) inched lower. The Biotechnology Index ($BTK +1.97%) was a standout gainer while defensive groups including the Healthcare Index ($HMO +0.25%) and the Gold & Silver Index ($XAU +0.79%) also rose.
Charts courtesy www.stockcharts.com
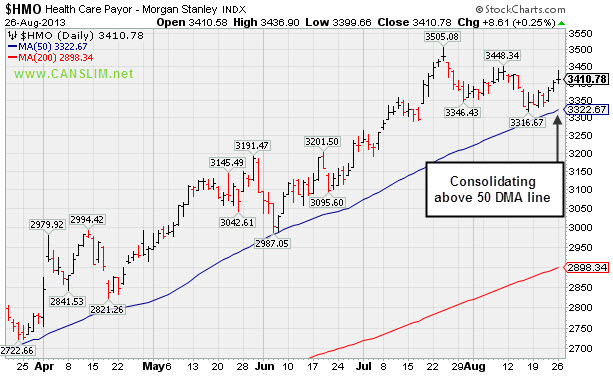
PICTURED: The Healthcare Index ($HMO +0.25%) is consolidating above its 50-day moving average (DMA) line.
| Oil Services |
$OSX |
261.41 |
-0.11 |
-0.04% |
+18.74% |
| Healthcare |
$HMO |
3,410.78 |
+8.61 |
+0.25% |
+35.66% |
| Integrated Oil |
$XOI |
1,368.29 |
-3.38 |
-0.25% |
+10.18% |
| Semiconductor |
$SOX |
462.92 |
-0.90 |
-0.19% |
+20.53% |
| Networking |
$NWX |
284.75 |
-1.91 |
-0.67% |
+25.69% |
| Internet |
$IIX |
400.93 |
-0.92 |
-0.23% |
+22.61% |
| Broker/Dealer |
$XBD |
134.81 |
+0.17 |
+0.13% |
+42.91% |
| Retail |
$RLX |
822.38 |
-0.05 |
-0.01% |
+25.93% |
| Gold & Silver |
$XAU |
112.27 |
+0.88 |
+0.79% |
-32.20% |
| Bank |
$BKX |
64.38 |
-0.53 |
-0.82% |
+25.55% |
| Biotech |
$BTK |
2,115.95 |
+40.78 |
+1.97% |
+36.77% |
|
|
|
 |
Wedging to New Highs Despite Market's Negative Drag
Kenneth J. Gruneisen - Passed the CAN SLIM® Master's Exam
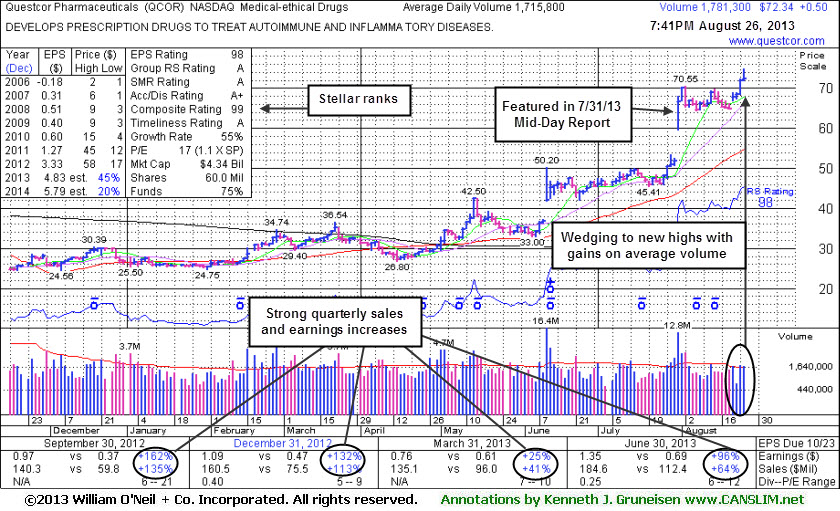
Questcor Pharmaceuticals (QCOR +$0.50 or +0.70% to $72.34) hit another new high today, bucking the mostly negative market. It is extended beyond its "max buy" level after rallying from a tight trading range. It held its ground stubbornly despite the broader market "correction" weighing against most stocks (M criteria) since its last appearance in this FSU section on 8/01/13 with an annotated graph under the headline, "Following Breakaway Gap Getting Extended Quickly". It was highlighted in yellow in the 7/31/13 mid-day report (read here) with a weekly graph which illustrated its powerful long-term breakout to new highs. The pivot point cited was based on its 7/09/12 high plus 10 cents, a prior high which is not shown on its annotated daily graph included below.
Regular readers may note that a "breakaway gap" has been noted many times in the past as one valid exception to the rule which limits investors from buying stocks at more than +5% above their prior chart high or pivot point. The newspaper and experts teaching the Certification suggest that in a very bullish market environment it is permissible to buy stocks as much as 10% above their prior highs when a stock stages a powerful breakaway gap. However, the risk of being stopped out with a -7% loss on an ordinary pullback increases the further above prior highs one purchases a stock, which why it is usually best to buy as near the pivot point as possible after a technical breakout. Patient investors may also watch for secondary buy points or new bases to possibly develop and be noted in the weeks ahead.
Considering its deep consolidation below its 200-day moving average (DMA) line over the past year, the technical breakout to new highs has the look of what could be the beginning of a substantial and sustained leg up. However, the quick pullback in its past also serves as a reminder for investors to always have a stop loss order in place or follow strict selling rules in the event of any damaging losses. It rebounded impressively from its September 2012 lows in the $17 area.
It reported earnings +96% on +64% sales for the Jun '13 quarter, continuing its streak of strong quarterly comparisons with solid sales revenues and earnings increases satisfy the C criteria of the fact-based system. Since a FY '09 downturn its annual earnings (A criteria) growth has been strong. The small supply (S criteria) of 60 million shares outstanding can contribute to greater price volatility in the event of institutional buying or selling. The number of top-rated funds owning its shares rose from 441 in Dec '12 to 471 in Jun '13, a reassuring sign concerning the I criteria. The Medical - Ethical Drugs group has an A rating and leadership in the group is an encouraging sign concerning the L criteria.
|
|
|
Color Codes Explained :
Y - Better candidates highlighted by our
staff of experts.
G - Previously featured
in past reports as yellow but may no longer be buyable under the
guidelines.
***Last / Change / Volume data in this table is the closing quote data***
Symbol/Exchange
Company Name
Industry Group |
PRICE |
CHANGE
(%Change) |
Day High |
Volume
(% DAV)
(% 50 day avg vol) |
52 Wk Hi
% From Hi |
Featured
Date |
Price
Featured |
Pivot Featured |
|
Max Buy |
BITA
-
NYSE
Bitauto Hldgs Ltd Ads
INTERNET - Internet Information Providers
|
$15.11
|
+0.18
1.21% |
$15.75
|
520,991
262.20% of 50 DAV
50 DAV is 198,700
|
$18.10
-16.52%
|
8/7/2013
|
$12.01
|
PP = $13.30
|
|
MB = $13.97
|
 Most Recent Note - 8/26/2013 11:57:16 AM
G - Found prompt support near prior highs. Consolidating well above its 50 DMA line. Disciplined investors always limit losses if any stock falls more than -7-8% from their purchase price.
>>> The latest Featured Stock Update with an annotated graph appeared on 8/7/2013. Click here.
View all notes |
Alert me of new notes |
CANSLIM.net Company Profile |
SEC |
Zacks Reports |
StockTalk |
News |
Chart |
Request a new note
C
A N
S L
I M


|
CELG
-
NASDAQ
Celgene Corp
DRUGS - Drug Manufacturers - Major
|
$141.16
|
+2.89
2.09% |
$142.97
|
2,575,582
100.63% of 50 DAV
50 DAV is 2,559,400
|
$149.92
-5.84%
|
7/11/2013
|
$133.25
|
PP = $131.92
|
|
MB = $138.52
|
Most Recent Note - 8/21/2013 9:42:54 PM
Y - Consolidating above prior highs in the $131 area coinciding with its 50 DMA line, defining important chart support. See the latest FSU analysis for more details and a new annotated graph.
>>> The latest Featured Stock Update with an annotated graph appeared on 8/21/2013. Click here.
View all notes |
Alert me of new notes |
CANSLIM.net Company Profile |
SEC |
Zacks Reports |
StockTalk |
News |
Chart |
Request a new note
C
A N
S L
I M
|
FLT
-
NYSE
Fleetcor Technologies
DIVERSIFIED SERVICES - Business/Management Services
|
$104.70
|
+1.88
1.83% |
$108.38
|
1,616,411
242.16% of 50 DAV
50 DAV is 667,500
|
$104.80
-0.10%
|
8/19/2013
|
$99.01
|
PP = $100.97
|
|
MB = $106.02
|
Most Recent Note - 8/26/2013 8:16:45 PM
Y- Rallied with above average volume again today for a new high. Rising from an advanced "3-weeks tight" base, albeit a riskier "late stage" base. Keep in mind the M criteria argues against new buying efforts until a new confirmed rally.
>>> The latest Featured Stock Update with an annotated graph appeared on 8/12/2013. Click here.
View all notes |
Alert me of new notes |
CANSLIM.net Company Profile |
SEC |
Zacks Reports |
StockTalk |
News |
Chart |
Request a new note
C
A N
S L
I M
|
GNRC
-
NYSE
Generac Hldgs Inc
CONSUMER DURABLES - Electronic Equipment
|
$42.26
|
+0.04
0.09% |
$42.72
|
390,458
36.54% of 50 DAV
50 DAV is 1,068,700
|
$44.30
-4.60%
|
7/30/2013
|
$42.60
|
PP = $42.10
|
|
MB = $44.21
|
Most Recent Note - 8/22/2013 5:46:33 PM
Y - Holding its ground stubbornly after it recently rallied from an advanced "3-weeks tight" base and priced a Secondary Offering. Disciplined investors always limit losses by selling if any stock falls more than -7% from its purchase price. See the latest FSU analysis for more details and a new annotated graph.
>>> The latest Featured Stock Update with an annotated graph appeared on 8/22/2013. Click here.
View all notes |
Alert me of new notes |
CANSLIM.net Company Profile |
SEC |
Zacks Reports |
StockTalk |
News |
Chart |
Request a new note
C
A N
S L
I M
|
KORS
-
NYSE
Michael Kors Hldgs Ltd
RETAIL - Apparel Stores
|
$72.57
|
+0.00
0.00% |
$73.59
|
1,769,598
50.18% of 50 DAV
50 DAV is 3,526,200
|
$72.98
-0.56%
|
8/6/2013
|
$69.66
|
PP = $66.28
|
|
MB = $69.59
|
Most Recent Note - 8/23/2013 6:50:01 PM
G - Finished at a new high close today with a 4th consecutive gain on below average volume. Prior highs in the $66 area define initial support to watch on pullbacks.
>>> The latest Featured Stock Update with an annotated graph appeared on 8/6/2013. Click here.
View all notes |
Alert me of new notes |
CANSLIM.net Company Profile |
SEC |
Zacks Reports |
StockTalk |
News |
Chart |
Request a new note
C
A N
S L
I M
|
Symbol/Exchange
Company Name
Industry Group |
PRICE |
CHANGE
(%Change) |
Day High |
Volume
(% DAV)
(% 50 day avg vol) |
52 Wk Hi
% From Hi |
Featured
Date |
Price
Featured |
Pivot Featured |
|
Max Buy |
LOPE
-
NASDAQ
Grand Canyon Education
DIVERSIFIED SERVICES - Education and; Training Services
|
$34.65
|
+0.57
1.67% |
$34.88
|
255,452
57.28% of 50 DAV
50 DAV is 446,000
|
$37.17
-6.78%
|
6/19/2013
|
$31.47
|
PP = $34.17
|
|
MB = $35.88
|
Most Recent Note - 8/21/2013 9:47:50 PM
G - Color code is changed to green as it has slumped below its 50 DMA line. Recently reported earnings +15% on +19% sales for the Jun '13 quarter, below the +25% minimum earnings guideline (C criteria), raising fundamental concerns.
>>> The latest Featured Stock Update with an annotated graph appeared on 8/14/2013. Click here.
View all notes |
Alert me of new notes |
CANSLIM.net Company Profile |
SEC |
Zacks Reports |
StockTalk |
News |
Chart |
Request a new note
C
A N
S L
I M
|
PCLN
-
NASDAQ
Priceline.Com Inc
INTERNET - Internet Software and Services
|
$949.54
|
-4.69
-0.49% |
$961.24
|
342,280
48.20% of 50 DAV
50 DAV is 710,100
|
$994.98
-4.57%
|
7/8/2013
|
$878.28
|
PP = $847.43
|
|
MB = $889.80
|
Most Recent Note - 8/23/2013 6:51:58 PM
G - Posted a 3rd consecutive gain on light volume, consolidating above prior highs, extended from any sound base. Reported earnings +24% on +27% sales revenues for the Jun '13 quarter, just under the +25% minimum earnings guideline (C criteria).
>>> The latest Featured Stock Update with an annotated graph appeared on 8/19/2013. Click here.
View all notes |
Alert me of new notes |
CANSLIM.net Company Profile |
SEC |
Zacks Reports |
StockTalk |
News |
Chart |
Request a new note
C
A N
S L
I M
|
PRAA
-
NASDAQ
Portfolio Recovery Assoc
DIVERSIFIED SERVICES - Business/Management Services
|
$55.26
|
-0.19
-0.34% |
$56.53
|
415,981
79.64% of 50 DAV
50 DAV is 522,300
|
$57.57
-4.01%
|
7/31/2013
|
$51.43
|
PP = $54.72
|
|
MB = $57.46
|
Most Recent Note - 8/21/2013 9:53:49 PM
Y - Holding its ground near prior highs with volume totals cooling in recent weeks. Any slump below its old high close ($53.86 on 6/17/13) would raise greater concerns as it would completely negate the recent technical breakout.
>>> The latest Featured Stock Update with an annotated graph appeared on 8/2/2013. Click here.
View all notes |
Alert me of new notes |
CANSLIM.net Company Profile |
SEC |
Zacks Reports |
StockTalk |
News |
Chart |
Request a new note
C
A N
S L
I M
|
PRLB
-
NYSE
Proto Labs Inc
MANUFACTURING - Small Tools and Accessories
|
$71.87
|
+0.76
1.07% |
$72.25
|
282,567
56.76% of 50 DAV
50 DAV is 497,800
|
$72.08
-0.29%
|
7/29/2013
|
$64.86
|
PP = $67.50
|
|
MB = $70.88
|
Most Recent Note - 8/26/2013 8:12:55 PM
Y - Inched to new highs with today's 6th consecutive gain on light volume. Found support above its 50 DMA line when consolidating recently.
>>> The latest Featured Stock Update with an annotated graph appeared on 8/5/2013. Click here.
View all notes |
Alert me of new notes |
CANSLIM.net Company Profile |
SEC |
Zacks Reports |
StockTalk |
News |
Chart |
Request a new note
C
A N
S L
I M
|
QCOR
-
NASDAQ
Questcor Pharmaceuticals
DRUGS - Biotechnology
|
$72.34
|
+0.50
0.70% |
$74.76
|
1,782,006
98.71% of 50 DAV
50 DAV is 1,805,300
|
$72.43
-0.12%
|
7/31/2013
|
$66.46
|
PP = $59.01
|
|
MB = $61.96
|
Most Recent Note - 8/26/2013 8:09:49 PM
G - Up today for another new high, bucking a mostly negative market. It is extended beyond its "max buy" level. See the latest FSU analysis for more details and a new annotated graph.
>>> The latest Featured Stock Update with an annotated graph appeared on 8/26/2013. Click here.
View all notes |
Alert me of new notes |
CANSLIM.net Company Profile |
SEC |
Zacks Reports |
StockTalk |
News |
Chart |
Request a new note
C
A N
S L
I M
|
Symbol/Exchange
Company Name
Industry Group |
PRICE |
CHANGE
(%Change) |
Day High |
Volume
(% DAV)
(% 50 day avg vol) |
52 Wk Hi
% From Hi |
Featured
Date |
Price
Featured |
Pivot Featured |
|
Max Buy |
SFUN
-
NYSE
Soufun Hldgs Ltd Ads A
INTERNET - Internet Information Providers
|
$38.43
|
+0.24
0.63% |
$39.00
|
289,989
58.17% of 50 DAV
50 DAV is 498,500
|
$42.15
-8.83%
|
7/16/2013
|
$29.54
|
PP = $27.90
|
|
MB = $29.30
|
Most Recent Note - 8/23/2013 12:36:54 PM
G - Pulling back from its 52-week high after getting very extended from its latest base. Prior reports cautioned - "Disciplined investors avoid chasing stocks too extended from sound bases."
>>> The latest Featured Stock Update with an annotated graph appeared on 8/8/2013. Click here.
View all notes |
Alert me of new notes |
CANSLIM.net Company Profile |
SEC |
Zacks Reports |
StockTalk |
News |
Chart |
Request a new note
C
A N
S L
I M
|
SSNC
-
NASDAQ
S S & C Technologies
COMPUTER SOFTWARE and SERVICES - Application Software
|
$36.31
|
+0.64
1.79% |
$36.55
|
257,700
61.44% of 50 DAV
50 DAV is 419,400
|
$38.80
-6.42%
|
7/11/2013
|
$35.80
|
PP = $34.54
|
|
MB = $36.27
|
Most Recent Note - 8/23/2013 6:53:34 PM
Y - Recently consolidating above its 50 DMA line and prior highs in the $34 area defining important support. Disciplined investors always limit losses if ever any stock falls more than -7% from their purchase price.
>>> The latest Featured Stock Update with an annotated graph appeared on 8/9/2013. Click here.
View all notes |
Alert me of new notes |
CANSLIM.net Company Profile |
SEC |
Zacks Reports |
StockTalk |
News |
Chart |
Request a new note
C
A N
S L
I M
|
SSYS
-
NASDAQ
Stratasys Ltd
COMPUTER HARDWARE - Computer Peripherals
|
$110.04
|
+4.22
3.99% |
$113.49
|
1,177,003
142.86% of 50 DAV
50 DAV is 823,900
|
$107.13
2.72%
|
7/8/2013
|
$91.44
|
PP = $95.00
|
|
MB = $99.75
|
Most Recent Note - 8/26/2013 12:17:59 PM
G - Considerable gap up gain today for another new 52-week high, getting more extended from its prior base. Prior highs in the $96 area define initial support to watch on pullbacks.
>>> The latest Featured Stock Update with an annotated graph appeared on 8/16/2013. Click here.
View all notes |
Alert me of new notes |
CANSLIM.net Company Profile |
SEC |
Zacks Reports |
StockTalk |
News |
Chart |
Request a new note
C
A N
S L
I M
|
STMP
-
NASDAQ
Stamps.Com Inc
INTERNET - Internet Software and Services
|
$41.80
|
-0.10
-0.24% |
$42.37
|
95,026
71.66% of 50 DAV
50 DAV is 132,600
|
$46.47
-10.05%
|
7/31/2013
|
$40.00
|
PP = $42.98
|
|
MB = $45.13
|
Most Recent Note - 8/23/2013 6:44:17 PM
Y - Recently found support at its 50 DMA line. See the latest FSU analysis for more details and a new annotated graph.
>>> The latest Featured Stock Update with an annotated graph appeared on 8/23/2013. Click here.
View all notes |
Alert me of new notes |
CANSLIM.net Company Profile |
SEC |
Zacks Reports |
StockTalk |
News |
Chart |
Request a new note
C
A N
S L
I M
|
VRX
-
NYSE
Valeant Pharmaceuticals
DRUGS - Drug Manufacturers - Other
|
$99.60
|
+0.08
0.08% |
$100.51
|
995,724
61.94% of 50 DAV
50 DAV is 1,607,600
|
$105.40
-5.50%
|
4/30/2013
|
$60.24
|
PP = $76.66
|
|
MB = $80.49
|
Most Recent Note - 8/23/2013 6:48:24 PM
G- Holding its ground -5.6% off its 52-week high. Reported earnings +33% on +34% sales revenues for the Jun '13 quarter, above the +25% minimum earnings guideline (C criteria).
>>> The latest Featured Stock Update with an annotated graph appeared on 8/15/2013. Click here.
View all notes |
Alert me of new notes |
CANSLIM.net Company Profile |
SEC |
Zacks Reports |
StockTalk |
News |
Chart |
Request a new note
C
A N
S L
I M
|
Symbol/Exchange
Company Name
Industry Group |
PRICE |
CHANGE
(%Change) |
Day High |
Volume
(% DAV)
(% 50 day avg vol) |
52 Wk Hi
% From Hi |
Featured
Date |
Price
Featured |
Pivot Featured |
|
Max Buy |
YNDX
-
NASDAQ
Yandex N V Class A
INTERNET - Internet Information Providers
|
$33.24
|
-0.20
-0.60% |
$33.76
|
1,064,844
42.82% of 50 DAV
50 DAV is 2,486,900
|
$34.79
-4.46%
|
7/10/2013
|
$29.29
|
PP = $29.59
|
|
MB = $31.07
|
Most Recent Note - 8/26/2013 8:14:57 PM
G - Volume totals have been cooling while consolidating neat its 52-week high in a tight range. Its 50 DMA line defines important near-term support to watch.
>>> The latest Featured Stock Update with an annotated graph appeared on 8/20/2013. Click here.
View all notes |
Alert me of new notes |
CANSLIM.net Company Profile |
SEC |
Zacks Reports |
StockTalk |
News |
Chart |
Request a new note
C
A N
S L
I M
|
|
|
|
THESE ARE NOT BUY RECOMMENDATIONS!
Comments contained in the body of this report are technical
opinions only. The material herein has been obtained
from sources believed to be reliable and accurate, however,
its accuracy and completeness cannot be guaranteed.
This site is not an investment advisor, hence it does
not endorse or recommend any securities or other investments.
Any recommendation contained in this report may not
be suitable for all investors and it is not to be deemed
an offer or solicitation on our part with respect to
the purchase or sale of any securities. All trademarks,
service marks and trade names appearing in this report
are the property of their respective owners, and are
likewise used for identification purposes only.
This report is a service available
only to active Paid Premium Members.
You may opt-out of receiving report notifications
at any time. Questions or comments may be submitted
by writing to Premium Membership Services 665 S.E. 10 Street, Suite 201 Deerfield Beach, FL 33441-5634 or by calling 1-800-965-8307
or 954-785-1121.
|
|
|

