You are not logged in.
This means you
CAN ONLY VIEW reports that were published prior to Monday, April 14, 2025.
You
MUST UPGRADE YOUR MEMBERSHIP if you want to see any current reports.
AFTER MARKET UPDATE - FRIDAY, AUGUST 24TH, 2012
Previous After Market Report Next After Market Report >>>
|
|
|
|
DOW |
+100.51 |
13,157.97 |
+0.77% |
|
Volume |
515,239,920 |
-13% |
|
Volume |
1,309,092,660 |
-3% |
|
NASDAQ |
+16.39 |
3,069.79 |
+0.54% |
|
Advancers |
1,900 |
61% |
|
Advancers |
1,507 |
59% |
|
S&P 500 |
+9.05 |
1,411.13 |
+0.65% |
|
Decliners |
1,048 |
34% |
|
Decliners |
921 |
36% |
|
Russell 2000 |
+3.19 |
809.19 |
+0.40% |
|
52 Wk Highs |
69 |
|
|
52 Wk Highs |
50 |
|
|
S&P 600 |
+1.55 |
455.93 |
+0.34% |
|
52 Wk Lows |
12 |
|
|
52 Wk Lows |
32 |
|
|
 |
Indices' Gains With Lighter Volume Trimmed Weekly Losses
Kenneth J. Gruneisen - Passed the CAN SLIM® Master's Exam
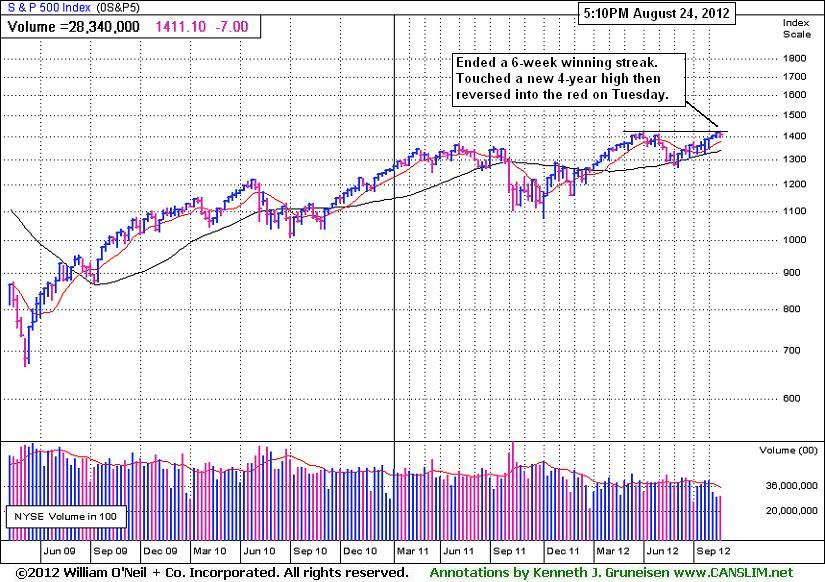
For the week, the Dow Jones Industrial Average lost -0.9%, the S&P 500 Index fell -0.5% to snap a six-week winning streak, and the tech-heavy Nasdaq Composite Index was lower by -0.2% gain. The major averages gained ground on Friday to trim their weekly losses. The volume totals behind Friday's gains were reported were lower on the NYSE and on the Nasdaq exchange versus the prior session totals, which hinted that institutional investors were not aggressively buying shares. Advancing issues led decliners by nearly a 2-1 margin on NYSE and by a 3-2 margin on the Nasdaq exchange. The total number of new 52-week highs led new 52-week lows on the NYSE on the Nasdaq exchange. There were 24 high-ranked companies from the CANSLIM.net Leaders List made new 52-week highs and appeared on the CANSLIM.net BreakOuts Page, up from the prior session total of 10 stocks. There were gains for 12 of the 20 high-ranked companies currently included on the Featured Stocks Page.
Europe weighed on the market after German Chancellor Merkel said Greece must stay on course with austerity measures to remain in the euro zone. ECB sources said the euro zone's central bank is considering setting yield band targets under a new bond-buying program.
A report on demand for goods provided some headwinds for stocks. Orders for capital goods, excluding defense and aircraft, dropped -3.4% in July. However, durable goods orders jumped +4.2% in July due to strong aircraft demand. The major averages recovered from Friday's earlier losses on a report that Fed Chairman Bernanke said there is room for further action to bolster growth, and attention will stay focused on next week's speech by Bernanke at the Fed’s annual meeting in Jackson Hole, Wyoming.
Technology was the worst performing group with software maker Autodesk Inc (ADSK -15.63%) pacing the decline after lowering its outlook. Material stocks also were under-performers with miner Freeport McMoRan Copper & Gold Inc (FCX -1.74%) falling. Health care was one of the better performing groups, led by Eli Lilly & Co (LLY +3.44%) after the drug maker shared results of its Alzheimer treatment.
In fixed income, Treasury prices were flat with the 10-year note unchanged to yield 1.68% and the 30-year bond gained 1/32 to yield 2.79%.
In terms of the M criteria, the major indices recently have been in a confirmed rally coupled with an expansion in leadership (stocks hitting new 52-week highs).
Watch for an announcement soon via email concerning new monthly webcasts starting in August and a new "Market's Leading Groups" archives tab to be added on the Premium Member Homepage. These changes are aimed at satisfying member requests and improving the service. If you have questions, comments or suggestions please let us know via the inquiry form here. The most recent WEBCAST (Q2 2012) is available "ON DEMAND" - CLICK HERE.
PICTURED: The S&P 500 Index snapped a six-week winning streak. It hit a new 4-year high on Tuesday, but reversed into the red on that session, and it ultimately fell -0.5% for the week.
|
 Kenneth J. Gruneisen started out as a licensed stockbroker in August 1987, a couple of months prior to the historic stock market crash that took the Dow Jones Industrial Average down -22.6% in a single day. He has published daily fact-based fundamental and technical analysis on high-ranked stocks online for two decades. Through FACTBASEDINVESTING.COM, Kenneth provides educational articles, news, market commentary, and other information regarding proven investment systems that work in good times and bad.
Comments contained in the body of this report are technical opinions only and are not necessarily those of Gruneisen Growth Corp. The material herein has been obtained from sources believed to be reliable and accurate, however, its accuracy and completeness cannot be guaranteed. Our firm, employees, and customers may effect transactions, including transactions contrary to any recommendation herein, or have positions in the securities mentioned herein or options with respect thereto. Any recommendation contained in this report may not be suitable for all investors and it is not to be deemed an offer or solicitation on our part with respect to the purchase or sale of any securities. |
|
 |
Retail, Financial, and Tech Groups Led Gains
Kenneth J. Gruneisen - Passed the CAN SLIM® Master's Exam
The Retail Index ($RLX +0.95%) rose and strength in financial shares gave the Bank Index ($BKX +0.60%) and Broker/Dealer Index ($XBD +0.80%) both a boost that underpinned the major averages' gains on Friday. The tech sector was mixed as the Biotechnology Index ($BTK +1.01%) and Semiconductor Index ($SOX +0.58%) outpaced the Internet Index ($IIX +0.25%), meanwhile the Networking Index ($NWX -0.86%) backpedaled. The Integrated Oil Index ($XOI +0.45%) posted a small gain while the Oil Services Index ($OSX +0.08%) and Gold & Silver Index ($XAU +0.05%) finished flat, and the Healthcare Index ($HMO -0.34%) edged lower.
Charts courtesy www.stockcharts.com
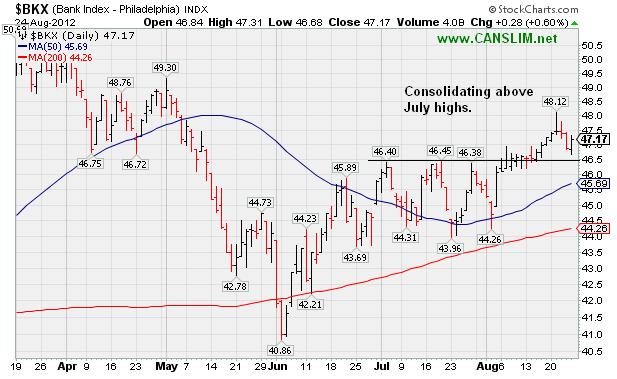
PICTURED 1: The Bank Index ($BKX +0.60%) is consolidating above its July highs and well above its 50-day and 200-day moving average (DMA) lines.
Charts courtesy www.stockcharts.com
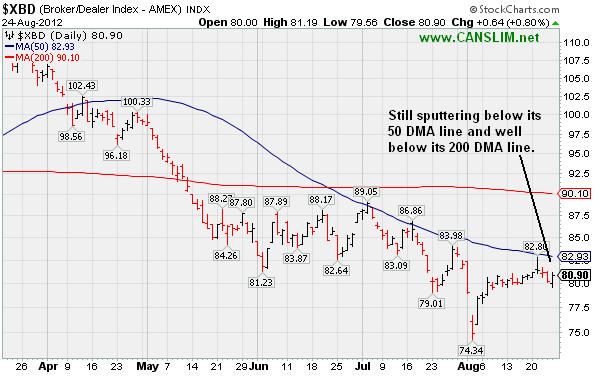
PICTURED 2: The Broker/Dealer Index ($XBD +0.80%) is still sputtering below its 50 DMA line and well below its 200 DMA line.
| Oil Services |
$OSX |
226.66 |
+0.18 |
+0.08% |
+4.80% |
| Healthcare |
$HMO |
2,383.58 |
-8.24 |
-0.34% |
+4.47% |
| Integrated Oil |
$XOI |
1,231.09 |
+5.51 |
+0.45% |
+0.16% |
| Semiconductor |
$SOX |
398.95 |
+2.29 |
+0.58% |
+9.47% |
| Networking |
$NWX |
209.65 |
-1.91 |
-0.90% |
-2.56% |
| Internet |
$IIX |
313.52 |
+0.70 |
+0.22% |
+11.28% |
| Broker/Dealer |
$XBD |
80.89 |
+0.63 |
+0.78% |
-2.86% |
| Retail |
$RLX |
644.98 |
+6.07 |
+0.95% |
+23.28% |
| Gold & Silver |
$XAU |
168.50 |
+0.09 |
+0.05% |
-6.72% |
| Bank |
$BKX |
47.17 |
+0.28 |
+0.60% |
+19.78% |
| Biotech |
$BTK |
1,469.83 |
+13.89 |
+0.95% |
+34.67% |
|
|
|
 |
Slump Below 50 DMA Line Hurts Outlook Again
Kenneth J. Gruneisen - Passed the CAN SLIM® Master's Exam
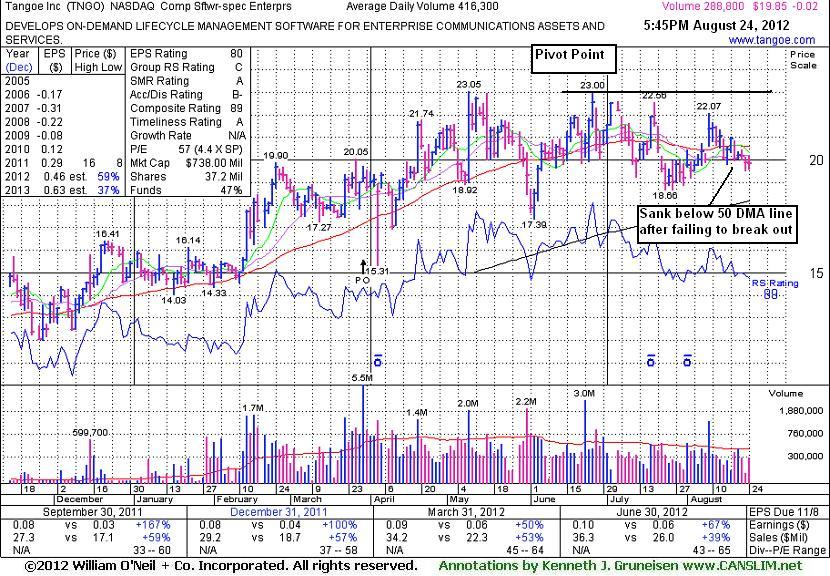
Tangoe Inc (TNGO -$0.02 or -0.10% to $19.85) recently slumped below its 50-day moving average (DMA) line after again failing to break out. It now faces resistance up to the $23 level which has been a stubborn resistance area in recent months. Prior noted repeatedly reminded members - "Volume-driven gains above its pivot point are needed to trigger a proper technical buy signal." A rebound above its 50 DMA line is needed for its technical stance and outlook to improve, meanwhile it may be vulnerable to greater damage. Its Relative Strength rank has been waning, however, one encouraging sign is that its current Up/Down Volume Ratio of 1.3 still hints that its shares have been under accumulation in the past 50 days.
TNGO had been dropped from the Featured Stocks list on 7/24/12 when it last appeared in this FSU section with an annotated graph under the headline, "Weak Action Hurts Outlook For Computer Software Firm Again". It was highlighted in yellow again in the 8/09/12 mid-day report, however, while tallying its only gain in recent history marked by above average volume. Rather than going on to produce a technical buy signal afterward it has sputtered. This week it slumped below its 50-day moving average (DMA) line, hurting its outlook and raising concerns. Its next support comes into play at its July low ($18.66) and then its 200 DMA line.
TNGO completed a new Public Offering on 3/29/12, and such offerings often help companies attract more institutional interest. The number of top-rated funds owning its shares rose from 99 in Sep '11 to 200 in Jun '12, a reassuring sign concerning the I criteria. The company's management reportedly still owns 20% of its shares, keeping the directors motivated to look after and build shareholder value. There still are only 29.7 million shares (S criteria) in the publicly traded float following the latest offering, which can lead to more drastic price volatility in the event of institutional buying or selling.
 |
|
|
Color Codes Explained :
Y - Better candidates highlighted by our
staff of experts.
G - Previously featured
in past reports as yellow but may no longer be buyable under the
guidelines.
***Last / Change / Volume data in this table is the closing quote data***
Symbol/Exchange
Company Name
Industry Group |
PRICE |
CHANGE
(%Change) |
Day High |
Volume
(% DAV)
(% 50 day avg vol) |
52 Wk Hi
% From Hi |
Featured
Date |
Price
Featured |
Pivot Featured |
|
Max Buy |
ALXN
-
NASDAQ
Alexion Pharmaceuticals
DRUGS - Drug Manufacturers - Other
|
$106.74
|
+3.04
2.93% |
$107.00
|
1,009,089
70.72% of 50 DAV
50 DAV is 1,426,800
|
$109.96
-2.93%
|
8/23/2012
|
$103.70
|
PP = $110.06
|
|
MB = $115.56
|
Most Recent Note - 8/23/2012 5:50:10 PM
Y - Color code is changed to yellow with new pivot point cited based on its 7/27/12 high plus 10 cents. Volume totals have been cooling in recent weeks while consolidating above support defined by its 50 DMA line. Subsequent volume-driven gains above its pivot point may trigger a new (or add-on) technical sell signal. See the latest FSU analysis for more details and a new annotated graph.
>>> The latest Featured Stock Update with an annotated graph appeared on 8/23/2012. Click here.
View all notes |
Alert me of new notes |
CANSLIM.net Company Profile |
SEC |
Zacks Reports |
StockTalk |
News |
Chart |
Request a new note
C
A N
S L
I M


|
ASPS
-
NASDAQ
Altisource Ptf Sltns Sa
REAL ESTATE - Property Management/Developmen
|
$84.10
|
-0.02
-0.02% |
$84.81
|
117,753
85.45% of 50 DAV
50 DAV is 137,800
|
$92.29
-8.87%
|
6/5/2012
|
$60.01
|
PP = $63.00
|
|
MB = $66.15
|
Most Recent Note - 8/22/2012 11:54:04 AM
G - Down a little more today following 2 consecutive losses with above average volume, retreating from its all-time high. It has been repeatedly noted - "Extended from its prior base, and its 50 DMA line defines near-term support to watch."
>>> The latest Featured Stock Update with an annotated graph appeared on 8/3/2012. Click here.
View all notes |
Alert me of new notes |
CANSLIM.net Company Profile |
SEC |
Zacks Reports |
StockTalk |
News |
Chart |
Request a new note
C
A N
S L
I M
|
CFNL
-
NASDAQ
Cardinal Financial Corp
BANKING - Regional - Southeast Banks
|
$12.93
|
+0.10
0.78% |
$13.01
|
22,217
31.38% of 50 DAV
50 DAV is 70,800
|
$13.30
-2.78%
|
8/17/2012
|
$12.84
|
PP = $13.31
|
|
MB = $13.98
|
Most Recent Note - 8/21/2012 5:10:25 PM
Y - Challenged its pivot point with today's 5th consecutive gain backed by below average volume. Subsequent volume-driven gains above its pivot point may trigger a new (or add-on) technical buy signal. See the latest FSU analysis for more details and a new annotated graph.
>>> The latest Featured Stock Update with an annotated graph appeared on 8/21/2012. Click here.
View all notes |
Alert me of new notes |
CANSLIM.net Company Profile |
SEC |
Zacks Reports |
StockTalk |
News |
Chart |
Request a new note
C
A N
S L
I M
|
CMCSA
-
NASDAQ
Comcast Corp Cl A
MEDIA - CATV Systems
|
$33.95
|
+0.01
0.01% |
$34.15
|
14,038,311
105.93% of 50 DAV
50 DAV is 13,252,900
|
$35.16
-3.44%
|
6/11/2012
|
$29.94
|
PP = $30.98
|
|
MB = $32.53
|
Most Recent Note - 8/22/2012 5:26:06 PM
G - Consolidating just -3.4% off its 52-week high today with volume totals below average in recent weeks indicating that few investors are exiting. Recently reported earnings +19% on +6% sales revenues for the Jun '12 quarter, below the fact-based investment system's +25% minimum guideline for the C criteria.
>>> The latest Featured Stock Update with an annotated graph appeared on 8/15/2012. Click here.
View all notes |
Alert me of new notes |
CANSLIM.net Company Profile |
SEC |
Zacks Reports |
StockTalk |
News |
Chart |
Request a new note
C
A N
S L
I M
|
DG
-
NYSE
Dollar General Corp
RETAIL - Discount, Variety Stores
|
$49.66
|
-0.05
-0.10% |
$50.21
|
2,419,623
78.06% of 50 DAV
50 DAV is 3,099,800
|
$56.04
-11.38%
|
7/16/2012
|
$54.68
|
PP = $56.14
|
|
MB = $58.95
|
Most Recent Note - 8/23/2012 2:44:46 PM
G - Up from the session's lows, it undercut its prior low ($49.42) after gapping down today for a damaging 4th consecutive loss. A rebound above its 50 DMA line is needed for its technical stance and outlook to improve.
>>> The latest Featured Stock Update with an annotated graph appeared on 8/16/2012. Click here.
View all notes |
Alert me of new notes |
CANSLIM.net Company Profile |
SEC |
Zacks Reports |
StockTalk |
News |
Chart |
Request a new note
C
A N
S L
I M
|
Symbol/Exchange
Company Name
Industry Group |
PRICE |
CHANGE
(%Change) |
Day High |
Volume
(% DAV)
(% 50 day avg vol) |
52 Wk Hi
% From Hi |
Featured
Date |
Price
Featured |
Pivot Featured |
|
Max Buy |
ECPG
-
NASDAQ
Encore Capital Group Inc
FINANCIAL SERVICES - Credit Services
|
$28.26
|
+0.23
0.82% |
$28.50
|
117,740
79.07% of 50 DAV
50 DAV is 148,900
|
$30.47
-7.25%
|
8/3/2012
|
$29.91
|
PP = $30.45
|
|
MB = $31.97
|
Most Recent Note - 8/21/2012 5:18:23 PM
Y - Pulled back today with above average volume, yet it remains just above its 50 DMA line and perched only -4.8% off its 52-week high. Completed a Secondary Offering on 8/08/12. Subsequent volume-driven gains for a close above its pivot point would trigger a technical buy signal.
>>> The latest Featured Stock Update with an annotated graph appeared on 8/6/2012. Click here.
View all notes |
Alert me of new notes |
CANSLIM.net Company Profile |
SEC |
Zacks Reports |
StockTalk |
News |
Chart |
Request a new note
C
A N
S L
I M
|
EXPE
-
NASDAQ
Expedia Inc
INTERNET - Internet Information Providers
|
$53.06
|
+0.77
1.47% |
$53.68
|
2,978,313
80.07% of 50 DAV
50 DAV is 3,719,700
|
$59.50
-10.82%
|
4/27/2012
|
$41.80
|
PP = $35.57
|
|
MB = $37.35
|
Most Recent Note - 8/20/2012 2:37:46 PM
G - Consolidating above prior highs and its 50 DMA line defining important near-term chart support in the $50 area.
>>> The latest Featured Stock Update with an annotated graph appeared on 8/14/2012. Click here.
View all notes |
Alert me of new notes |
CANSLIM.net Company Profile |
SEC |
Zacks Reports |
StockTalk |
News |
Chart |
Request a new note
C
A N
S L
I M
|
GPX
-
NYSE
G P Strategies Corp
DIVERSIFIED SERVICES - Education and Training Services
|
$19.90
|
+0.20
1.02% |
$20.05
|
86,643
113.41% of 50 DAV
50 DAV is 76,400
|
$20.30
-1.97%
|
6/29/2012
|
$18.01
|
PP = $18.15
|
|
MB = $19.06
|
Most Recent Note - 8/21/2012 5:21:27 PM
G - Perched near its 52-week high today, slightly extended from its prior base. Churning above average volume recently without making much meaningful price progress. Prior highs and its 50 DMA line define chart support in the $18 area.
>>> The latest Featured Stock Update with an annotated graph appeared on 8/7/2012. Click here.
View all notes |
Alert me of new notes |
CANSLIM.net Company Profile |
SEC |
Zacks Reports |
StockTalk |
News |
Chart |
Request a new note
C
A N
S L
I M
|
HMSY
-
NASDAQ
H M S Holdings Corp
COMPUTER SOFTWARE and SERVICES - Healthcare Information Service
|
$33.92
|
-1.34
-3.80% |
$34.22
|
3,138,402
349.92% of 50 DAV
50 DAV is 896,900
|
$37.19
-8.79%
|
7/27/2012
|
$33.91
|
PP = $34.83
|
|
MB = $36.57
|
 Most Recent Note - 8/24/2012 12:06:38 PM
G - Rebounding from earlier lows below its 50 DMA line after gapping down today for a damaging loss with heavy volume. Color code was changed to green as weak technical action raised concerns. Distributional action was previously noted after recent gains lacked sufficient volume conviction to trigger a proper technical buy signal.
>>> The latest Featured Stock Update with an annotated graph appeared on 8/22/2012. Click here.
View all notes |
Alert me of new notes |
CANSLIM.net Company Profile |
SEC |
Zacks Reports |
StockTalk |
News |
Chart |
Request a new note
C
A N
S L
I M
|
LKQ
-
NASDAQ
L K Q Corp
WHOLESALE - Auto Parts
|
$38.31
|
-0.66
-1.69% |
$39.19
|
470,410
61.06% of 50 DAV
50 DAV is 770,400
|
$39.20
-2.27%
|
8/9/2012
|
$37.93
|
PP = $37.44
|
|
MB = $39.31
|
Most Recent Note - 8/22/2012 5:29:12 PM
Y - Holding its ground today perched at its 52-week high yet still trading below its "max buy" level. Prior highs in the $37 area define initial support to watch above its 50 DMA line.
>>> The latest Featured Stock Update with an annotated graph appeared on 8/10/2012. Click here.
View all notes |
Alert me of new notes |
CANSLIM.net Company Profile |
SEC |
Zacks Reports |
StockTalk |
News |
Chart |
Request a new note
C
A N
S L
I M
|
Symbol/Exchange
Company Name
Industry Group |
PRICE |
CHANGE
(%Change) |
Day High |
Volume
(% DAV)
(% 50 day avg vol) |
52 Wk Hi
% From Hi |
Featured
Date |
Price
Featured |
Pivot Featured |
|
Max Buy |
MIDD
-
NASDAQ
Middleby Corp
MANUFACTURING - Diversified Machinery
|
$112.42
|
+0.32
0.29% |
$113.10
|
73,004
73.74% of 50 DAV
50 DAV is 99,000
|
$119.74
-6.11%
|
8/9/2012
|
$118.60
|
PP = $104.92
|
|
MB = $110.17
|
Most Recent Note - 8/20/2012 2:39:34 PM
G - Quietly consolidating, holding its ground today near its 52-week high. Prior highs in the $104 area define initial support to watch on pullbacks.
>>> The latest Featured Stock Update with an annotated graph appeared on 8/13/2012. Click here.
View all notes |
Alert me of new notes |
CANSLIM.net Company Profile |
SEC |
Zacks Reports |
StockTalk |
News |
Chart |
Request a new note
C
A N
S L
I M
|
N
-
NYSE
Netsuite Inc
DIVERSIFIED SERVICES - Business/Management Services
|
$55.80
|
+0.22
0.40% |
$56.01
|
331,158
45.21% of 50 DAV
50 DAV is 732,500
|
$59.22
-5.78%
|
8/20/2012
|
$55.88
|
PP = $59.32
|
|
MB = $62.29
|
Most Recent Note - 8/20/2012 6:06:22 PM
Y - Color code is changed to yellow with new pivot point cited based on its 8/07/12 high plus 10 cents after several tight weekly closes. Consolidating -5.6% off its 52-week high today with volume totals cooling in recent weeks. See latest FSU analysis for more details and a new annotated graph.
>>> The latest Featured Stock Update with an annotated graph appeared on 8/20/2012. Click here.
View all notes |
Alert me of new notes |
CANSLIM.net Company Profile |
SEC |
Zacks Reports |
StockTalk |
News |
Chart |
Request a new note
C
A N
S L
I M
|
NSM
-
NYSE
Nationstar Mtg Hldgs Inc
FINANCIAL SERVICES - Credit Services
|
$25.85
|
-0.01
-0.04% |
$26.71
|
897,011
109.54% of 50 DAV
50 DAV is 818,900
|
$28.75
-10.09%
|
6/27/2012
|
$20.29
|
PP = $20.46
|
|
MB = $21.48
|
Most Recent Note - 8/22/2012 3:56:49 PM
G - Down today for a 4th consecutive loss since hitting its 52-week high. It is extended from any sound base pattern. Prior highs in the $25 area define near-term support to watch on pullbacks.
>>> The latest Featured Stock Update with an annotated graph appeared on 8/1/2012. Click here.
View all notes |
Alert me of new notes |
CANSLIM.net Company Profile |
SEC |
Zacks Reports |
StockTalk |
News |
Chart |
Request a new note
C
A N
S L
I M
|
OSIS
-
NASDAQ
O S I Systems Inc
ELECTRONICS - Semiconductor Equipment and Mate
|
$73.54
|
+0.11
0.15% |
$73.94
|
39,553
34.60% of 50 DAV
50 DAV is 114,300
|
$75.00
-1.95%
|
8/9/2012
|
$67.71
|
PP = $67.48
|
|
MB = $70.85
|
Most Recent Note - 8/22/2012 5:30:52 PM
G - Hovering near its 52-week high with volume totals cooling. It is slightly extended from its previous base, and prior highs in the $67-68 area define initial support to watch on pullbacks.
>>> The latest Featured Stock Update with an annotated graph appeared on 8/9/2012. Click here.
View all notes |
Alert me of new notes |
CANSLIM.net Company Profile |
SEC |
Zacks Reports |
StockTalk |
News |
Chart |
Request a new note
C
A N
S L
I M
|
RNF
-
NYSE
Rentech Nitrogen Ptnr Lp
CHEMICALS - Agricultural Chemicals
|
$33.01
|
-0.24
-0.72% |
$33.25
|
202,522
45.93% of 50 DAV
50 DAV is 440,900
|
$34.75
-5.01%
|
7/27/2012
|
$29.58
|
PP = $30.60
|
|
MB = $32.13
|
Most Recent Note - 8/21/2012 5:15:12 PM
G - Finished near the session low today with a loss on lighter volume. Encountered distributional pressure after its prior breakout yet found support above prior highs in the $30-31 and then wedged higher.
>>> The latest Featured Stock Update with an annotated graph appeared on 7/31/2012. Click here.
View all notes |
Alert me of new notes |
CANSLIM.net Company Profile |
SEC |
Zacks Reports |
StockTalk |
News |
Chart |
Request a new note
C
A N
S L
I M
|
Symbol/Exchange
Company Name
Industry Group |
PRICE |
CHANGE
(%Change) |
Day High |
Volume
(% DAV)
(% 50 day avg vol) |
52 Wk Hi
% From Hi |
Featured
Date |
Price
Featured |
Pivot Featured |
|
Max Buy |
SWI
-
NYSE
Solarwinds Inc
COMPUTER SOFTWARE and SERVICES - Application Software
|
$54.59
|
-0.18
-0.33% |
$54.87
|
793,426
65.05% of 50 DAV
50 DAV is 1,219,700
|
$56.94
-4.13%
|
7/25/2012
|
$47.82
|
PP = $47.89
|
|
MB = $50.28
|
Most Recent Note - 8/20/2012 4:20:00 PM
G - Volume totals have been cooling in recent weeks while still hovering near its all-time high. Prior highs in the $48 area define initial support to watch on pullbacks.
>>> The latest Featured Stock Update with an annotated graph appeared on 7/30/2012. Click here.
View all notes |
Alert me of new notes |
CANSLIM.net Company Profile |
SEC |
Zacks Reports |
StockTalk |
News |
Chart |
Request a new note
C
A N
S L
I M
|
TDG
-
NYSE
Transdigm Group Inc
AEROSPACE/DEFENSE - Aerospace/Defense Products and; Services
|
$138.56
|
+1.98
1.45% |
$139.25
|
278,027
66.12% of 50 DAV
50 DAV is 420,500
|
$139.37
-0.58%
|
8/16/2012
|
$132.23
|
PP = $136.44
|
|
MB = $143.26
|
Most Recent Note - 8/23/2012 2:49:14 PM
Y - Holding its ground today perched just above its pivot point and only -1.9% off its 52-week high. Volume totals have cooled since its gain on 8/17/12 triggered a technical buy signal. Disciplined investors limit losses if ever any stock falls -7% from their purchase price.
>>> The latest Featured Stock Update with an annotated graph appeared on 8/17/2012. Click here.
View all notes |
Alert me of new notes |
CANSLIM.net Company Profile |
SEC |
Zacks Reports |
StockTalk |
News |
Chart |
Request a new note
C
A N
S L
I M
|
TNGO
-
NASDAQ
Tangoe Inc
COMPUTER SOFTWARE and SERVICES - Technical and System Software
|
$19.85
|
-0.02
-0.10% |
$20.18
|
289,001
69.42% of 50 DAV
50 DAV is 416,300
|
$23.05
-13.88%
|
8/9/2012
|
$21.30
|
PP = $23.10
|
|
MB = $24.26
|
Most Recent Note - 8/24/2012 6:10:46 PM
G - Slump below its 50 DMA line this week hurt its outlook. Faces resistance up to the $23 level which has been a stubborn resistance area in recent months. See the latest FSU analysis for more details and a new annotated graph.
>>> The latest Featured Stock Update with an annotated graph appeared on 8/24/2012. Click here.
View all notes |
Alert me of new notes |
CANSLIM.net Company Profile |
SEC |
Zacks Reports |
StockTalk |
News |
Chart |
Request a new note
C
A N
S L
I M
|
VSI
-
NYSE
Vitamin Shoppe Inc
SPECIALTY RETAIL - Specialty Retail, Other
|
$53.60
|
+0.28
0.53% |
$53.84
|
273,082
66.25% of 50 DAV
50 DAV is 412,200
|
$61.83
-13.30%
|
6/29/2012
|
$54.93
|
PP = $55.03
|
|
MB = $57.78
|
Most Recent Note - 8/23/2012 2:53:36 PM
G - Slumping below its 50 DMA line this week with a spurt of damaging losses triggering technical sell signals. Its prior low ($52.41 on 7/23/12) defines a near-term support level where any further deterioration would raise more serious concerns.
>>> The latest Featured Stock Update with an annotated graph appeared on 8/2/2012. Click here.
View all notes |
Alert me of new notes |
CANSLIM.net Company Profile |
SEC |
Zacks Reports |
StockTalk |
News |
Chart |
Request a new note
C
A N
S L
I M
|
WPI
-
NYSE
Watson Pharmaceuticals
DRUGS - Drugs - Generic
|
$83.32
|
+4.69
5.96% |
$83.83
|
3,162,745
243.21% of 50 DAV
50 DAV is 1,300,400
|
$81.00
2.86%
|
8/24/2012
|
$82.90
|
PP = $81.10
|
|
MB = $85.16
|
Most Recent Note - 8/24/2012 5:41:29 PM
Y - Finished the session with a solid gain above its pivot point backed by +143% above average volume, triggering a technical buy signal while rallying from a very tight trading range where volume totals had cooled for several weeks. It was highlighted in yellow in the earlier mid-day report with a pivot point based on its 7/26/12 high plus 10 cents. The considerable gain with above average volume followed news that its generic Lidoderm(R) received FDA approval, an encouraging development concerning the N criteria. The 5/09/12 mid-day report noted - "Its improved fundamentals make it a worthy candidate for investors' watchlists. Sales revenues showed impressive acceleration while the 3 latest quarterly comparisons through Mar '12 showed earnings increases above the +25% guideline satisfying the C criteria. It also has maintained a strong annual earnings (A criteria) history."

There are no Featured Stock Updates™ available for this stock at this time. You may request one by clicking the Request a New Note link below
View all notes |
Alert me of new notes |
CANSLIM.net Company Profile |
SEC |
Zacks Reports |
StockTalk |
News |
Chart |
Request a new note
C
A N
S L
I M
|
Symbol/Exchange
Company Name
Industry Group |
PRICE |
CHANGE
(%Change) |
Day High |
Volume
(% DAV)
(% 50 day avg vol) |
52 Wk Hi
% From Hi |
Featured
Date |
Price
Featured |
Pivot Featured |
|
Max Buy |
|
|
|
THESE ARE NOT BUY RECOMMENDATIONS!
Comments contained in the body of this report are technical
opinions only. The material herein has been obtained
from sources believed to be reliable and accurate, however,
its accuracy and completeness cannot be guaranteed.
This site is not an investment advisor, hence it does
not endorse or recommend any securities or other investments.
Any recommendation contained in this report may not
be suitable for all investors and it is not to be deemed
an offer or solicitation on our part with respect to
the purchase or sale of any securities. All trademarks,
service marks and trade names appearing in this report
are the property of their respective owners, and are
likewise used for identification purposes only.
This report is a service available
only to active Paid Premium Members.
You may opt-out of receiving report notifications
at any time. Questions or comments may be submitted
by writing to Premium Membership Services 665 S.E. 10 Street, Suite 201 Deerfield Beach, FL 33441-5634 or by calling 1-800-965-8307
or 954-785-1121.
|
|
|

