***Last / Change / Volume data in this table is the closing quote data***
Symbol/Exchange
Company Name
Industry Group |
PRICE |
CHANGE
(%Change) |
Day High |
Volume
(% DAV)
(% 50 day avg vol) |
52 Wk Hi
% From Hi |
Featured
Date |
Price
Featured |
Pivot Featured |
|
Max Buy |
ALXN
-
NASDAQ
Alexion Pharmaceuticals
DRUGS - Drug Manufacturers - Other
|
$106.94
|
+0.20
0.19% |
$107.58
|
1,016,571
71.63% of 50 DAV
50 DAV is 1,419,100
|
$109.96
-2.75%
|
8/23/2012
|
$103.70
|
PP = $110.06
|
|
MB = $115.56
|
Most Recent Note - 8/23/2012 5:50:10 PM
Y - Color code is changed to yellow with new pivot point cited based on its 7/27/12 high plus 10 cents. Volume totals have been cooling in recent weeks while consolidating above support defined by its 50 DMA line. Subsequent volume-driven gains above its pivot point may trigger a new (or add-on) technical sell signal. See the latest FSU analysis for more details and a new annotated graph.
>>> The latest Featured Stock Update with an annotated graph appeared on 8/23/2012. Click here.
View all notes |
Alert me of new notes |
CANSLIM.net Company Profile |
SEC |
Zacks Reports |
StockTalk |
News |
Chart |
Request a new note
C
A N
S L
I M


|
ASPS
-
NASDAQ
Altisource Ptf Sltns Sa
REAL ESTATE - Property Management/Developmen
|
$84.45
|
+0.35
0.42% |
$85.39
|
149,069
108.97% of 50 DAV
50 DAV is 136,800
|
$92.29
-8.49%
|
6/5/2012
|
$60.01
|
PP = $63.00
|
|
MB = $66.15
|
 Most Recent Note - 8/27/2012 3:31:20 PM
G - Above average volume was behind losses last week while retreating from its all-time high. It has been repeatedly noted - "Extended from its prior base, and its 50 DMA line defines near-term support to watch."
>>> The latest Featured Stock Update with an annotated graph appeared on 8/3/2012. Click here.
View all notes |
Alert me of new notes |
CANSLIM.net Company Profile |
SEC |
Zacks Reports |
StockTalk |
News |
Chart |
Request a new note
C
A N
S L
I M
|
CFNL
-
NASDAQ
Cardinal Financial Corp
BANKING - Regional - Southeast Banks
|
$12.93
|
+0.00
0.00% |
$13.11
|
49,717
71.13% of 50 DAV
50 DAV is 69,900
|
$13.30
-2.78%
|
8/17/2012
|
$12.84
|
PP = $13.31
|
|
MB = $13.98
|
Most Recent Note - 8/27/2012 3:33:39 PM
Y - Volume totals have been cooling since recently featured, even while briefly touching a new 52-week high last week. Volume-driven gains above its pivot point may trigger a new (or add-on) technical buy signal, meanwhile its 50 DMA line defines important support.
>>> The latest Featured Stock Update with an annotated graph appeared on 8/21/2012. Click here.
View all notes |
Alert me of new notes |
CANSLIM.net Company Profile |
SEC |
Zacks Reports |
StockTalk |
News |
Chart |
Request a new note
C
A N
S L
I M
|
CMCSA
-
NASDAQ
Comcast Corp Cl A
MEDIA - CATV Systems
|
$33.97
|
+0.02
0.06% |
$34.09
|
8,767,702
66.30% of 50 DAV
50 DAV is 13,225,100
|
$35.16
-3.38%
|
6/11/2012
|
$29.94
|
PP = $30.98
|
|
MB = $32.53
|
Most Recent Note - 8/22/2012 5:26:06 PM
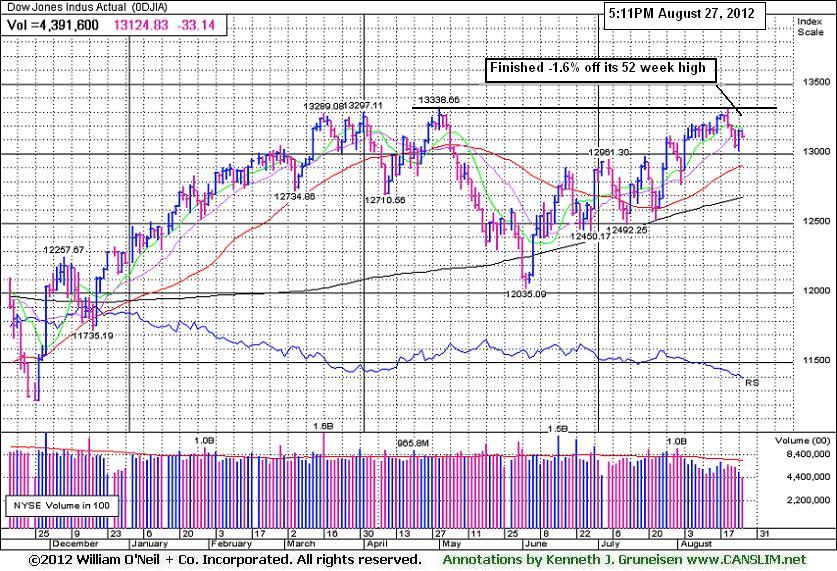
G - Consolidating just -3.4% off its 52-week high today with volume totals below average in recent weeks indicating that few investors are exiting. Recently reported earnings +19% on +6% sales revenues for the Jun '12 quarter, below the fact-based investment system's +25% minimum guideline for the C criteria.
>>> The latest Featured Stock Update with an annotated graph appeared on 8/15/2012. Click here.
View all notes |
Alert me of new notes |
CANSLIM.net Company Profile |
SEC |
Zacks Reports |
StockTalk |
News |
Chart |
Request a new note
C
A N
S L
I M
|
DG
-
NYSE
Dollar General Corp
RETAIL - Discount, Variety Stores
|
$48.85
|
-0.81
-1.63% |
$49.72
|
4,674,878
152.98% of 50 DAV
50 DAV is 3,055,800
|
$56.04
-12.83%
|
7/16/2012
|
$54.68
|
PP = $56.14
|
|
MB = $58.95
|
Most Recent Note - 8/23/2012 2:44:46 PM
G - Up from the session's lows, it undercut its prior low ($49.42) after gapping down today for a damaging 4th consecutive loss. A rebound above its 50 DMA line is needed for its technical stance and outlook to improve.
>>> The latest Featured Stock Update with an annotated graph appeared on 8/16/2012. Click here.
View all notes |
Alert me of new notes |
CANSLIM.net Company Profile |
SEC |
Zacks Reports |
StockTalk |
News |
Chart |
Request a new note
C
A N
S L
I M
|
Symbol/Exchange
Company Name
Industry Group |
PRICE |
CHANGE
(%Change) |
Day High |
Volume
(% DAV)
(% 50 day avg vol) |
52 Wk Hi
% From Hi |
Featured
Date |
Price
Featured |
Pivot Featured |
|
Max Buy |
ECPG
-
NASDAQ
Encore Capital Group Inc
FINANCIAL SERVICES - Credit Services
|
$28.05
|
-0.21
-0.74% |
$28.49
|
63,360
42.49% of 50 DAV
50 DAV is 149,100
|
$30.47
-7.94%
|
8/3/2012
|
$29.91
|
PP = $30.45
|
|
MB = $31.97
|
Most Recent Note - 8/27/2012 3:29:37 PM
G - Color code is changed to green while sputtering below its 50 DMA line and -8% off its 52-week high today. Completed a Secondary Offering on 8/08/12. Gains above its 50 DMA line are needed for its outlook to improve.
>>> The latest Featured Stock Update with an annotated graph appeared on 8/6/2012. Click here.
View all notes |
Alert me of new notes |
CANSLIM.net Company Profile |
SEC |
Zacks Reports |
StockTalk |
News |
Chart |
Request a new note
C
A N
S L
I M
|
EXPE
-
NASDAQ
Expedia Inc
INTERNET - Internet Information Providers
|
$52.18
|
-0.88
-1.66% |
$53.36
|
2,056,233
55.38% of 50 DAV
50 DAV is 3,713,200
|
$59.50
-12.30%
|
4/27/2012
|
$41.80
|
PP = $35.57
|
|
MB = $37.35
|
Most Recent Note - 8/27/2012 3:14:08 PM
G - Volume totals have been below average while recently consolidating above prior highs and its 50 DMA line defining important near-term chart support in the $50 area.
>>> The latest Featured Stock Update with an annotated graph appeared on 8/14/2012. Click here.
View all notes |
Alert me of new notes |
CANSLIM.net Company Profile |
SEC |
Zacks Reports |
StockTalk |
News |
Chart |
Request a new note
C
A N
S L
I M
|
GPX
-
NYSE
G P Strategies Corp
DIVERSIFIED SERVICES - Education and Training Services
|
$20.06
|
+0.16
0.80% |
$20.27
|
79,463
102.67% of 50 DAV
50 DAV is 77,400
|
$20.30
-1.18%
|
6/29/2012
|
$18.01
|
PP = $18.15
|
|
MB = $19.06
|
Most Recent Note - 8/27/2012 12:20:04 PM
G - Still perched near its 52-week high today, slightly extended from its prior base. Churned above average volume recently without making much meaningful price progress, a sign of distributional pressure. Prior highs and its 50 DMA line define chart support in the $18 area.
>>> The latest Featured Stock Update with an annotated graph appeared on 8/7/2012. Click here.
View all notes |
Alert me of new notes |
CANSLIM.net Company Profile |
SEC |
Zacks Reports |
StockTalk |
News |
Chart |
Request a new note
C
A N
S L
I M
|
HMSY
-
NASDAQ
H M S Holdings Corp
COMPUTER SOFTWARE and SERVICES - Healthcare Information Service
|
$34.08
|
+0.16
0.47% |
$34.59
|
816,891
86.47% of 50 DAV
50 DAV is 944,700
|
$37.19
-8.36%
|
7/27/2012
|
$33.91
|
PP = $34.83
|
|
MB = $36.57
|
Most Recent Note - 8/24/2012 12:06:38 PM
G - Rebounding from earlier lows below its 50 DMA line after gapping down today for a damaging loss with heavy volume. Color code was changed to green as weak technical action raised concerns. Distributional action was previously noted after recent gains lacked sufficient volume conviction to trigger a proper technical buy signal.
>>> The latest Featured Stock Update with an annotated graph appeared on 8/22/2012. Click here.
View all notes |
Alert me of new notes |
CANSLIM.net Company Profile |
SEC |
Zacks Reports |
StockTalk |
News |
Chart |
Request a new note
C
A N
S L
I M
|
LKQ
-
NASDAQ
L K Q Corp
WHOLESALE - Auto Parts
|
$38.01
|
-0.30
-0.78% |
$38.60
|
402,723
52.18% of 50 DAV
50 DAV is 771,800
|
$39.20
-3.04%
|
8/9/2012
|
$37.93
|
PP = $37.44
|
|
MB = $39.31
|
Most Recent Note - 8/22/2012 5:29:12 PM
Y - Holding its ground today perched at its 52-week high yet still trading below its "max buy" level. Prior highs in the $37 area define initial support to watch above its 50 DMA line.
>>> The latest Featured Stock Update with an annotated graph appeared on 8/10/2012. Click here.
View all notes |
Alert me of new notes |
CANSLIM.net Company Profile |
SEC |
Zacks Reports |
StockTalk |
News |
Chart |
Request a new note
C
A N
S L
I M
|
Symbol/Exchange
Company Name
Industry Group |
PRICE |
CHANGE
(%Change) |
Day High |
Volume
(% DAV)
(% 50 day avg vol) |
52 Wk Hi
% From Hi |
Featured
Date |
Price
Featured |
Pivot Featured |
|
Max Buy |
MIDD
-
NASDAQ
Middleby Corp
MANUFACTURING - Diversified Machinery
|
$112.69
|
+0.27
0.24% |
$113.73
|
76,204
76.97% of 50 DAV
50 DAV is 99,000
|
$119.74
-5.89%
|
8/9/2012
|
$118.60
|
PP = $104.92
|
|
MB = $110.17
|
Most Recent Note - 8/27/2012 3:15:52 PM
G - Still quietly consolidating -5.9% off its 52-week high today. Prior highs in the $104 area define initial support to watch on pullbacks.
>>> The latest Featured Stock Update with an annotated graph appeared on 8/13/2012. Click here.
View all notes |
Alert me of new notes |
CANSLIM.net Company Profile |
SEC |
Zacks Reports |
StockTalk |
News |
Chart |
Request a new note
C
A N
S L
I M
|
N
-
NYSE
Netsuite Inc
DIVERSIFIED SERVICES - Business/Management Services
|
$55.57
|
-0.23
-0.41% |
$56.49
|
354,058
48.35% of 50 DAV
50 DAV is 732,300
|
$59.22
-6.16%
|
8/20/2012
|
$55.88
|
PP = $59.32
|
|
MB = $62.29
|
Most Recent Note - 8/27/2012 3:18:14 PM
Y - Volume totals have been cooling while consolidating in a tight range near its 52-week high. A volume-driven gain above its pivot point may trigger a new (or add-on) technical buy signal. Meanwhile, its 50 DMA line defines important near-term support.
>>> The latest Featured Stock Update with an annotated graph appeared on 8/20/2012. Click here.
View all notes |
Alert me of new notes |
CANSLIM.net Company Profile |
SEC |
Zacks Reports |
StockTalk |
News |
Chart |
Request a new note
C
A N
S L
I M
|
NSM
-
NYSE
Nationstar Mtg Hldgs Inc
FINANCIAL SERVICES - Credit Services
|
$25.90
|
+0.05
0.19% |
$26.05
|
1,184,246
144.92% of 50 DAV
50 DAV is 817,200
|
$28.75
-9.91%
|
6/27/2012
|
$20.29
|
PP = $20.46
|
|
MB = $21.48
|
Most Recent Note - 8/27/2012 3:21:10 PM
G - Overcame earlier weakness and managed a positive reversal from today's lows following a streak of 6 consecutive losses from its 52-week high. It is extended from any sound base pattern. Prior highs in the $25 area define near-term support to watch on pullbacks.
>>> The latest Featured Stock Update with an annotated graph appeared on 8/1/2012. Click here.
View all notes |
Alert me of new notes |
CANSLIM.net Company Profile |
SEC |
Zacks Reports |
StockTalk |
News |
Chart |
Request a new note
C
A N
S L
I M
|
OSIS
-
NASDAQ
O S I Systems Inc
ELECTRONICS - Semiconductor Equipment and Mate
|
$73.66
|
+0.12
0.16% |
$73.90
|
73,151
64.34% of 50 DAV
50 DAV is 113,700
|
$75.00
-1.79%
|
8/9/2012
|
$67.71
|
PP = $67.48
|
|
MB = $70.85
|
Most Recent Note - 8/27/2012 3:22:13 PM
G - Still hovering near its 52-week high in a tight trading range with volume totals cooling. It is slightly extended from its previous base, and prior highs in the $67-68 area define initial support to watch on pullbacks.
>>> The latest Featured Stock Update with an annotated graph appeared on 8/9/2012. Click here.
View all notes |
Alert me of new notes |
CANSLIM.net Company Profile |
SEC |
Zacks Reports |
StockTalk |
News |
Chart |
Request a new note
C
A N
S L
I M
|
RNF
-
NYSE
Rentech Nitrogen Ptnr Lp
CHEMICALS - Agricultural Chemicals
|
$32.88
|
-0.13
-0.39% |
$33.34
|
248,956
56.27% of 50 DAV
50 DAV is 442,400
|
$34.75
-5.38%
|
7/27/2012
|
$29.58
|
PP = $30.60
|
|
MB = $32.13
|
Most Recent Note - 8/27/2012 3:24:35 PM
G - Holding its ground with volume totals cooling in recent weeks. It remains slightly extended from its prior base. Near-term support is at prior highs in the $30-31 area and its 50 DMA line.
>>> The latest Featured Stock Update with an annotated graph appeared on 7/31/2012. Click here.
View all notes |
Alert me of new notes |
CANSLIM.net Company Profile |
SEC |
Zacks Reports |
StockTalk |
News |
Chart |
Request a new note
C
A N
S L
I M
|
Symbol/Exchange
Company Name
Industry Group |
PRICE |
CHANGE
(%Change) |
Day High |
Volume
(% DAV)
(% 50 day avg vol) |
52 Wk Hi
% From Hi |
Featured
Date |
Price
Featured |
Pivot Featured |
|
Max Buy |
SWI
-
NYSE
Solarwinds Inc
COMPUTER SOFTWARE and SERVICES - Application Software
|
$54.27
|
-0.32
-0.59% |
$55.11
|
803,674
65.70% of 50 DAV
50 DAV is 1,223,200
|
$56.94
-4.69%
|
7/25/2012
|
$47.82
|
PP = $47.89
|
|
MB = $50.28
|
Most Recent Note - 8/27/2012 3:25:21 PM
G - Volume totals have been cooling in recent weeks while still holding its ground stubbornly near its all-time high. Prior highs in the $48 area define initial support to watch on pullbacks.
>>> The latest Featured Stock Update with an annotated graph appeared on 7/30/2012. Click here.
View all notes |
Alert me of new notes |
CANSLIM.net Company Profile |
SEC |
Zacks Reports |
StockTalk |
News |
Chart |
Request a new note
C
A N
S L
I M
|
TDG
-
NYSE
Transdigm Group Inc
AEROSPACE/DEFENSE - Aerospace/Defense Products and; Services
|
$139.42
|
+0.86
0.62% |
$143.15
|
507,490
123.30% of 50 DAV
50 DAV is 411,600
|
$139.37
0.04%
|
8/16/2012
|
$132.23
|
PP = $136.44
|
|
MB = $143.26
|
Most Recent Note - 8/27/2012 12:45:26 PM
Y - Hit a new 52-week high today and challenged its "max buy" level, however it is now trading well off its earlier highs. Disciplined investors do not chase extended stocks and they always limit losses if ever any stock falls -7% from their purchase price.
>>> The latest Featured Stock Update with an annotated graph appeared on 8/17/2012. Click here.
View all notes |
Alert me of new notes |
CANSLIM.net Company Profile |
SEC |
Zacks Reports |
StockTalk |
News |
Chart |
Request a new note
C
A N
S L
I M
|
TNGO
-
NASDAQ
Tangoe Inc
COMPUTER SOFTWARE and SERVICES - Technical and System Software
|
$20.09
|
+0.24
1.21% |
$20.50
|
253,961
61.21% of 50 DAV
50 DAV is 414,900
|
$23.05
-12.84%
|
8/9/2012
|
$21.30
|
PP = $23.10
|
|
MB = $24.26
|
Most Recent Note - 8/24/2012 6:10:46 PM
G - Slump below its 50 DMA line this week hurt its outlook. Faces resistance up to the $23 level which has been a stubborn resistance area in recent months. See the latest FSU analysis for more details and a new annotated graph.
>>> The latest Featured Stock Update with an annotated graph appeared on 8/24/2012. Click here.
View all notes |
Alert me of new notes |
CANSLIM.net Company Profile |
SEC |
Zacks Reports |
StockTalk |
News |
Chart |
Request a new note
C
A N
S L
I M
|
ULTI
-
NASDAQ
Ultimate Software Group
INTERNET - Internet Software and Services
|
$98.94
|
+2.92
3.04% |
$99.74
|
255,837
154.21% of 50 DAV
50 DAV is 165,900
|
$99.09
-0.15%
|
8/27/2012
|
$98.36
|
PP = $99.19
|
|
MB = $104.15
|
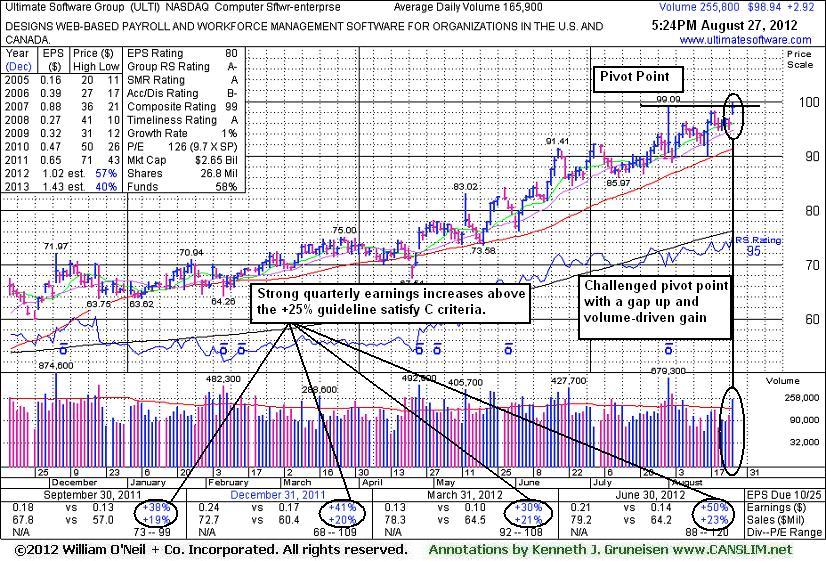
Most Recent Note - 8/27/2012 5:56:45 PM
Y - Gapped up and touched a new 52-week high today while posting a volume-driven gain, however it did not finish above the pivot point cited based on its 8/01/12 high plus 10 cents. A volume-driven gain and strong close above its pivot point may trigger technical buy signal. See the latest FSU analysis for more details and an annotated graph.
>>> The latest Featured Stock Update with an annotated graph appeared on 8/27/2012. Click here.
View all notes |
Alert me of new notes |
CANSLIM.net Company Profile |
SEC |
Zacks Reports |
StockTalk |
News |
Chart |
Request a new note
C
A N
S L
I M
|
VSI
-
NYSE
Vitamin Shoppe Inc
SPECIALTY RETAIL - Specialty Retail, Other
|
$54.31
|
+0.71
1.32% |
$54.44
|
218,706
53.26% of 50 DAV
50 DAV is 410,600
|
$61.83
-12.16%
|
6/29/2012
|
$54.93
|
PP = $55.03
|
|
MB = $57.78
|
Most Recent Note - 8/23/2012 2:53:36 PM
G - Slumping below its 50 DMA line this week with a spurt of damaging losses triggering technical sell signals. Its prior low ($52.41 on 7/23/12) defines a near-term support level where any further deterioration would raise more serious concerns.
>>> The latest Featured Stock Update with an annotated graph appeared on 8/2/2012. Click here.
View all notes |
Alert me of new notes |
CANSLIM.net Company Profile |
SEC |
Zacks Reports |
StockTalk |
News |
Chart |
Request a new note
C
A N
S L
I M
|
Symbol/Exchange
Company Name
Industry Group |
PRICE |
CHANGE
(%Change) |
Day High |
Volume
(% DAV)
(% 50 day avg vol) |
52 Wk Hi
% From Hi |
Featured
Date |
Price
Featured |
Pivot Featured |
|
Max Buy |
WPI
-
NYSE
Watson Pharmaceuticals
DRUGS - Drugs - Generic
|
$82.65
|
-0.67
-0.80% |
$83.63
|
1,554,157
116.11% of 50 DAV
50 DAV is 1,338,500
|
$83.83
-1.41%
|
8/24/2012
|
$82.90
|
PP = $81.10
|
|
MB = $85.16
|
Most Recent Note - 8/24/2012 5:41:29 PM
Y - Finished the session with a solid gain above its pivot point backed by +143% above average volume, triggering a technical buy signal while rallying from a very tight trading range where volume totals had cooled for several weeks. It was highlighted in yellow in the earlier mid-day report with a pivot point based on its 7/26/12 high plus 10 cents. The considerable gain with above average volume followed news that its generic Lidoderm(R) received FDA approval, an encouraging development concerning the N criteria. The 5/09/12 mid-day report noted - "Its improved fundamentals make it a worthy candidate for investors' watchlists. Sales revenues showed impressive acceleration while the 3 latest quarterly comparisons through Mar '12 showed earnings increases above the +25% guideline satisfying the C criteria. It also has maintained a strong annual earnings (A criteria) history."

There are no Featured Stock Updates™ available for this stock at this time. You may request one by clicking the Request a New Note link below
View all notes |
Alert me of new notes |
CANSLIM.net Company Profile |
SEC |
Zacks Reports |
StockTalk |
News |
Chart |
Request a new note
C
A N
S L
I M
|