You are not logged in.
This means you
CAN ONLY VIEW reports that were published prior to Monday, April 14, 2025.
You
MUST UPGRADE YOUR MEMBERSHIP if you want to see any current reports.
AFTER MARKET UPDATE - WEDNESDAY, AUGUST 24TH, 2011
Previous After Market Report Next After Market Report >>>
|
|
|
|
DOW |
+143.95 |
11,320.71 |
+1.29% |
|
Volume |
1,109,394,920 |
-10% |
|
Volume |
1,840,707,750 |
-13% |
|
NASDAQ |
+21.63 |
2,467.69 |
+0.88% |
|
Advancers |
2,099 |
67% |
|
Advancers |
1,692 |
64% |
|
S&P 500 |
+15.25 |
1,177.60 |
+1.31% |
|
Decliners |
932 |
30% |
|
Decliners |
865 |
33% |
|
Russell 2000 |
+9.50 |
692.57 |
+1.39% |
|
52 Wk Highs |
16 |
|
|
52 Wk Highs |
7 |
|
|
S&P 600 |
+4.85 |
379.07 |
+1.30% |
|
52 Wk Lows |
31 |
|
|
52 Wk Lows |
54 |
|
|
 |
Major Averages Post 3rd Day of Gains With Lighter Volume
Kenneth J. Gruneisen - Passed the CAN SLIM® Master's Exam
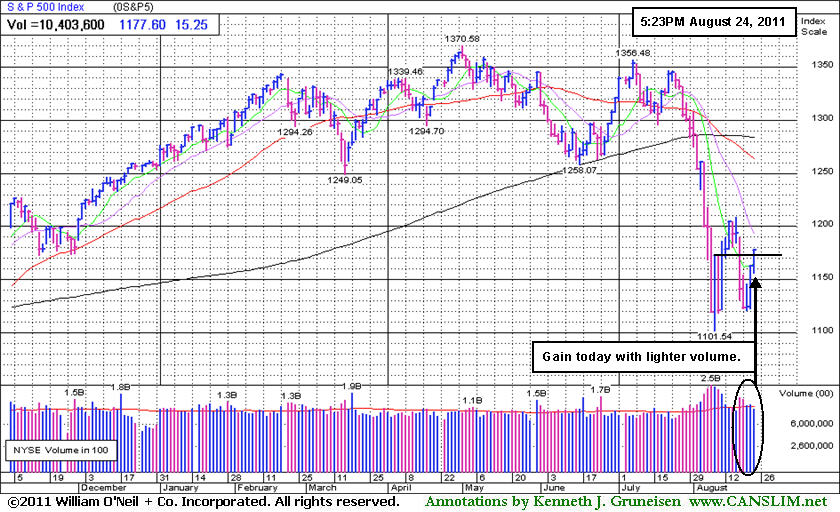
The Dow Jones Industrial Average, S&P 500 Index, and Nasdaq Composite Index closed higher for a 3rd straight day of unanimous gains. Volume totals were reported lighter on the NYSE and on the Nasdaq exchange, a sign of lackluster buying demand coming from the institutional crowd. Breadth was positive as advancing issues beat decliners by more than 2-1 on the NYSE and by nearly 2-1 on the Nasdaq exchange. On the NYSE and on the Nasdaq exchange new 52-week lows totals still solidly outnumbered the new 52-week highs totals. There were 9 high-ranked companies from the CANSLIM.net Leaders List that made new 52-week highs and appeared on the CANSLIM.net BreakOuts Page, up from the prior session total of 5 stocks. Any sustainable rally requires a healthy crop of strong leaders hitting new 52-week highs, so it will be crucial for leadership to expand if the new "confirmed uptrend" is going to make any meaningful headway. There were gains for all of the 6 high-ranked leaders currently included on the Featured Stocks Page.
A positive report on durable goods orders gave stocks an early lift. Orders jumped 4% in July, the most in three months, led by a surge in demand for aircraft and autos. But the early rally fizzled at mid-session, with the major averages turning lower after a volatile morning on Wall Street. The Congressional Budget Office said the U.S. budget deficit will be less than it expected in April because of curbs on federal spending. The market appeared less convinced the Federal Reserve will announce a new round of quantitative easing at its annual retreat in Wyoming on Friday.
Gold was another big story of the day as prices plunged over $100 per ounce in New York, the biggest drop since March of 2008, as demand for stocks increased at the expense of the precious metal. Gold traded below $1,790 per ounce after hitting a record over $1,900 Tuesday. Meanwhile, the 10-year Treasury note dropped over a point to yield 2.29%. The U.S. sold $35 billion in five-year notes at a record low auction yield before a sale of $29 billion of seven-year notes expected Thursday.
Investors did some bargain hunting in beaten-down financial shares as analysts defend the stocks. Bank of America Corp (BAC +10.95%) rose, and so did The Goldman Sachs Group Inc (GS +3.23%). Homebuilders rebounded after an index of home prices increased 0.9% in June following a 0.4% gain in May. Toll Brothers Inc (TOL +4.61%) rose after reporting that it saw some stabilization in the upscale housing market in the third quarter.
The market environment (M criteria) was labeled as back in a "confirmed uptrend" in the newspaper after Tuesday's big gains on higher volume. However, one shortcoming to the follow-through day (FTD) which we previously noted is the dearth of leadership (few stocks hitting new 52-week highs) which suggests that there may not be a healthy crop of leaders showing sufficient strength to allow the major averages to sustain a meaningful advance. The indices also remain well below their respective 200-day moving average (DMA) lines, and to be considered truly "healthy" they would need to rebound above their long-term averages.
The August 2011 issue of CANSLIM.net News is now available (click here). Links to all prior reports are available on the Premium Member Homepage.
PICTURED: The S&P 500 Index rose 15 points to 1,177, exceeding the index's closing levels following rallies on August 9 and August 11.
|
 Kenneth J. Gruneisen started out as a licensed stockbroker in August 1987, a couple of months prior to the historic stock market crash that took the Dow Jones Industrial Average down -22.6% in a single day. He has published daily fact-based fundamental and technical analysis on high-ranked stocks online for two decades. Through FACTBASEDINVESTING.COM, Kenneth provides educational articles, news, market commentary, and other information regarding proven investment systems that work in good times and bad.
Comments contained in the body of this report are technical opinions only and are not necessarily those of Gruneisen Growth Corp. The material herein has been obtained from sources believed to be reliable and accurate, however, its accuracy and completeness cannot be guaranteed. Our firm, employees, and customers may effect transactions, including transactions contrary to any recommendation herein, or have positions in the securities mentioned herein or options with respect thereto. Any recommendation contained in this report may not be suitable for all investors and it is not to be deemed an offer or solicitation on our part with respect to the purchase or sale of any securities. |
|
 |
Financial, Retail, and Healthcare Groups Led Gainers
Kenneth J. Gruneisen - Passed the CAN SLIM® Master's Exam
Solid gains from the Bank Index ($BKX +3.34%) and Broker/Dealer Index ($XBD +1.79%) were a positive influence underpinning the rally on Wednesday. The Retail Index ($RLX +1.26%) and Healthcare Index ($HMO +1.71%) also tallied solid gains. The tech sector was mixed as the Biotechnology Index ($BTK +0.20%) and Internet Index ($IIX +0.43%) posted small gains, yet the Semiconductor Index ($SOX -0.12%) and Networking Index ($NWX -0.11%) ended with smaller losses. The Integrated Oil Index ($XOI +0.09%) and Oil Services Index ($OSX +0.49%) edged higher. Meanwhile, the Gold & Silver Index ($XAU -1.95%) was a laggard.
Charts courtesy www.stockcharts.com
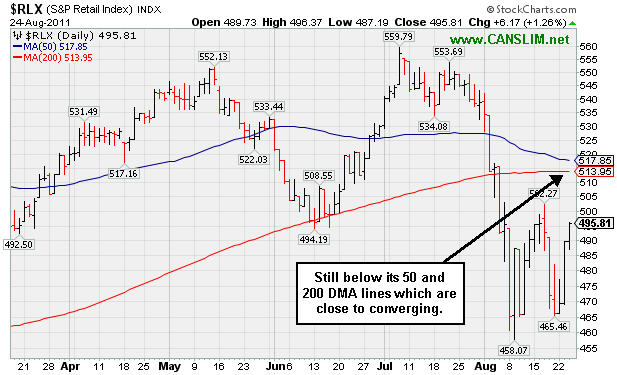
PICTURED: The Retail Index ($RLX +1.26%) is still below its 50-day and 200-day moving average (DMA) lines which are close to converging.
| Oil Services |
$OSX |
223.17 |
+1.09 |
+0.49% |
-8.95% |
| Healthcare |
$HMO |
1,976.45 |
+33.32 |
+1.71% |
+16.81% |
| Integrated Oil |
$XOI |
1,124.18 |
+1.03 |
+0.09% |
-7.33% |
| Semiconductor |
$SOX |
345.69 |
-0.40 |
-0.12% |
-16.06% |
| Networking |
$NWX |
227.61 |
-0.26 |
-0.11% |
-18.87% |
| Internet |
$IIX |
269.64 |
+1.16 |
+0.43% |
-12.38% |
| Broker/Dealer |
$XBD |
88.59 |
+1.56 |
+1.79% |
-27.10% |
| Retail |
$RLX |
495.81 |
+6.17 |
+1.26% |
-2.47% |
| Gold & Silver |
$XAU |
207.48 |
-4.12 |
-1.95% |
-8.43% |
| Bank |
$BKX |
37.73 |
+1.22 |
+3.34% |
-27.73% |
| Biotech |
$BTK |
1,137.92 |
+2.32 |
+0.20% |
-12.31% |
|
|
|
 |
Hit New High After Prior Resistance Acted as Support
Kenneth J. Gruneisen - Passed the CAN SLIM® Master's Exam
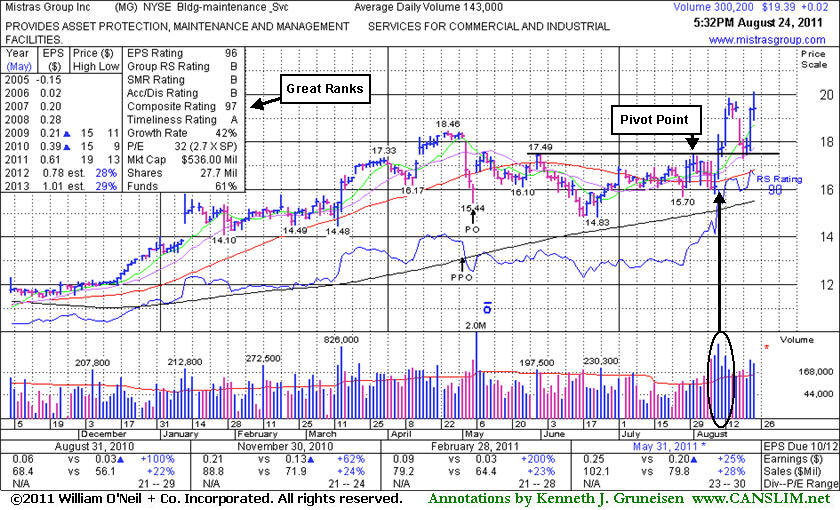
Mistras Group Inc (MG +$0.02 or +0.10% to $19.39) finished flat after touching a new all-time high earlier today. There is no resistance remaining due to overhead supply. Previous resistance in the $17-18 area defined important chart support after encountering mild distributional pressure following its recently noted technical breakout. Typically about 40% of successful breakouts pull back and test support at prior resistance before continuing higher.
The Accumulation/Distribution rating has improved from a D+ to a B since its last appearance in the FSU section on 8/11/11 with an annotated weekly graph included below the headline, "Management Motivated, But Market Remains Concern". At that time it was holding its ground after highlighted in yellow in the 8/10/11 mid-day report (read here) which included an annotated daily graph showing its considerable gain driven by heavy volume, rallying from a base formed since the previously noted Public Offering on 5/05/11. MG found support well above its 200 DMA line after it was dropped from the Featured Stocks list on 6/14/11. It has maintained its solid earnings history concerning the C and A criteria.
The Building - Maintenance Services group has a Group Relative Strength Rating (61) that is mediocre, but up from 51 when last summarized, whereas the L criteria calls for leadership in the industry group. The number of top-rated funds owning its shares rose from 99 in Sep '10 to 151 in Jun '11, a very reassuring sign concerning the I criteria. Management's large 59% ownership interest keeps them very motivated to look after and build shareholder value. The small supply (S criteria) of only 27.7 million shares outstanding and 11.3 million in the public float can contribute to greater price volatility in the event of institutional buying or selling. Disciplined investors avoid chasing extended stocks more than +5% above their pivot point, and always limit losses at 7-8% if ever a stock falls that much after purchased. That is the only way to remove the chance of a small loss growing to become a much more painful and damaging loss.
|
|
|
Color Codes Explained :
Y - Better candidates highlighted by our
staff of experts.
G - Previously featured
in past reports as yellow but may no longer be buyable under the
guidelines.
***Last / Change / Volume data in this table is the closing quote data***
Symbol/Exchange
Company Name
Industry Group |
PRICE |
CHANGE
(%Change) |
Day High |
Volume
(% DAV)
(% 50 day avg vol) |
52 Wk Hi
% From Hi |
Featured
Date |
Price
Featured |
Pivot Featured |
|
Max Buy |
EXLS
-
NASDAQ
Exlservice Holdings Inc
DIVERSIFIED SERVICES - Business/Management Services
|
$25.37
|
+0.51
2.05% |
$25.85
|
146,888
166.16% of 50 DAV
50 DAV is 88,400
|
$26.46
-4.12%
|
8/2/2011
|
$24.85
|
PP = $24.85
|
|
MB = $26.09
|
 Most Recent Note - 8/24/2011 12:22:07 PM
Y - Rallying up from its 50 DMA line and above its pivot point, perched within close striking distance of its 52-week high. Recent low and 50 DMA line define important support to watch above its 200 DMA line.
>>> The latest Featured Stock Update with an annotated graph appeared on 8/15/2011. Click here.
View all notes |
Alert me of new notes |
CANSLIM.net Company Profile |
SEC |
Zacks Reports |
StockTalk |
News |
Chart |
Request a new note
C
A N
S L
I M


|
FCFS
-
NASDAQ
First Cash Financial Svs
SPECIALTY RETAIL - Specialty Retail, Other
|
$43.85
|
+0.56
1.29% |
$44.98
|
358,493
115.01% of 50 DAV
50 DAV is 311,700
|
$47.80
-8.26%
|
5/31/2011
|
$42.00
|
PP = $40.23
|
|
MB = $42.24
|
Most Recent Note - 8/24/2011 12:23:37 PM
G - Off today's earlier highs and slipping into the red. Recently finding support near its 50 DMA line. Prior chart lows near $37-38 define support to watch.
>>> The latest Featured Stock Update with an annotated graph appeared on 8/22/2011. Click here.
View all notes |
Alert me of new notes |
CANSLIM.net Company Profile |
SEC |
Zacks Reports |
StockTalk |
News |
Chart |
Request a new note
C
A N
S L
I M
|
JCOM
-
NASDAQ
J 2 Global Communication
INTERNET - Internet Software and Services
|
$30.08
|
+0.49
1.66% |
$30.43
|
324,230
98.64% of 50 DAV
50 DAV is 328,700
|
$31.72
-5.17%
|
8/8/2011
|
$30.38
|
PP = $29.31
|
|
MB = $30.78
|
Most Recent Note - 8/24/2011 6:07:35 PM
G - Today's 3rd consecutive gain led to a close just 20 cents below its 8/03/11 close after a considerable gap up. Little resistance remains due to overhead supply.
>>> The latest Featured Stock Update with an annotated graph appeared on 8/19/2011. Click here.
View all notes |
Alert me of new notes |
CANSLIM.net Company Profile |
SEC |
Zacks Reports |
StockTalk |
News |
Chart |
Request a new note
C
A N
S L
I M
|
MA
-
NYSE
Mastercard Inc Cl A
DIVERSIFIED SERVICES - Business/Management Services
|
$325.20
|
+2.81
0.87% |
$329.81
|
1,170,629
78.60% of 50 DAV
50 DAV is 1,489,300
|
$340.42
-4.47%
|
8/3/2011
|
$324.82
|
PP = $322.38
|
|
MB = $338.50
|
Most Recent Note - 8/24/2011 6:09:04 PM
Y - Posted a 3rd consecutive gain on lighter than average volume today and finished -4.5% off its 8/03/11 all-time high. Recently found support near its 50 DMA line.
>>> The latest Featured Stock Update with an annotated graph appeared on 8/16/2011. Click here.
View all notes |
Alert me of new notes |
CANSLIM.net Company Profile |
SEC |
Zacks Reports |
StockTalk |
News |
Chart |
Request a new note
C
A N
S L
I M
|
MG
-
NYSE
Mistras Group Inc
DIVERSIFIED SERVICES - Bulding and Faci;ity Management Services
|
$19.39
|
+0.02
0.10% |
$20.10
|
301,666
210.96% of 50 DAV
50 DAV is 143,000
|
$19.85
-2.32%
|
8/10/2011
|
$17.89
|
PP = $17.58
|
|
MB = $18.46
|
Most Recent Note - 8/24/2011 6:05:06 PM
G - Finished flat after touching a new all-time high earlier today. Previous resistance in the $17-18 area defined important chart support after encountering mild distributional pressure. See the latest FSU analysis for more details and a new annotated graph.
>>> The latest Featured Stock Update with an annotated graph appeared on 8/24/2011. Click here.
View all notes |
Alert me of new notes |
CANSLIM.net Company Profile |
SEC |
Zacks Reports |
StockTalk |
News |
Chart |
Request a new note
C
A N
S L
I M
|
Symbol/Exchange
Company Name
Industry Group |
PRICE |
CHANGE
(%Change) |
Day High |
Volume
(% DAV)
(% 50 day avg vol) |
52 Wk Hi
% From Hi |
Featured
Date |
Price
Featured |
Pivot Featured |
|
Max Buy |
MKTX
-
NASDAQ
Marketaxess Holdings Inc
FINANCIAL SERVICES - Investment Brokerage - Nationa
|
$29.53
|
+0.10
0.34% |
$29.64
|
301,701
126.50% of 50 DAV
50 DAV is 238,500
|
$30.25
-2.38%
|
7/29/2011
|
$25.87
|
PP = $26.35
|
|
MB = $27.67
|
Most Recent Note - 8/24/2011 4:10:50 PM
G - Finished near the session high today, inching up for another new high close. Extended from its prior base. See the latest FSU analysis for more details and a new annotated graph.
>>> The latest Featured Stock Update with an annotated graph appeared on 8/23/2011. Click here.
View all notes |
Alert me of new notes |
CANSLIM.net Company Profile |
SEC |
Zacks Reports |
StockTalk |
News |
Chart |
Request a new note
C
A N
S L
I M
|
|
|
|
THESE ARE NOT BUY RECOMMENDATIONS!
Comments contained in the body of this report are technical
opinions only. The material herein has been obtained
from sources believed to be reliable and accurate, however,
its accuracy and completeness cannot be guaranteed.
This site is not an investment advisor, hence it does
not endorse or recommend any securities or other investments.
Any recommendation contained in this report may not
be suitable for all investors and it is not to be deemed
an offer or solicitation on our part with respect to
the purchase or sale of any securities. All trademarks,
service marks and trade names appearing in this report
are the property of their respective owners, and are
likewise used for identification purposes only.
This report is a service available
only to active Paid Premium Members.
You may opt-out of receiving report notifications
at any time. Questions or comments may be submitted
by writing to Premium Membership Services 665 S.E. 10 Street, Suite 201 Deerfield Beach, FL 33441-5634 or by calling 1-800-965-8307
or 954-785-1121.
|
|
|

