You are not logged in.
This means you
CAN ONLY VIEW reports that were published prior to Monday, April 14, 2025.
You
MUST UPGRADE YOUR MEMBERSHIP if you want to see any current reports.
AFTER MARKET UPDATE - MONDAY, AUGUST 24TH, 2009
Previous After Market Report Next After Market Report >>>
|
|
|
|
DOW |
+3.32 |
9,509.28 |
+0.03% |
|
Volume |
1,230,525,940 |
-17% |
|
Volume |
2,063,817,550 |
-10% |
|
NASDAQ |
-2.92 |
2,017.98 |
-0.14% |
|
Advancers |
1,546 |
49% |
|
Advancers |
1,259 |
44% |
|
S&P 500 |
-0.56 |
1,025.57 |
-0.05% |
|
Decliners |
1,471 |
47% |
|
Decliners |
1,481 |
51% |
|
Russell 2000 |
-1.27 |
580.24 |
-0.22% |
|
52 Wk Highs |
118 |
|
|
52 Wk Highs |
75 |
|
|
S&P 600 |
-0.50 |
307.20 |
-0.16% |
|
52 Wk Lows |
0 |
|
|
52 Wk Lows |
3 |
|
|
 |
Early Gains Faded As Major Averages Ended Mixed On Lighter Volume
Adam Sarhan, Contributing Writer,
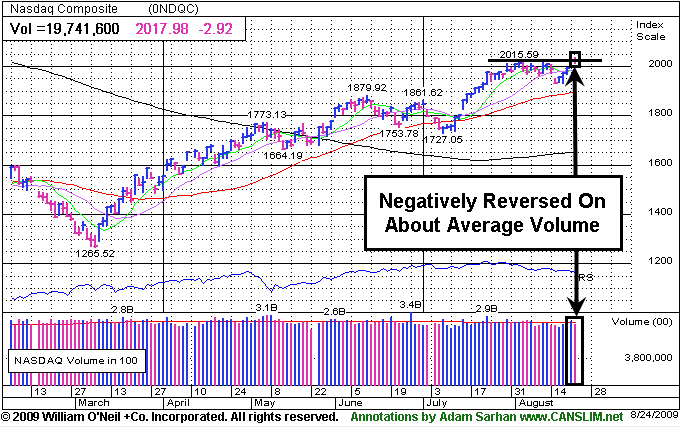
The S&P 500 Index and Nasdaq Composite Index negatively reversed one trading day after a new rally was confirmed. Volume was lower than Friday's inflated options expiration levels on both exchanges, which signaled that large institutions were not aggressively dumping stocks to start the new week. Advancers narrowly led decliners on the NYSE yet the bias was slightly negative on the Nasdaq exchange. There were 31 high-ranked companies from the CANSLIM.net Leaders List that made a new 52-week high and appeared on the CANSLIM.net BreakOuts Page, up from the 24 issues that appeared on the prior session. New 52-week highs solidly outnumbered new 52-week lows on both exchanges while new lows were in the single digits again.
Overnight, Asian stocks soared following Friday's strong performance in the US. That set the stage for a positive open in the US, but the buying demand quickly waned as fears returned that more bank failures were on the horizon. SunTrust Chairman and Chief Executive Officer James Wells III said in a speech at the Rotary Club of Atlanta that "This credit cycle has yet to play itself out...We do not expect things to improve for the banking industry in the very near future." He also said "the industry is a long way from declaring any sort of victory." Mr. Wells made it clear that he expects lenders to face more credit losses and commercial real estate may continue to decline through 2010. Elsewhere, famous bank analyst Dick Bove said he expects more than 100 more banks to fail before we are out of the woods. Both comments put pressure on the highly influential financial sector.
Automobile companies slid as the "cash for clunkers" program entered its last day. Commodity stocks also pulled back and closed lower as the US dollar edged higher. On a pure valuation basis, the benchmark S&P 500 Index is getting up to a level value investors call "expensive", having surged over +50% from a 12-year low in early March to be currently valued at 18.9 times the profits of its companies - the most expensive level since 2004. Over the weekend, central bankers met at their annual symposium in Jackson Hole, Wyoming and said the global economy is pulling out of the recession. Federal Reserve Chairman Ben S. Bernanke and European Central Bank President Jean-Claude Trichet were among the two largest names there that echoed this point.
Money Management Services: Contact Us Today!
Investors often inquire looking for a money manager who follows a proven set of rules and who has completed the Master's Program, demonstrating a high level of skill at using this powerful investment system. Learn more about having your account professionally managed using this fact-based investment system by clicking HERE. *Accounts over $250,000 please. ** Serious inquiries only.
PICTURED: The Nasdaq Composite negatively reversed for a small loss on about average volume.
|
|
|
 |
Mixed Group Action Favored Defensive Areas
Kenneth J. Gruneisen - Passed the CAN SLIM® Master's Exam
Influential areas reversed early gains on Monday and ended with losses, including the Bank Index ($BKX -1.59%), Broker/Dealer Index ($XBD -0.86%), and Retail Index ($RLX -1.55%). The tech sector also ended widely lower as the Networking Index ($NWX -0.96%), Semiconductor Index ($SOX -0.78%), and Internet Index ($IIX -0.60%) erased their morning gains and ended unanimously in the red. Meanwhile the Healthcare Index ($HMO +0.74%) and Biotechnology Index ($BTK +0.53%) posted modest gains, and energy shares also rose, boosting the Oil Services Index ($OSX +0.99%) and Integrated Oil Index ($XOI +0.71%) modestly.
Charts courtesy www.stockcharts.com
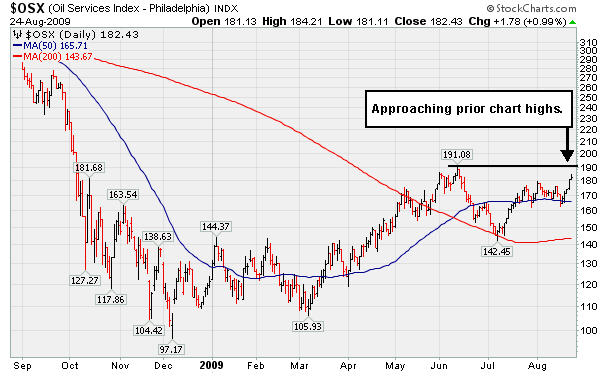
PICTURED: The Oil Services Index ($OSX +0.99%) recently found support near its 50-day moving average line and is rallying near prior chart highs. Energy stocks have been helped by rising oil prices. Crude set fresh highs for the year at $74.81 per barrel before settlig at $74.37 per barrel, up +0.6%.
| Oil Services |
$OSX |
182.43 |
+1.78 |
+0.99% |
+50.28% |
| Healthcare |
$HMO |
1,231.59 |
+9.00 |
+0.74% |
+28.27% |
| Integrated Oil |
$XOI |
992.95 |
+7.01 |
+0.71% |
+1.35% |
| Semiconductor |
$SOX |
298.95 |
-2.35 |
-0.78% |
+40.90% |
| Networking |
$NWX |
212.39 |
-2.05 |
-0.96% |
+47.61% |
| Internet |
$IIX |
204.37 |
-1.24 |
-0.60% |
+52.78% |
| Broker/Dealer |
$XBD |
110.12 |
-0.96 |
-0.86% |
+42.15% |
| Retail |
$RLX |
360.66 |
-5.69 |
-1.55% |
+29.15% |
| Gold & Silver |
$XAU |
146.16 |
-1.21 |
-0.82% |
+18.01% |
| Bank |
$BKX |
46.37 |
-0.75 |
-1.59% |
+4.63% |
| Biotech |
$BTK |
883.84 |
+4.66 |
+0.53% |
+36.57% |
|
|
|
 |
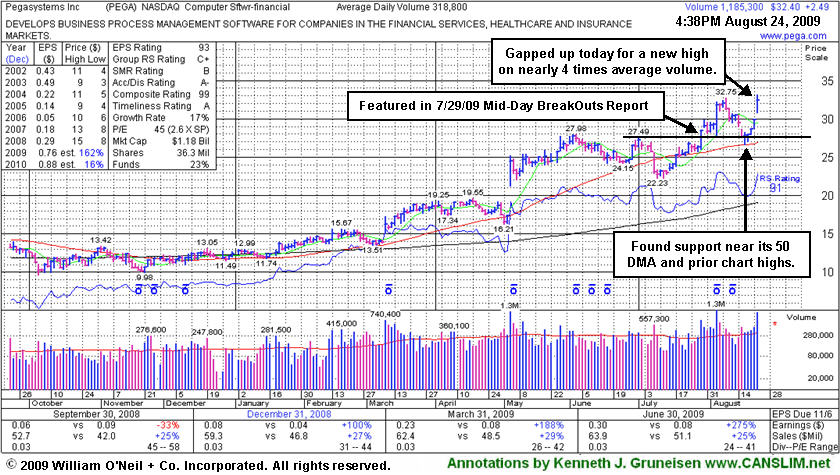
Software Firm Rallies To New High After Testing Support
Kenneth J. Gruneisen - Passed the CAN SLIM® Master's Exam
Pegasystems Inc (PEGA +$2.49 or +8.36% to $32.40) gapped up today for a considerable gain and new high close with volume nearly 4 times average, its 5th consecutive gain on ever-increasing volume. As noted in its last appearance in this section on 8/11/09 (read here), "studies have shown that approximately 40% of successful breakouts pull back and re-test their pivot points before continuing higher." Prior highs which were old resistance in the mid-$27 area have recently served as a technical support level along with its 50-day moving average line (now $26.87). It proved resilient and found great support during a brief market correction which recently led many stocks to break down at key chart support levels.
PEGA posted a considerable 8/05/09 gain with nearly 5 times average volume following strong Q2 earnings and raised guidance. It first triggered a technical buy signal when rising from the "double bottom" base on the day it was featured in the 7/29/09 mid-day report (read here). The Computer Software - Financial firm has shown solid sales revenues increases and +25% earnings increases in the 3 last quarterly comparisons versus the year ago period. The previously noted downturn in annual earnings (the A criteria) from 2003 to 2006 has been followed by a solid turn around and big earnings increases in '07 and '08, and Street expectations for '09 are calling for well above +25% growth.
|
|
|
Color Codes Explained :
Y - Better candidates highlighted by our
staff of experts.
G - Previously featured
in past reports as yellow but may no longer be buyable under the
guidelines.
***Last / Change / Volume quote data in this table corresponds with the timestamp on the note***
Symbol/Exchange
Company Name
Industry Group |
Last |
Chg. |
Vol
% DAV |
Date Featured |
Price Featured |
Latest Pivot Point
Featured |
Status |
| Latest Max Buy Price |
ARO
- NYSE
Aeropostale Inc
RETAIL - Apparel Stores
|
$39.51
|
-0.04
|
4,344,316
147% DAV
2,953,500
|
8/21/2009
(Date
Featured) |
$39.21
(Price
Featured) |
PP = $38.84 |
Y |
| MB = $40.78 |
Most Recent Note - 8/24/2009 4:17:19 PM
Y - Negatively reversed after a gap up today for another new high. This high-ranked leader in the Retail - Clothing/shoe group gapped up and hit a new all-time high on 8/21/09, rising from a flat base pattern triggering a technical buy signal. It was featured in yellow with new pivot point and max buy levels noted in the 8/21/09 Mid-Day BreakOuts Report (read here). It has a good annual earnings history (the A criteria), and the 2 latest quarterly comparisons showed +81% and +84% earnings increases, well above the investment system's +25% guideline.
>>> The latest Featured Stock Update with an annotated graph appeared on 8/21/2009. click here.
|
|
C
A
S
I |
News |
Chart |
SEC
View all notes Alert
me of new notes
Company
Profile
|
CPLA
- NASDAQ
Capella Education Co
DIVERSIFIED SERVICES - Education and Training Services
|
$64.90
|
-0.10
|
62,095
31% DAV
201,000
|
7/9/2009
(Date
Featured) |
$59.69
(Price
Featured) |
PP = $62.06 |
Y |
| MB = $65.16 |
Most Recent Note - 8/24/2009 4:18:43 PM
Y - Consolidating in a tight range on very light volume near its 52-week high, still above its pivot point but below the "max buy" level. The Commercial Services-Schools Group has shown some leadership but has low ranks, and CPLA's Relative Strength rank has slumped to 55, under the 80+ guideline. Its small supply of only 13.9 million shares in the float could contribute to greater price volatility in the event of institutional accumulation or distribution. The number of top-rated funds owning an interest rose from 91 in Sept '08, to 136 as of June '09, which is reassuring with respect to the I criteria. It has a very good earnings history that satisfies the C & A criteria, while recent quarters showed steady sales revenues increases in the +17-18% range.
>>> The latest Featured Stock Update with an annotated graph appeared on 8/19/2009. click here.
|
|
C
A
S
I |
News |
Chart |
SEC
View all notes Alert
me of new notes
Company
Profile
|
CRM
- NYSE
Salesforce.com Inc
INTERNET - Internet Software & Services
|
$52.78
|
-0.89
|
4,384,878
242% DAV
1,812,100
|
8/16/2009
(Date
Featured) |
$47.12
(Price
Featured) |
PP = $45.59 |
Y |
| MB = $47.87 |
Most Recent Note - 8/24/2009 4:23:08 PM
Y - Negatively reversed today. A "breakaway gap" for a considerable gain on 8/21/09 with more than 5 times average volume followed its latest quarterly financial report after a gain on the prior session backed by nearly 2.5 times average volume helped it rally back above its previously cited pivot point. A Stock Bulletin was published with detailed analysis and an annotated graph on 8/16/09 (read here).
>>> The latest Featured Stock Update with an annotated graph appeared on 8/16/2009. click here.
|
|
C
A
S
I |
News |
Chart |
SEC
View all notes Alert
me of new notes
Company
Profile
|
GMCR
- NASDAQ
Green Mtn Coffee Roastrs
FOOD & BEVERAGE - Processed & Packaged Goods
|
$58.86
|
+0.52
|
1,045,132
63% DAV
1,671,800
|
7/17/2009
(Date
Featured) |
$60.15
(Price
Featured) |
PP = $63.79 |
G |
| MB = $66.98 |
Most Recent Note - 8/24/2009 4:25:06 PM
G - Its outlook is increasingly questionable the longer trading continues under its 50 DMA line which is now downward sloping. The next support is at prior chart lows in the $53 area. Its gap down and considerable loss on 8/17/09 on heavy volume triggered technical sell signals, capping a 6 session losing streak as it violated its 50 DMA line, prior highs in the $62-63 area, and an upward trendline. GMCR traded up more than +168% since appearing with an annotated graph under the headline "It May Soon Be Time To Go Green" when featured in the January 2009 CANSLIM.net News (read here).
>>> The latest Featured Stock Update with an annotated graph appeared on 8/14/2009. click here.
|
|
C
A
S
I |
News |
Chart |
SEC
View all notes Alert
me of new notes
Company
Profile
|
LFT
-
|
$27.84
|
-0.21
|
649,928
78% DAV
838,300
|
8/10/2009
(Date
Featured) |
$31.49
(Price
Featured) |
PP = $30.57 |
G |
| MB = $32.10 |
Most Recent Note - 8/24/2009 4:27:06 PM
G - Held its ground today after rebounding above its 50 DMA line last week following substantial losses on heavy volume indicative of distributional pressure.
>>> The latest Featured Stock Update with an annotated graph appeared on 8/12/2009. click here.
|
|
C
A
S
I |
News |
Chart |
SEC
View all notes Alert
me of new notes
Company
Profile
|
NTES
- NASDAQ
Netease Inc Adr
INTERNET - Internet Information Providers
|
$42.28
|
-0.22
|
932,948
39% DAV
2,371,600
|
7/17/2009
(Date
Featured) |
$39.29
(Price
Featured) |
PP = $38.74 |
G |
| MB = $40.68 |
Most Recent Note - 8/24/2009 4:28:49 PM
G - Volume is drying up while it has recently found support near its 50 DMA line and above prior chart highs in the $38 area. A 8/13/09 gap down for a considerable loss on nearly 4 times average volume triggered a technical sell signal.
>>> The latest Featured Stock Update with an annotated graph appeared on 8/13/2009. click here.
|
|
C
A
S
I |
News |
Chart |
SEC
View all notes Alert
me of new notes
Company
Profile
|
NVEC
- NASDAQ
N V E Corp
ELECTRONICS - Semiconductor - Specialized
|
$55.51
|
+0.85
|
112,425
117% DAV
95,800
|
3/13/2009
(Date
Featured) |
$33.85
(Price
Featured) |
PP = $49.60 |
G |
| MB = $52.08 |
Most Recent Note - 8/24/2009 4:30:11 PM
G - Consolidating within close striking range of all-time highs, basing above important initial support at its 50 DMA line (now $49.47) and prior chart highs. Quarterly sales revenues in the 6 million dollar range are still rather minuscule, leaving concerns.
>>> The latest Featured Stock Update with an annotated graph appeared on 8/18/2009. click here.
|
|
C
A
S
I |
News |
Chart |
SEC
View all notes Alert
me of new notes
Company
Profile
|
PEGA
- NASDAQ
Pegasystems Inc
COMPUTER SOFTWARE & SERVICES - Business Software & Services
|
$32.41
|
+2.50
|
1,341,109
421% DAV
318,800
|
7/29/2009
(Date
Featured) |
$27.53
(Price
Featured) |
PP = $27.49 |
G |
| MB = $28.86 |
Most Recent Note - 8/24/2009 4:33:35 PM
G - Gapped up today, hitting and closing at a new high, rallying considerably for its 5th consecutive gain on ever-increasing volume since holding ground above its 50 DMA line. Color code is changed to green based on its distance above its latest pivot point.
>>> The latest Featured Stock Update with an annotated graph appeared on 8/24/2009. click here.
|
|
C
A
S
I |
News |
Chart |
SEC
View all notes Alert
me of new notes
Company
Profile
|
UTA
-
|
$12.52
|
+0.15
|
324,493
58% DAV
563,900
|
7/28/2009
(Date
Featured) |
$12.87
(Price
Featured) |
PP = $12.70 |
G |
| MB = $13.34 |
Most Recent Note - 8/24/2009 4:35:06 PM
G - Quietly consolidating above support at its 50 DMA line and prior chart highs. A negative reversal on 8/13/09 for a loss on very heavy volume was noted as a clear sign of worrisome distributional pressure. Strong action prompted it to be featured in yellow with pivot point and max buy levels noted in the 7/28/09 mid-day breakouts report (read here), with additional analysis included in the after market update (read here).
>>> The latest Featured Stock Update with an annotated graph appeared on 8/20/2009. click here.
|
|
C
A
S
I |
News |
Chart |
SEC
View all notes Alert
me of new notes
Company
Profile
|
|
|
|
THESE ARE NOT BUY RECOMMENDATIONS!
Comments contained in the body of this report are technical
opinions only. The material herein has been obtained
from sources believed to be reliable and accurate, however,
its accuracy and completeness cannot be guaranteed.
This site is not an investment advisor, hence it does
not endorse or recommend any securities or other investments.
Any recommendation contained in this report may not
be suitable for all investors and it is not to be deemed
an offer or solicitation on our part with respect to
the purchase or sale of any securities. All trademarks,
service marks and trade names appearing in this report
are the property of their respective owners, and are
likewise used for identification purposes only.
This report is a service available
only to active Paid Premium Members.
You may opt-out of receiving report notifications
at any time. Questions or comments may be submitted
by writing to Premium Membership Services 665 S.E. 10 Street, Suite 201 Deerfield Beach, FL 33441-5634 or by calling 1-800-965-8307
or 954-785-1121.
|
|
|


