You are not logged in.
This means you
CAN ONLY VIEW reports that were published prior to Tuesday, March 11, 2025.
You
MUST UPGRADE YOUR MEMBERSHIP if you want to see any current reports.
AFTER MARKET UPDATE - FRIDAY, AUGUST 21ST, 2009
Previous After Market Report Next After Market Report >>>
|
|
|
|
DOW |
+155.91 |
9,505.96 |
+1.67% |
|
Volume |
1,475,897,480 |
+41% |
|
Volume |
2,292,206,900 |
+13% |
|
NASDAQ |
+31.68 |
2,020.90 |
+1.59% |
|
Advancers |
2,461 |
79% |
|
Advancers |
2,004 |
70% |
|
S&P 500 |
+18.76 |
1,026.13 |
+1.86% |
|
Decliners |
579 |
18% |
|
Decliners |
716 |
25% |
|
Russell 2000 |
+12.83 |
581.51 |
+2.26% |
|
52 Wk Highs |
95 |
|
|
52 Wk Highs |
66 |
|
|
S&P 600 |
+6.82 |
307.70 |
+2.27% |
|
52 Wk Lows |
1 |
|
|
52 Wk Lows |
3 |
|
|
 |
Follow-Through Gains And Expansion in Leadership Reconfirm Rally
Adam Sarhan, Contributing Writer,
This was a very interesting week on Wall Street as the market fell into a correction on Monday, then confirmed a new rally on Friday! Volume was higher than Thursday's levels on both exchanges, which was enough to help the major averages produce a follow-through day. Advancers led decliners by over a 4-to-1 ratio on the NYSE and by nearly a 3-to-1 ratio on the Nasdaq exchange. There were 24 high-ranked companies from the CANSLIM.net Leaders List that made a new 52-week high and appeared on the CANSLIM.net BreakOuts Page, up from the 14 issues that appeared on the prior session. New 52-week highs outnumbered new 52-week lows on both exchanges while new lows were in the single digits again.
On Monday, stocks tanked around the world, led by Asia, after disconcerting economic data from the Far East suggested the economic recovery may be in jeopardy. Leading growth stocks in the US took a pounding which led us to believe that the current rally was under pressure. However, the paper took it one step further and said that the market slid back into a correction. However, the bulls showed up on Tuesday and spent the rest of the week quelling the bearish pressure. On Tuesday, stocks bounced back on below average volume and helped the S&P 500 Index mark Day 1 of a new rally attempt.
The major averages ended higher on Wednesday as the US dollar tumbled. This marked Day 2 of the current rally attempt as the S&P 500 did not undercut Tuesday's lows (even though the other averages briefly did). CANSLIM.net's Market Commentary has noted multiple times in the past about how important it is in today's modern age to keep an eye on other markets since they are so interdependent. Energy shares were among the day's strongest advancers since crude oil managed to recover much that it lost earlier in the week. China's stock market fell another -5% which extended its decline from its 2009 high to over -20% which is the classic definition of a bear market. Normally, bear markets occur whenever a market or individual stock fall -20% from its most recent high. It is also important to note that China was one of the first of the globe's stock markets to recover from last year's brutal sell off. The fact it is back in "bear market" territory suggests that it may also lead the way lower again. So far, the U.S. and Chinese governments have pledged more than $13 trillion (the entire size of the US economy) to combat the worst financial crisis since the Great Depression. This massive influx of government aid played a pivotal role in fueling the major rally we have seen in stock markets around the globe. However, it was encouraging to see the bulls show up and defend the bearish pressure for the second straight day in the US.
Stocks edged higher on Thursday (Day 3) after Chinese stocks soared and American International Group Inc. (AIG +1.70%) said it plans to repay the government. Elsewhere, Treasury Secretary Timothy Geithner said he thinks the US economic recovery is still in the nascent stages as evidenced by the recent onslaught of stronger-than-expected earnings and economic data. Geithner said, "We have a long way to go, but we are starting to see signs of stability, and these signs mark the first steps to recovery." On the economic front, US leading economic indicators rose last month for a fourth straight month. The Conference Board’s gauge rose +0.6% for the longest consecutive series of increases since 2004. Another report showed that manufacturing in the Philadelphia region unexpectedly expanded this month which was the first increase in almost a year. The economic and manufacturing data added to recent flurry of evidence that the recession may be ending.
On Friday, stocks and commodities soared, sending both the S&P 500 Index and crude oil to fresh 10 month highs! The US dollar fell after US existing home sales jumped to the highest level in nearly two years. Home purchases rose to a 5.24 million annual rate in July which was the highest since the financial crisis began in late 2007. On a percentage basis, existing home sales rose +7.2% which was the largest rise since records began in 1999. The median price fell -15%. The rally was enough to send the major averages back into positive territory for the week which is considered a positive reversal on a weekly basis and is a healthy sign. Furthermore, a new rally is now in place which means that the path of least resistance is now higher and that 3 out of 4 growth stocks will follow the market.
Money Management Services:
Are you looking for a money manager who follows a proven set of rules? All of our portfolio managers have completed the Master's Program and are highly skilled at using this powerful investment system. You may inquire about having your account professionally managed using this fact-based investment system by clicking HERE. *Accounts over $250,000 please. ** Serious inquiries only.
PICTURED: The S&P 500 Index confirmed a new rally (produced a follow-through day) as it also rose above recent resistance. The major averages made an impressive "positive reversal" on a weekly basis which also bodes well for the near term market outlook
|
|
|
 |
Commodity, Financial, Retail and Tech Groups Post Solid Gains
Kenneth J. Gruneisen - Passed the CAN SLIM® Master's Exam
Commodity-linked areas were some of Friday's top gainers as the Integrated Oil Index ($XOI +2.87%), Oil Services Index ($OSX +3.86%), and Gold & Silver Index ($XAU +2.20%) posted solid gains. The Retail Index ($RLX +2.22%) and financial shares were an important positive influence on the major averages as the Bank Index ($BKX +2.57%) tallied a big gain and the Broker/Dealer Index ($XBD +0.88%) moved modestly higher. The tech sector indices were unanimously higher as the Semiconductor Index ($SOX +1.65%), Networking Index ($NWX +1.35%), Internet Index ($IIX +0.95%), and Biotechnology Index ($BTK +0.78%) rose, and the Healthcare Index ($HMO +0.74%) rounded out a widely positive session.
Charts courtesy www.stockcharts.com
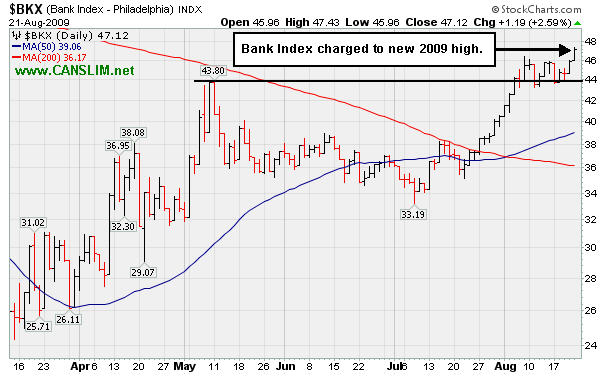
PICTURED: The Bank Index ($BKX +2.57%) charged to a new 2009 high, which is especially encouraging action concerning the broader market outlook. The financial group is an important leading indicator, as noted many times before in this report. The financial group led the major averages' breakdown in 2007 and has helped lead the recovery as well.
| Oil Services |
$OSX |
180.65 |
+6.77 |
+3.89% |
+48.82% |
| Healthcare |
$HMO |
1,222.59 |
+9.40 |
+0.77% |
+27.33% |
| Integrated Oil |
$XOI |
985.94 |
+27.68 |
+2.89% |
+0.64% |
| Semiconductor |
$SOX |
301.30 |
+4.89 |
+1.65% |
+42.01% |
| Networking |
$NWX |
214.44 |
+2.86 |
+1.35% |
+49.03% |
| Internet |
$IIX |
205.61 |
+1.94 |
+0.95% |
+53.70% |
| Broker/Dealer |
$XBD |
111.08 |
+0.99 |
+0.90% |
+43.38% |
| Retail |
$RLX |
366.35 |
+7.94 |
+2.22% |
+31.19% |
| Gold & Silver |
$XAU |
147.37 |
+3.15 |
+2.18% |
+18.99% |
| Bank |
$BKX |
47.12 |
+1.19 |
+2.59% |
+6.32% |
| Biotech |
$BTK |
879.18 |
+7.00 |
+0.80% |
+35.85% |
|
|
|
 |
Powerful Breakout For High Ranked Retail Clothing Firm
Kenneth J. Gruneisen - Passed the CAN SLIM® Master's Exam
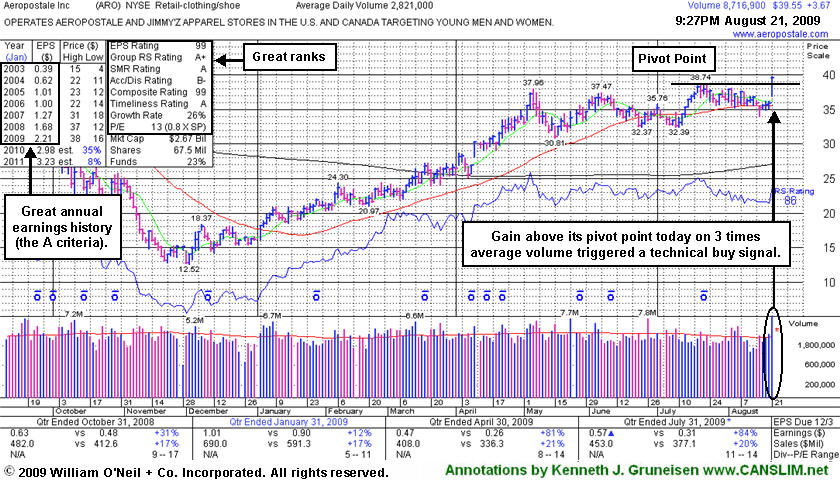
Aeropostale Inc (ARO +$3.67 or +9.28% to $39.55) is a high-ranked leader in the Retail - Clothing/shoe group that gapped up and hit a new all-time high today, rising from a flat base pattern triggering a technical buy signal. It was featured in yellow with new pivot point and max buy levels noted in the 8/21/09 Mid-Day BreakOuts Report (read here). It has a great annual earnings history (the A criteria), and the 2 latest quarterly comparisons showed +81% and +84% earnings increases, well above the investment system's +25% guideline. The number of top-rated funds owning an interest in its shares rose from 209 in Dec '08 to 232 in Jun '09, which is good news concerning the I criteria.
Disciplined investors avoid chasing stocks more than 5% above their pivot point, as doing so increases the chances that a normal pullback will prompt them to sell the stock -as investors should always limit losses by selling any stock that falls 7% from their buy price.
|
|
|
Color Codes Explained :
Y - Better candidates highlighted by our
staff of experts.
G - Previously featured
in past reports as yellow but may no longer be buyable under the
guidelines.
***Last / Change / Volume quote data in this table corresponds with the timestamp on the note***
Symbol/Exchange
Company Name
Industry Group |
Last |
Chg. |
Vol
% DAV |
Date Featured |
Price Featured |
Latest Pivot Point
Featured |
Status |
| Latest Max Buy Price |
ARO
- NYSE
Aeropostale Inc
RETAIL - Apparel Stores
|
$39.55
|
+3.67
|
8,830,398
313% DAV
2,821,000
|
8/21/2009
(Date
Featured) |
$39.21
(Price
Featured) |
PP = $38.84 |
Y |
| MB = $40.78 |
Most Recent Note - 8/21/2009 8:16:46 PM
Y - This high-ranked leader in the Retail - Clothing/shoe group gapped up and hit a new all-time high today, rising from a flat base pattern triggering a technical buy signal. It was featured in yellow with new pivot point and max buy levels noted in the 8/21/09 Mid-Day BreakOuts Report (read here). It has a good annual earnings history (the A criteria), and the 2 latest quarterly comparisons showed +81% and +84% earnings increases, well above the investment system's +25% guideline.
>>> The latest Featured Stock Update with an annotated graph appeared on 8/21/2009. click here.
|
|
C
A
S
I |
News |
Chart |
SEC
View all notes Alert
me of new notes
Company
Profile
|
CPLA
- NASDAQ
Capella Education Co
DIVERSIFIED SERVICES - Education and Training Services
|
$65.00
|
+0.35
|
139,811
69% DAV
202,300
|
7/9/2009
(Date
Featured) |
$59.69
(Price
Featured) |
PP = $62.06 |
Y |
| MB = $65.16 |
Most Recent Note - 8/21/2009 8:29:05 PM
Y - Quietly consolidating in a tight range on light volume at its 52-week high, still above its pivot point but below the "max buy" level. The Commercial Services-Schools Group has shown some leadership but has low ranks, and CPLA's Relative Strength rank has slumped to 55, under the 80+ guideline. Its small supply of only 13.9 million shares in the float could contribute to greater price volatility in the event of institutional accumulation or distribution. The number of top-rated funds owning an interest rose from 91 in Sept '08, to 136 as of June '09, which is reassuring with respect to the I criteria. It has a very good earnings history that satisfies the C & A criteria, while recent quarters showed steady sales revenues increases in the +17-18% range.
>>> The latest Featured Stock Update with an annotated graph appeared on 8/19/2009. click here.
|
|
C
A
S
I |
News |
Chart |
SEC
View all notes Alert
me of new notes
Company
Profile
|
CRM
- NYSE
Salesforce.com Inc
INTERNET - Internet Software & Services
|
$53.67
|
+7.49
|
9,550,808
570% DAV
1,674,700
|
8/16/2009
(Date
Featured) |
$47.12
(Price
Featured) |
PP = $45.59 |
Y |
| MB = $47.87 |
Most Recent Note - 8/21/2009 8:30:44 PM
Y - Today's "breakaway gap" for a considerable gain on more than 5 times average volume followed its latest quarterly financial report. A gain on the prior session backed by nearly 2.5 times average volume helped it rally back above its previously cited pivot point. A Stock Bulletin was published with detailed analysis and an annotated graph on 8/16/09 (read here).
>>> The latest Featured Stock Update with an annotated graph appeared on 8/16/2009. click here.
|
|
C
A
S
I |
News |
Chart |
SEC
View all notes Alert
me of new notes
Company
Profile
|
GMCR
- NASDAQ
Green Mtn Coffee Roastrs
FOOD & BEVERAGE - Processed & Packaged Goods
|
$58.34
|
-0.16
|
1,438,021
87% DAV
1,655,600
|
7/17/2009
(Date
Featured) |
$60.15
(Price
Featured) |
PP = $63.79 |
G |
| MB = $66.98 |
Most Recent Note - 8/21/2009 8:33:34 PM
G - Trading under its 50 DMA line which is now downward sloping, with the next support at prior chart lows in the $53 area. Its gap down and considerable loss on 8/17/09 on heavy volume triggered technical sell signals, capping a 6 session losing streak as it violated its 50 DMA line, prior highs in the $62-63 area, and an upward trendline. GMCR traded up more than +168% since appearing with an annotated graph under the headline "It May Soon Be Time To Go Green" when featured in the January 2009 CANSLIM.net News (read here).
>>> The latest Featured Stock Update with an annotated graph appeared on 8/14/2009. click here.
|
|
C
A
S
I |
News |
Chart |
SEC
View all notes Alert
me of new notes
Company
Profile
|
LFT
-
|
$28.05
|
+0.44
|
689,727
82% DAV
843,600
|
8/10/2009
(Date
Featured) |
$31.49
(Price
Featured) |
PP = $30.57 |
G |
| MB = $32.10 |
Most Recent Note - 8/21/2009 8:37:44 PM
G - Gain today with light volume after rebounding above its 50 DMA line on the prior session. In the past week it fell substantially on heavy volume indicative of distributional pressure.
>>> The latest Featured Stock Update with an annotated graph appeared on 8/12/2009. click here.
|
|
C
A
S
I |
News |
Chart |
SEC
View all notes Alert
me of new notes
Company
Profile
|
NTES
- NASDAQ
Netease Inc Adr
INTERNET - Internet Information Providers
|
$42.50
|
+0.76
|
1,894,472
79% DAV
2,405,800
|
7/17/2009
(Date
Featured) |
$39.29
(Price
Featured) |
PP = $38.74 |
G |
| MB = $40.68 |
Most Recent Note - 8/21/2009 8:39:07 PM
G - Thus far it has found support near its short-term average and above prior chart highs in the $38 area. A 8/13/09 gap down for a considerable loss on nearly 4 times average volume triggered a technical sell signal.
>>> The latest Featured Stock Update with an annotated graph appeared on 8/13/2009. click here.
|
|
C
A
S
I |
News |
Chart |
SEC
View all notes Alert
me of new notes
Company
Profile
|
NVEC
- NASDAQ
N V E Corp
ELECTRONICS - Semiconductor - Specialized
|
$54.66
|
+2.19
|
84,520
89% DAV
94,900
|
3/13/2009
(Date
Featured) |
$33.85
(Price
Featured) |
PP = $49.60 |
G |
| MB = $52.08 |
Most Recent Note - 8/21/2009 8:40:42 PM
G - Consolidating above important initial support at its 50 DMA line (now $49.21) and prior chart highs. Quarterly sales revenues in the 6 million dollar range are still rather minuscule, leaving concerns.
>>> The latest Featured Stock Update with an annotated graph appeared on 8/18/2009. click here.
|
|
C
A
S
I |
News |
Chart |
SEC
View all notes Alert
me of new notes
Company
Profile
|
PEGA
- NASDAQ
Pegasystems Inc
COMPUTER SOFTWARE & SERVICES - Business Software & Services
|
$29.91
|
+1.27
|
488,083
156% DAV
312,800
|
7/29/2009
(Date
Featured) |
$27.53
(Price
Featured) |
PP = $27.49 |
Y |
| MB = $28.86 |
Most Recent Note - 8/21/2009 8:42:34 PM
Y - Posted 4 consecutive gains this week after holding its ground above its 50 DMA line. Color code was changed to yellow based on its resilience near its short-term average and pivot point. Previous resistance in the mid-$27 area has been noted as an important technical support level to watch above its 50 DMA line.
>>> The latest Featured Stock Update with an annotated graph appeared on 8/11/2009. click here.
|
|
C
A
S
I |
News |
Chart |
SEC
View all notes Alert
me of new notes
Company
Profile
|
UTA
-
|
$12.37
|
-0.30
|
487,917
86% DAV
566,200
|
7/28/2009
(Date
Featured) |
$12.87
(Price
Featured) |
PP = $12.70 |
G |
| MB = $13.34 |
Most Recent Note - 8/21/2009 8:43:46 PM
G - Quietly consolidating above its 50 DMA line near prior chart highs. A negative reversal on 8/13/09 for a loss on very heavy volume was noted as a clear sign of worrisome distributional pressure. Strong action prompted it to be featured in yellow with pivot point and max buy levels noted in the 7/28/09 mid-day breakouts report (read here), with additional analysis included in the after market update (read here).
>>> The latest Featured Stock Update with an annotated graph appeared on 8/20/2009. click here.
|
|
C
A
S
I |
News |
Chart |
SEC
View all notes Alert
me of new notes
Company
Profile
|
|
 |
| Subscriber Questions: |
August 20, 2009 |
Ken,
Did CRM stock send a technical buy signal today (Thursday, August 20, 2009) as it surpassed its pivot point with 240% DAV? If so, please say that in your notes. That's what I'm paying for in my subscription.
Richard |
| Ken's Response: |
August 21, 2009 |
Richard,
In response to your complaint, I am sorry to have fallen short of your expectations on the ongoing analysis we provide. It could have been worded yesterday that CRM's gain on heavy volume "triggered a technical buy signal" but that verbiage was specifically avoided for several reasons. Most importantly, the M criteria. Recent market conditions had shown distribution and deterioration which were noted in the ongoing Market Commentaries, so the investment system argued against any new buys. When CRM reclaimed its pivot point yesterday, it was not a fresh technical buy signal, the stock was only rebounding after encountering distributional pressure. Please note that, despite waning market leadership, we stepped up and took advantage of a rare opportunity to publish the Stock Bulletin on Sunday, 8/16/09, alerting members after CRM had already triggered a recent technical buy signal -yet while it was still within 5% of its pivot point. Since that time, we have published updated notes daily, providing ongoing analysis (You can view some of the most recent notes on CRM via the "view all notes" links.) As you are an experienced member who has had some time to get familiar with CANSLIM.net, I appreciate your suggestions on how we can be any more clear and helpful in the future.
Stock Bulletins are not part of a routine daily or monthly report that we publish for CANSLIM.net's paying members, they are occasionally prepared as the market action dictates. The most action-worthy new ideas show up more often highlighted in yellow in the CANSLIM.net Mid-Day BreakOuts Report, or in the monthly issue of CANSLIM.net News. Market conditions in many recent months have been such that far fewer ideas than we would like have been worthy of the full blown coverage typically provided on stocks in the monthly newsletter, let alone special bulletins. The last bulletin published prior to CRM was more than a year ago - 6/04/2008 Almost Family (AFAM).
Based on today's better MARKET action, I believe the authorities would agree we are back in a "confirmed rally" and the M has shown us fresh reasons to be more proactive about buying again. CRM's "breakaway gap" today was part of the important batch of new leadership making that so. I will go on to add that we have in the past noted the "breakaway gap" as one valid exception to the rule which limits investors from buying stocks at more than 5% above their prior chart high or pivot point. We have in the past seen the newspaper and experts teaching the Certification suggest that in a very bullish market environment it is permissible to buy stocks as much as 10% above their prior highs when a stock stages a powerful breakaway gap.
I will leave it to you to decide if the market is "very bullish" and determine what course of action suits you best. I believe this example validates the service we provide as helpful in assisting investors toward their goal of identifying action-worthy buy candidates and getting "above average" results. In terms of feedback on CRM (+13.9% for the the week) thus far, we have received no praise and only one complaint. The gains for the week from the major averages were Nasdaq +1.8%, Dow +2.0%, and SPX +2.2%.

Kenneth J. Gruneisen
Founder & Contributing Writer for CANSLIM.net StockNews
www.canslim.net |
|
|
|
THESE ARE NOT BUY RECOMMENDATIONS!
Comments contained in the body of this report are technical
opinions only. The material herein has been obtained
from sources believed to be reliable and accurate, however,
its accuracy and completeness cannot be guaranteed.
This site is not an investment advisor, hence it does
not endorse or recommend any securities or other investments.
Any recommendation contained in this report may not
be suitable for all investors and it is not to be deemed
an offer or solicitation on our part with respect to
the purchase or sale of any securities. All trademarks,
service marks and trade names appearing in this report
are the property of their respective owners, and are
likewise used for identification purposes only.
This report is a service available
only to active Paid Premium Members.
You may opt-out of receiving report notifications
at any time. Questions or comments may be submitted
by writing to Premium Membership Services 665 S.E. 10 Street, Suite 201 Deerfield Beach, FL 33441-5634 or by calling 1-800-965-8307
or 954-785-1121.
|
|
|


