You are not logged in.
This means you
CAN ONLY VIEW reports that were published prior to Monday, April 14, 2025.
You
MUST UPGRADE YOUR MEMBERSHIP if you want to see any current reports.
AFTER MARKET UPDATE - THURSDAY, AUGUST 22ND, 2013
Previous After Market Report Next After Market Report >>>
|
|
|
|
DOW |
+66.19 |
14,963.74 |
+0.44% |
|
Volume |
573,201,200 |
-13% |
|
Volume |
891,702,270 |
-36% |
|
NASDAQ |
+38.97 |
3,638.76 |
+1.08% |
|
Advancers |
2,576 |
82% |
|
Advancers |
1,968 |
77% |
|
S&P 500 |
+14.16 |
1,656.96 |
+0.86% |
|
Decliners |
480 |
15% |
|
Decliners |
519 |
20% |
|
Russell 2000 |
+14.62 |
1,036.20 |
+1.43% |
|
52 Wk Highs |
68 |
|
|
52 Wk Highs |
76 |
|
|
S&P 600 |
+7.86 |
587.57 |
+1.36% |
|
52 Wk Lows |
74 |
|
|
52 Wk Lows |
19 |
|
|
 |
Major Averages Posted Gains With Positive Breadth
Kenneth J. Gruneisen - Passed the CAN SLIM® Master's Exam
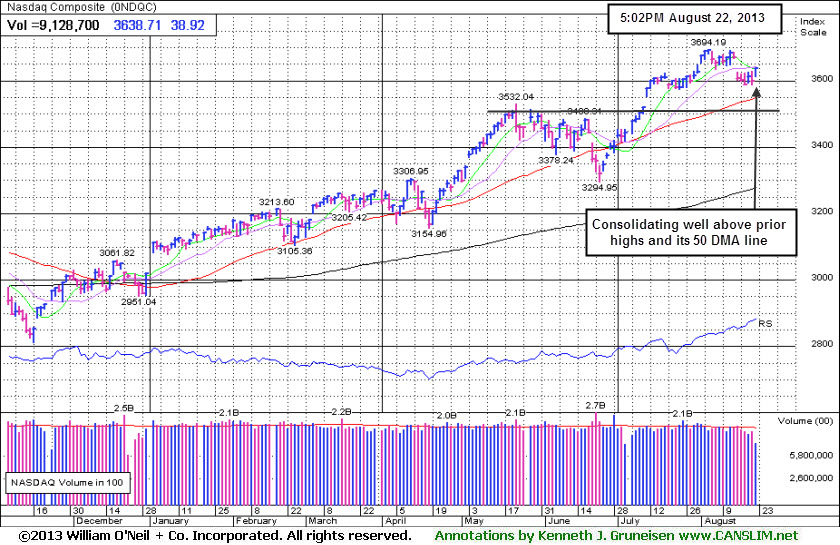
On Thursday the major averages posted gains and finished near their best levels of the day. The volume totals were reported lighter than the prior session totals on the NYSE and on the Nasdaq exchange, an indication that buying power coming from the institutional crowd was timid. Breadth was solidly positive as advancers led decliners by mre than a 5-1 margin on the NYSE and by nearly a 4-1 margin on the Nasdaq exchange. There were 21 high-ranked companies from the CANSLIM.net Leaders List that made new 52-week highs and appeared on the CANSLIM.net BreakOuts Page, up from a total of 13 stocks on the prior session. The list of stocks hitting new 52-week lows outnumbered new 52-week highs on the NYSE while new highs outnumbered new lows again on the Nasdaq exchange. There were gains for 14 of the 16 high-ranked companies currently included on the Featured Stocks Page. The market (M criteria) clearly signaled that the major averages are in a "correction" based on recent technical damage. Individual holdings should be closely monitored for any worrisome technical sell signals. This is precisely how the fact-based system helps investors avoid serious setbacks and raise cash levels during market downdrafts. Historic studies suggest that no new buying efforts should be made during market corrections.
Stocks were higher from the opening bell as positive manufacturing data in the U.S., China, and Europe boosted investors’ optimism. Equities managed to hold onto gains even after technical issues caused the Nasdaq exchange to halt trading for three hours.
All 10 sectors on the S&P ended higher. Energy stocks were the best performers as gains in crude oil and natural gas price lifted the group including shares of Apache Corp (APA +2.3%). On the earnings front, Hewlett-Packard (HPQ -12.4%) tumbled after the company posted earnings that were in-line with expectations, but offered a cautious forecast. Also on the downside, Abercrombie & Fitch (ANF -17.6%) and Sears Holdings (SHLD -8.2%) slumped badly following their profit tallies.
Turning to fixed income markets, Treasuries were mixed along the curve. The benchmark 10-year note was down 1/32 to yield 2.90% and the 30-year bond was higher by 7/8 of a point to yield 3.87%.
Stay familiar with companies listed on the CANSLIM.net Featured Stocks Page - a page showing the most action-worthy candidates' latest notes and links to additional resources including detailed analysis with data-packed graphs which are annotated by a Certified expert. The Premium Member Homepage - includes "dynamic archives" to all prior pay reports published. Watch for an announcement via email concerning the next WEBCAST.
PICTURED: The Nasdaq Composite Index is consolidating well above prior highs and its 50-day moving average (DMA) line.
|
 Kenneth J. Gruneisen started out as a licensed stockbroker in August 1987, a couple of months prior to the historic stock market crash that took the Dow Jones Industrial Average down -22.6% in a single day. He has published daily fact-based fundamental and technical analysis on high-ranked stocks online for two decades. Through FACTBASEDINVESTING.COM, Kenneth provides educational articles, news, market commentary, and other information regarding proven investment systems that work in good times and bad.
Comments contained in the body of this report are technical opinions only and are not necessarily those of Gruneisen Growth Corp. The material herein has been obtained from sources believed to be reliable and accurate, however, its accuracy and completeness cannot be guaranteed. Our firm, employees, and customers may effect transactions, including transactions contrary to any recommendation herein, or have positions in the securities mentioned herein or options with respect thereto. Any recommendation contained in this report may not be suitable for all investors and it is not to be deemed an offer or solicitation on our part with respect to the purchase or sale of any securities. |
|
 |
Financial, Retail, Tech, Commodity-Linked, and Defensive Groups Rose
Kenneth J. Gruneisen - Passed the CAN SLIM® Master's Exam
Financial shares' gains helped underpin the major averages rally attempt as the influential Broker/Dealer Index ($XBD +1.16%) and the Bank Index ($BKX +1.50%) both rose, and the Retail Index ($RLX +0.80%) also posted a modest gain. The tech sector saw unanimous gains from the Networking Index ($NWX +1.22%), Internet Index ($IIX +1.14%), Semiconductor Index ($SOX +1.16%), and the Biotechnology Index ($BTK +0.94%). Energy-related shares drifted higher as the Integrated Oil Index ($XOI +0.97%) and Oil Services Index ($OSX +1.50%) ratcheted higher. Defensive groups also gained ground as the Healthcare Index ($HMO +1.07%) and Gold & Silver Index ($XAU +1.84%) rounded out Thursday's solidly positive session.
Charts courtesy www.stockcharts.com
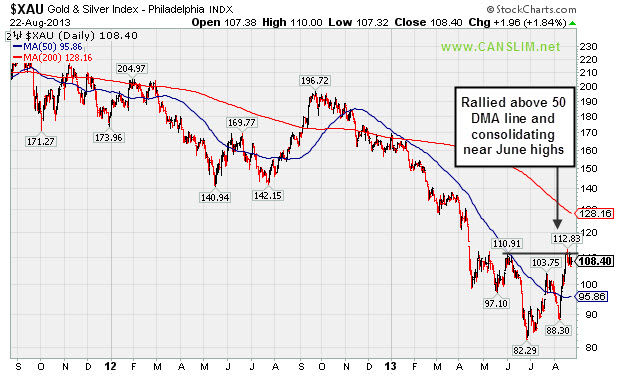
PICTURED: The Gold & Silver Index ($XAU +1.84%) has rallied above its 50-day moving average (DMA) line and is consolidating near its June highs.
| Oil Services |
$OSX |
259.76 |
+3.84 |
+1.50% |
+17.99% |
| Healthcare |
$HMO |
3,379.73 |
+35.75 |
+1.07% |
+34.43% |
| Integrated Oil |
$XOI |
1,356.06 |
+13.01 |
+0.97% |
+9.20% |
| Semiconductor |
$SOX |
463.83 |
+5.30 |
+1.16% |
+20.77% |
| Networking |
$NWX |
286.34 |
+3.45 |
+1.22% |
+26.39% |
| Internet |
$IIX |
400.85 |
+4.51 |
+1.14% |
+22.59% |
| Broker/Dealer |
$XBD |
134.12 |
+1.54 |
+1.16% |
+42.18% |
| Retail |
$RLX |
821.02 |
+6.48 |
+0.80% |
+25.72% |
| Gold & Silver |
$XAU |
108.40 |
+1.96 |
+1.84% |
-34.54% |
| Bank |
$BKX |
65.03 |
+0.96 |
+1.50% |
+26.81% |
| Biotech |
$BTK |
2,088.58 |
+19.48 |
+0.94% |
+35.01% |
|
|
|
 |
Finding Support Well Above 50-Day Average
Kenneth J. Gruneisen - Passed the CAN SLIM® Master's Exam
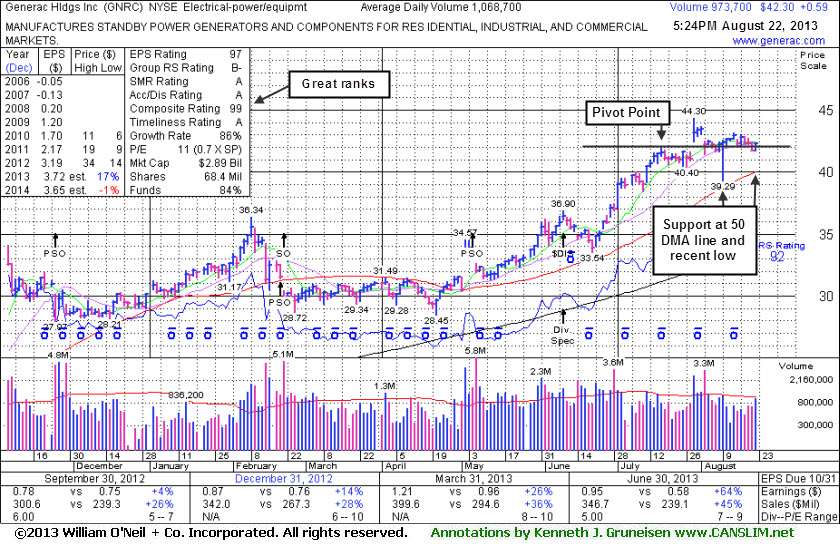
Generac Hldgs Inc (GNRC +$0.59 or +1.41% to $42.30) is holding its ground stubbornly near prior highs after it recently rallied from an advanced "3-weeks tight" base and priced a Secondary Offering. Disciplined investors always limit losses by selling if any stock falls more than -7% from its purchase price. The high-ranked Electrical - Power/Equipment firm was last shown in this FSU section with an annotated graph on 7/30/13 under the headline, "Gapped Up Following Strong Earnings News", after highlighted in yellow with pivot point based on its 7/17/13 high plus 10 cents with an annotated weekly graph in the earlier mid-day report (read here). Its considerable gain was backed by more than 2 times average volume, triggering a technical buy signal
It reported earnings +64% on +45% sales for the June '13 quarter versus the year ago period. Recent quarterly comparisons show impressive sequential acceleration in its sales revenues and earnings growth, making it a better match with the C criteria of the fact-based system. Previously noted consensus estimates calling for FY '13 earnings growth of +17% and FY '14 at -1%, and its currently low P/E valuation (0.7 X SP) suggest a timid outlook for future growth, which is cause for some concern.
The number of top-rated funds owning its shares rose from 201 in Dec '12 to 365 in Jun '13, an encouraging sign concerning the I criteria. Its current Up/Down Volume Ratio of 1.3 is also an unbiased indication that it shares have been under accumulation over the past 50 days. Disciplined investors avoid chasing stocks if they get extended more than +5% above their pivot point, and they always limit losses by selling if any stock falls more than -7% from their purchase price.
Keep in mind that the broader market direction (M criteria) weighs heavily into the mix as historic studies showed that 3 out of 4 stocks typically move in the same direction of the major averages. For as long as the current market correction continues, odds are not favorable for most stocks making meaningful headway.
Pay close attention to stocks that hold up well during corrections and watch for those that are the first ones breaking into new high ground upon any new confirmed rally. Meanwhile, if holding onto current gains, investors should stand ready to reduce exposure before too much damage starts to mount. Disciplined investors always limit losses by selling any stock that falls more than -7% from their purchase price, but sometimes weak technical action may hint that it is a smart time to sell even before losses reach that important maximum loss threshold.
 |
|
|
Color Codes Explained :
Y - Better candidates highlighted by our
staff of experts.
G - Previously featured
in past reports as yellow but may no longer be buyable under the
guidelines.
***Last / Change / Volume data in this table is the closing quote data***
Symbol/Exchange
Company Name
Industry Group |
PRICE |
CHANGE
(%Change) |
Day High |
Volume
(% DAV)
(% 50 day avg vol) |
52 Wk Hi
% From Hi |
Featured
Date |
Price
Featured |
Pivot Featured |
|
Max Buy |
BITA
-
NYSE
Bitauto Hldgs Ltd Ads
INTERNET - Internet Information Providers
|
$15.10
|
+0.81
5.67% |
$15.80
|
479,749
241.44% of 50 DAV
50 DAV is 198,700
|
$18.10
-16.57%
|
8/7/2013
|
$12.01
|
PP = $13.30
|
|
MB = $13.97
|
 Most Recent Note - 8/22/2013 5:48:25 PM
G - Tallied 3 gains with above average volume in the span of 4 sessions since finding prompt support near prior highs. Consolidating well above its 50 DMA line. Disciplined investors always limit losses if any stock falls more than -7-8% from their purchase price.
>>> The latest Featured Stock Update with an annotated graph appeared on 8/7/2013. Click here.
View all notes |
Alert me of new notes |
CANSLIM.net Company Profile |
SEC |
Zacks Reports |
StockTalk |
News |
Chart |
Request a new note
C
A N
S L
I M


|
CELG
-
NASDAQ
Celgene Corp
DRUGS - Drug Manufacturers - Major
|
$137.91
|
+0.34
0.25% |
$139.00
|
1,273,092
49.74% of 50 DAV
50 DAV is 2,559,400
|
$149.92
-8.01%
|
7/11/2013
|
$133.25
|
PP = $131.92
|
|
MB = $138.52
|
Most Recent Note - 8/21/2013 9:42:54 PM
Y - Consolidating above prior highs in the $131 area coinciding with its 50 DMA line, defining important chart support. See the latest FSU analysis for more details and a new annotated graph.
>>> The latest Featured Stock Update with an annotated graph appeared on 8/21/2013. Click here.
View all notes |
Alert me of new notes |
CANSLIM.net Company Profile |
SEC |
Zacks Reports |
StockTalk |
News |
Chart |
Request a new note
C
A N
S L
I M
|
FLT
-
NYSE
Fleetcor Technologies
DIVERSIFIED SERVICES - Business/Management Services
|
$103.12
|
+6.16
6.35% |
$104.80
|
1,039,884
155.79% of 50 DAV
50 DAV is 667,500
|
$100.87
2.23%
|
8/19/2013
|
$99.01
|
PP = $100.97
|
|
MB = $106.02
|
Most Recent Note - 8/22/2013 5:50:19 PM
Y- Rallied with above average volume today, rising from an advanced "3-weeks tight" base, albeit a riskier "late stage" base. It cleared the new pivot point with +56% above average volume. Keep in mind the M criteria argues against new buying efforts until a new confirmed rally.
>>> The latest Featured Stock Update with an annotated graph appeared on 8/12/2013. Click here.
View all notes |
Alert me of new notes |
CANSLIM.net Company Profile |
SEC |
Zacks Reports |
StockTalk |
News |
Chart |
Request a new note
C
A N
S L
I M
|
GNRC
-
NYSE
Generac Hldgs Inc
CONSUMER DURABLES - Electronic Equipment
|
$42.30
|
+0.59
1.41% |
$42.30
|
978,007
91.51% of 50 DAV
50 DAV is 1,068,700
|
$44.30
-4.51%
|
7/30/2013
|
$42.60
|
PP = $42.10
|
|
MB = $44.21
|
Most Recent Note - 8/22/2013 5:46:33 PM
Y - Holding its ground stubbornly after it recently rallied from an advanced "3-weeks tight" base and priced a Secondary Offering. Disciplined investors always limit losses by selling if any stock falls more than -7% from its purchase price. See the latest FSU analysis for more details and a new annotated graph.
>>> The latest Featured Stock Update with an annotated graph appeared on 8/22/2013. Click here.
View all notes |
Alert me of new notes |
CANSLIM.net Company Profile |
SEC |
Zacks Reports |
StockTalk |
News |
Chart |
Request a new note
C
A N
S L
I M
|
KORS
-
NYSE
Michael Kors Hldgs Ltd
RETAIL - Apparel Stores
|
$72.19
|
+0.54
0.75% |
$72.45
|
1,796,666
50.95% of 50 DAV
50 DAV is 3,526,200
|
$72.98
-1.08%
|
8/6/2013
|
$69.66
|
PP = $66.28
|
|
MB = $69.59
|
Most Recent Note - 8/15/2013 7:19:05 PM
G - Holding its ground beyond its "max buy" level. Prior highs in the $66 area define initial support to watch on pullbacks.
>>> The latest Featured Stock Update with an annotated graph appeared on 8/6/2013. Click here.
View all notes |
Alert me of new notes |
CANSLIM.net Company Profile |
SEC |
Zacks Reports |
StockTalk |
News |
Chart |
Request a new note
C
A N
S L
I M
|
Symbol/Exchange
Company Name
Industry Group |
PRICE |
CHANGE
(%Change) |
Day High |
Volume
(% DAV)
(% 50 day avg vol) |
52 Wk Hi
% From Hi |
Featured
Date |
Price
Featured |
Pivot Featured |
|
Max Buy |
LOPE
-
NASDAQ
Grand Canyon Education
DIVERSIFIED SERVICES - Education and; Training Services
|
$33.66
|
+0.37
1.11% |
$33.98
|
104,725
23.48% of 50 DAV
50 DAV is 446,000
|
$37.17
-9.44%
|
6/19/2013
|
$31.47
|
PP = $34.17
|
|
MB = $35.88
|
Most Recent Note - 8/21/2013 9:47:50 PM
G - Color code is changed to green as it has slumped below its 50 DMA line. Recently reported earnings +15% on +19% sales for the Jun '13 quarter, below the +25% minimum earnings guideline (C criteria), raising fundamental concerns.
>>> The latest Featured Stock Update with an annotated graph appeared on 8/14/2013. Click here.
View all notes |
Alert me of new notes |
CANSLIM.net Company Profile |
SEC |
Zacks Reports |
StockTalk |
News |
Chart |
Request a new note
C
A N
S L
I M
|
PCLN
-
NASDAQ
Priceline.Com Inc
INTERNET - Internet Software and Services
|
$952.15
|
+11.95
1.27% |
$954.43
|
369,247
52.00% of 50 DAV
50 DAV is 710,100
|
$994.98
-4.30%
|
7/8/2013
|
$878.28
|
PP = $847.43
|
|
MB = $889.80
|
Most Recent Note - 8/16/2013 6:57:21 PM
G - Consolidating above prior highs, extended from any sound base. Reported earnings +24% on +27% sales revenues for the Jun '13 quarter, just under the +25% minimum earnings guideline (C criteria).
>>> The latest Featured Stock Update with an annotated graph appeared on 8/19/2013. Click here.
View all notes |
Alert me of new notes |
CANSLIM.net Company Profile |
SEC |
Zacks Reports |
StockTalk |
News |
Chart |
Request a new note
C
A N
S L
I M
|
PRAA
-
NASDAQ
Portfolio Recovery Assoc
DIVERSIFIED SERVICES - Business/Management Services
|
$54.72
|
+0.24
0.44% |
$55.27
|
207,492
39.73% of 50 DAV
50 DAV is 522,300
|
$57.57
-4.95%
|
7/31/2013
|
$51.43
|
PP = $54.72
|
|
MB = $57.46
|
Most Recent Note - 8/21/2013 9:53:49 PM
Y - Holding its ground near prior highs with volume totals cooling in recent weeks. Any slump below its old high close ($53.86 on 6/17/13) would raise greater concerns as it would completely negate the recent technical breakout.
>>> The latest Featured Stock Update with an annotated graph appeared on 8/2/2013. Click here.
View all notes |
Alert me of new notes |
CANSLIM.net Company Profile |
SEC |
Zacks Reports |
StockTalk |
News |
Chart |
Request a new note
C
A N
S L
I M
|
PRLB
-
NYSE
Proto Labs Inc
MANUFACTURING - Small Tools and Accessories
|
$70.84
|
+0.83
1.19% |
$71.10
|
274,701
55.18% of 50 DAV
50 DAV is 497,800
|
$72.08
-1.72%
|
7/29/2013
|
$64.86
|
PP = $67.50
|
|
MB = $70.88
|
Most Recent Note - 8/19/2013 12:09:12 PM
Y - Recently consolidating above its 50 DMA line with volume totals cooling in recent weeks. That important short-term average and prior lows define important support to watch. Disciplined investors always limit losses if any stock falls more than -7% from their purchase price.
>>> The latest Featured Stock Update with an annotated graph appeared on 8/5/2013. Click here.
View all notes |
Alert me of new notes |
CANSLIM.net Company Profile |
SEC |
Zacks Reports |
StockTalk |
News |
Chart |
Request a new note
C
A N
S L
I M
|
QCOR
-
NASDAQ
Questcor Pharmaceuticals
DRUGS - Biotechnology
|
$68.43
|
+0.60
0.88% |
$68.85
|
637,576
35.32% of 50 DAV
50 DAV is 1,805,300
|
$70.55
-3.00%
|
7/31/2013
|
$66.46
|
PP = $59.01
|
|
MB = $61.96
|
Most Recent Note - 8/21/2013 9:11:57 PM
G - Gapped up today for a solid gain, bucking a mostly negative market. It is extended beyond its "max buy" level, consolidating in a tight trading range for the past 3 weeks.
>>> The latest Featured Stock Update with an annotated graph appeared on 8/1/2013. Click here.
View all notes |
Alert me of new notes |
CANSLIM.net Company Profile |
SEC |
Zacks Reports |
StockTalk |
News |
Chart |
Request a new note
C
A N
S L
I M
|
Symbol/Exchange
Company Name
Industry Group |
PRICE |
CHANGE
(%Change) |
Day High |
Volume
(% DAV)
(% 50 day avg vol) |
52 Wk Hi
% From Hi |
Featured
Date |
Price
Featured |
Pivot Featured |
|
Max Buy |
SFUN
-
NYSE
Soufun Hldgs Ltd Ads A
INTERNET - Internet Information Providers
|
$39.71
|
-0.96
-2.36% |
$40.98
|
2,816,530
565.00% of 50 DAV
50 DAV is 498,500
|
$42.15
-5.79%
|
7/16/2013
|
$29.54
|
PP = $27.90
|
|
MB = $29.30
|
Most Recent Note - 8/22/2013 5:53:02 PM
G - Trading near its 52-week high today it pulled back while it traded very heavy volume. It is very extended from its latest base, and prior reports noted - "Disciplined investors avoid chasing stocks too extended from sound bases."
>>> The latest Featured Stock Update with an annotated graph appeared on 8/8/2013. Click here.
View all notes |
Alert me of new notes |
CANSLIM.net Company Profile |
SEC |
Zacks Reports |
StockTalk |
News |
Chart |
Request a new note
C
A N
S L
I M
|
SSNC
-
NASDAQ
S S & C Technologies
COMPUTER SOFTWARE and SERVICES - Application Software
|
$35.84
|
+0.49
1.39% |
$35.87
|
107,650
25.67% of 50 DAV
50 DAV is 419,400
|
$38.80
-7.63%
|
7/11/2013
|
$35.80
|
PP = $34.54
|
|
MB = $36.27
|
Most Recent Note - 8/16/2013 6:58:24 PM
Y - Still trading above its 50 DMA line and prior highs in the $34 area defining important support. Disciplined investors always limit losses if ever any stock falls more than -7% from their purchase price.
>>> The latest Featured Stock Update with an annotated graph appeared on 8/9/2013. Click here.
View all notes |
Alert me of new notes |
CANSLIM.net Company Profile |
SEC |
Zacks Reports |
StockTalk |
News |
Chart |
Request a new note
C
A N
S L
I M
|
SSYS
-
NASDAQ
Stratasys Ltd
COMPUTER HARDWARE - Computer Peripherals
|
$105.78
|
+1.27
1.22% |
$105.97
|
334,219
40.57% of 50 DAV
50 DAV is 823,900
|
$107.13
-1.26%
|
7/8/2013
|
$91.44
|
PP = $95.00
|
|
MB = $99.75
|
Most Recent Note - 8/19/2013 12:02:45 PM
G - Considerable gain today for a new 52-week high, rallying above its "max buy" level again, and its color code is changed to green
>>> The latest Featured Stock Update with an annotated graph appeared on 8/16/2013. Click here.
View all notes |
Alert me of new notes |
CANSLIM.net Company Profile |
SEC |
Zacks Reports |
StockTalk |
News |
Chart |
Request a new note
C
A N
S L
I M
|
STMP
-
NASDAQ
Stamps.Com Inc
INTERNET - Internet Software and Services
|
$42.08
|
+1.06
2.58% |
$42.25
|
95,470
72.00% of 50 DAV
50 DAV is 132,600
|
$46.47
-9.45%
|
7/31/2013
|
$40.00
|
PP = $42.98
|
|
MB = $45.13
|
Most Recent Note - 8/22/2013 5:54:03 PM
Y - Posted a 5th consecutive gain with below average volume. Recently found support at its 50 DMA line.
>>> The latest Featured Stock Update with an annotated graph appeared on 7/31/2013. Click here.
View all notes |
Alert me of new notes |
CANSLIM.net Company Profile |
SEC |
Zacks Reports |
StockTalk |
News |
Chart |
Request a new note
C
A N
S L
I M
|
VRX
-
NYSE
Valeant Pharmaceuticals
DRUGS - Drug Manufacturers - Other
|
$99.30
|
-0.47
-0.47% |
$100.12
|
1,098,147
68.31% of 50 DAV
50 DAV is 1,607,600
|
$105.40
-5.79%
|
4/30/2013
|
$60.24
|
PP = $76.66
|
|
MB = $80.49
|
Most Recent Note - 8/15/2013 7:10:07 PM
G- Holding its ground after rallying into new 52-week high territory with 9 gains in the span of 10 sessions. Reported earnings +33% on +34% sales revenues for the Jun '13 quarter, above the +25% minimum earnings guideline (C criteria). See the latest FSU analysis for more details and a new annotated graph.
>>> The latest Featured Stock Update with an annotated graph appeared on 8/15/2013. Click here.
View all notes |
Alert me of new notes |
CANSLIM.net Company Profile |
SEC |
Zacks Reports |
StockTalk |
News |
Chart |
Request a new note
C
A N
S L
I M
|
Symbol/Exchange
Company Name
Industry Group |
PRICE |
CHANGE
(%Change) |
Day High |
Volume
(% DAV)
(% 50 day avg vol) |
52 Wk Hi
% From Hi |
Featured
Date |
Price
Featured |
Pivot Featured |
|
Max Buy |
YNDX
-
NASDAQ
Yandex N V Class A
INTERNET - Internet Information Providers
|
$33.30
|
+0.57
1.74% |
$33.82
|
993,950
39.97% of 50 DAV
50 DAV is 2,486,900
|
$34.79
-4.28%
|
7/10/2013
|
$29.29
|
PP = $29.59
|
|
MB = $31.07
|
Most Recent Note - 8/19/2013 12:15:13 PM
G - Retreating from its 52-week high hit last week. Its 50 DMA line coincides with prior highs in the $29 area defining important near-term support to watch.
>>> The latest Featured Stock Update with an annotated graph appeared on 8/20/2013. Click here.
View all notes |
Alert me of new notes |
CANSLIM.net Company Profile |
SEC |
Zacks Reports |
StockTalk |
News |
Chart |
Request a new note
C
A N
S L
I M
|
|
|
|
THESE ARE NOT BUY RECOMMENDATIONS!
Comments contained in the body of this report are technical
opinions only. The material herein has been obtained
from sources believed to be reliable and accurate, however,
its accuracy and completeness cannot be guaranteed.
This site is not an investment advisor, hence it does
not endorse or recommend any securities or other investments.
Any recommendation contained in this report may not
be suitable for all investors and it is not to be deemed
an offer or solicitation on our part with respect to
the purchase or sale of any securities. All trademarks,
service marks and trade names appearing in this report
are the property of their respective owners, and are
likewise used for identification purposes only.
This report is a service available
only to active Paid Premium Members.
You may opt-out of receiving report notifications
at any time. Questions or comments may be submitted
by writing to Premium Membership Services 665 S.E. 10 Street, Suite 201 Deerfield Beach, FL 33441-5634 or by calling 1-800-965-8307
or 954-785-1121.
|
|
|

