You are not logged in.
This means you
CAN ONLY VIEW reports that were published prior to Monday, April 14, 2025.
You
MUST UPGRADE YOUR MEMBERSHIP if you want to see any current reports.
AFTER MARKET UPDATE - WEDNESDAY, AUGUST 21ST, 2013
Previous After Market Report Next After Market Report >>>
|
|
|
|
DOW |
-105.44 |
14,897.55 |
-0.70% |
|
Volume |
657,455,890 |
+4% |
|
Volume |
1,394,562,080 |
+12% |
|
NASDAQ |
-13.80 |
3,599.79 |
-0.38% |
|
Advancers |
839 |
27% |
|
Advancers |
811 |
31% |
|
S&P 500 |
-9.55 |
1,642.80 |
-0.58% |
|
Decliners |
2,211 |
71% |
|
Decliners |
1,696 |
65% |
|
Russell 2000 |
-6.99 |
1,021.58 |
-0.68% |
|
52 Wk Highs |
29 |
|
|
52 Wk Highs |
56 |
|
|
S&P 600 |
-3.87 |
579.71 |
-0.66% |
|
52 Wk Lows |
150 |
|
|
52 Wk Lows |
35 |
|
|
 |
Major Averages Lacking Conviction to Attempt New Rally Thus Far
Kenneth J. Gruneisen - Passed the CAN SLIM® Master's Exam
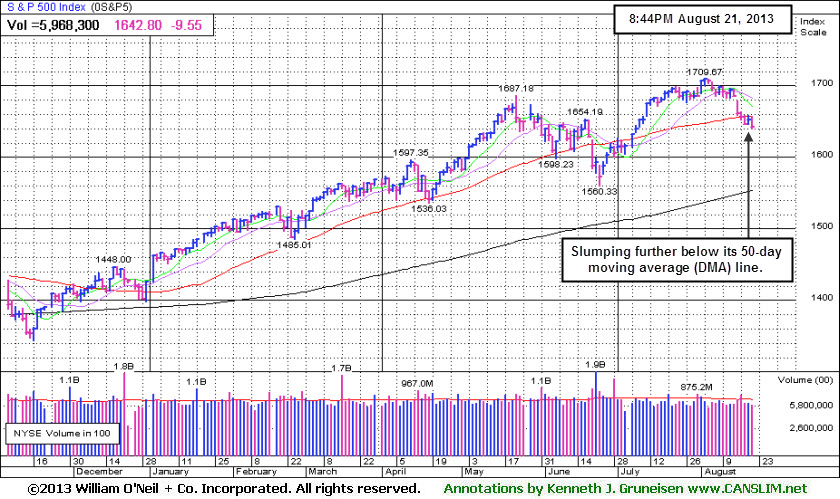
On Wednesday the major averages finished lower. The volume totals were reported higher than the prior session totals on the NYSE and on the Nasdaq exchange, an indication of more distributional pressure still coming from the institutional crowd. Breadth was negative as decliners led advancers by nearly a 3-1 margin on the NYSE and by a 2-1 margin on the Nasdaq exchange. There were 13 high-ranked companies from the CANSLIM.net Leaders List that made new 52-week highs and appeared on the CANSLIM.net BreakOuts Page, up from a total of 10 stocks on the prior session. The list of stocks hitting new 52-week lows outnumbered new 52-week highs on the NYSE while new highs outnumbered new lows on the Nasdaq exchange. There were gains for 10 of the 17 high-ranked companies currently included on the Featured Stocks Page. The market (M criteria) clearly signaled that the major averages are in a "correction" based on recent technical damage. Individual holdings should be closely monitored for any worrisome technical sell signals. This is precisely how the fact-based system helps investors avoid serious setbacks and raise cash levels during market downdrafts. Historic studies suggest that no new buying efforts should be made during market corrections.
Stocks finished near their worst levels of the day after a late session rally failed to take hold. Volatility on the exchanges accelerated as the FOMC minutes showed a growing consensus for the Fed to begin reducing the level of bond purchases later in the year. Additionally, the committee discussed potential measures to provide greater control of short-term interest rates. On the economic front, existing home sales in July exceeded estimates, rising to a 3-year high.
All 10 sectors on the S&P finished lower, led by declines in utility stocks. Shares of Duke Energy Corp (DUK -1.47%) to $65.81. On the earnings front, Target Corp (TGT -3.61%) fell after falling short of analysts' estimates on revenues. On the upside, home improvement retailer Lowe’s Companies Inc (LOW +3.92%) rose following their better-than-expected profit tally.
Turning to fixed income markets, Treasuries were lower along the curve. The benchmark 10-year note was down over 1/2 a point to yield 2.89% and the 30-year bond was off over a full point to yield 3.92%.
Stay familiar with companies listed on the CANSLIM.net Featured Stocks Page - a page showing the most action-worthy candidates' latest notes and links to additional resources including detailed analysis with data-packed graphs which are annotated by a Certified expert. The Premium Member Homepage - includes "dynamic archives" to all prior pay reports published. Watch for an announcement via email concerning the next WEBCAST.
PICTURED: The S&P 500 Index fell 9 points to 1,642, slumping below its 50-day moving average (DMA) line.
|
 Kenneth J. Gruneisen started out as a licensed stockbroker in August 1987, a couple of months prior to the historic stock market crash that took the Dow Jones Industrial Average down -22.6% in a single day. He has published daily fact-based fundamental and technical analysis on high-ranked stocks online for two decades. Through FACTBASEDINVESTING.COM, Kenneth provides educational articles, news, market commentary, and other information regarding proven investment systems that work in good times and bad.
Comments contained in the body of this report are technical opinions only and are not necessarily those of Gruneisen Growth Corp. The material herein has been obtained from sources believed to be reliable and accurate, however, its accuracy and completeness cannot be guaranteed. Our firm, employees, and customers may effect transactions, including transactions contrary to any recommendation herein, or have positions in the securities mentioned herein or options with respect thereto. Any recommendation contained in this report may not be suitable for all investors and it is not to be deemed an offer or solicitation on our part with respect to the purchase or sale of any securities. |
|
 |
Biotech Index Bucks Broader Market Weakness
Kenneth J. Gruneisen - Passed the CAN SLIM® Master's Exam
The Retail Index ($RLX -0.83%) outpaced the influential financial indexes to the downside as the Broker/Dealer Index ($XBD -0.72%) and Bank Index ($BKX -0.67%) created a drag on the major averages. The Networking Index ($NWX -1.32%) led the tech sector lower while the Semiconductor Index ($SOX -0.71%) and the Internet Index ($IIX -0.73%) suffered modest losses. Energy-related shares had a negative bias as the Oil Services Index ($OSX -0.88%) and Integrated Oil Index ($XOI -0.51%) edged lower. The Healthcare Index ($HMO -0.83%) also sputtered lower. The Gold & Silver Index ($XAU -4.04%) was a standout decliner.
Charts courtesy www.stockcharts.com
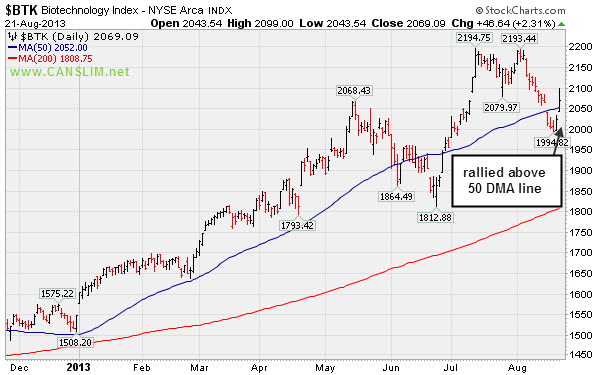
PICTURED: The Biotechnology Index ($BTK +2.31%) bucked the mostly negative action in the broader market and posted a solid gain.
| Oil Services |
$OSX |
255.92 |
-2.28 |
-0.88% |
+16.24% |
| Healthcare |
$HMO |
3,343.98 |
-28.10 |
-0.83% |
+33.00% |
| Integrated Oil |
$XOI |
1,343.06 |
-6.92 |
-0.51% |
+8.15% |
| Semiconductor |
$SOX |
458.53 |
-3.30 |
-0.71% |
+19.39% |
| Networking |
$NWX |
282.89 |
-3.77 |
-1.32% |
+24.87% |
| Internet |
$IIX |
396.34 |
-2.91 |
-0.73% |
+21.21% |
| Broker/Dealer |
$XBD |
132.57 |
-0.96 |
-0.72% |
+40.54% |
| Retail |
$RLX |
814.54 |
-6.82 |
-0.83% |
+24.73% |
| Gold & Silver |
$XAU |
106.44 |
-4.48 |
-4.04% |
-35.72% |
| Bank |
$BKX |
64.07 |
-0.43 |
-0.67% |
+24.94% |
| Biotech |
$BTK |
2,069.09 |
+46.64 |
+2.31% |
+33.75% |
|
|
|
 |
Consolidating Above Prior Highs and 50-Day Moving Average
Kenneth J. Gruneisen - Passed the CAN SLIM® Master's Exam
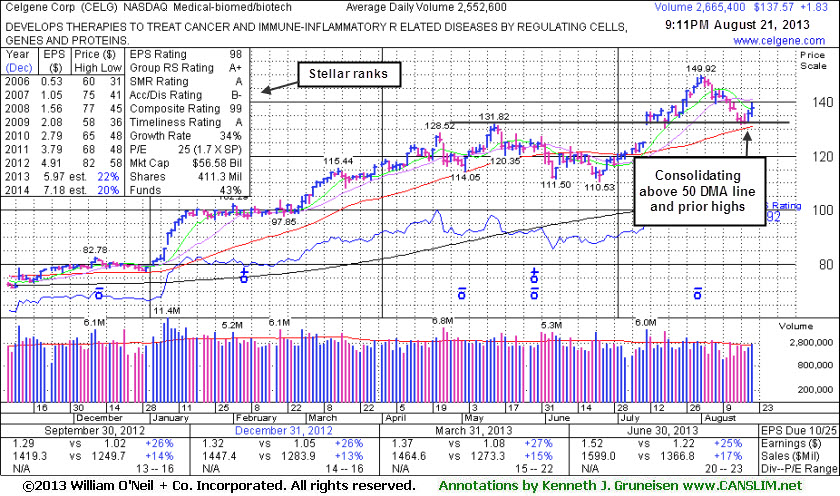
Celgene Corp (CELG +$1.83 or +1.35% to $137.57) is consolidating above prior highs in the $131 area coinciding with its 50-day moving average (DMA) line, an important chart support level. Keep in mind that the broader market direction (M criteria) weighs heavily into the mix as historic studies showed that 3 out of 4 stocks typically move in the same direction of the major averages. For as long as the current market correction continues, odds are not favorable for most stocks making meaningful headway.
Pay close attention to stocks that hold up well during corrections and watch for those that are the first ones breaking into new high ground upon any new confirmed rally. Meanwhile, if holding onto current gains, investors should stand ready to reduce exposure before too much damage starts to mount. Disciplined investors always limit losses by selling any stock that falls more than -7% from their purchase price, but sometimes weak technical action may hint that it is a smart time to sell even before losses reach that important maximum loss threshold.
CELG was last shown in this FSU section on 7/29/13 with an annotated graph under the headline, "Extended from Prior Base Following Volume-Driven Gains". CELG reported earnings +25% on +17% sales revenues for the Jun '13 quarter versus the year ago period, maintaining its strong earnings history (C and A criteria). The stock's Accumulation/ Distribution Rating is a B- and it has earned high ranks. The number of top-rated funds owning its shares rose from 1,623 in Dec '11 to 1,963 in Jun '13, a reassuring trend concerning the I criteria. However, the company is already well-known by the institutional crowd, and that means that very few are likely to just be discovering it.
|
|
|
Color Codes Explained :
Y - Better candidates highlighted by our
staff of experts.
G - Previously featured
in past reports as yellow but may no longer be buyable under the
guidelines.
***Last / Change / Volume data in this table is the closing quote data***
Symbol/Exchange
Company Name
Industry Group |
PRICE |
CHANGE
(%Change) |
Day High |
Volume
(% DAV)
(% 50 day avg vol) |
52 Wk Hi
% From Hi |
Featured
Date |
Price
Featured |
Pivot Featured |
|
Max Buy |
AMBA
-
NASDAQ
Ambarella Inc
ELECTRONICS - Semiconductor - Specialized
|
$15.11
|
-1.01
-6.27% |
$16.12
|
1,435,350
142.64% of 50 DAV
50 DAV is 1,006,300
|
$19.44
-22.27%
|
7/15/2013
|
$17.87
|
PP = $18.68
|
|
MB = $19.61
|
 Most Recent Note - 8/21/2013 9:15:08 PM
Down today with above average volume, finishing near the session low after violating prior lows near $15.50 and triggering more worrisome technical sell signals. It will be dropped from the Featured Stocks list tonight.
>>> The latest Featured Stock Update with an annotated graph appeared on 8/13/2013. Click here.
View all notes |
Alert me of new notes |
CANSLIM.net Company Profile |
SEC |
Zacks Reports |
StockTalk |
News |
Chart |
Request a new note
C
A N
S L
I M


|
BITA
-
NYSE
Bitauto Hldgs Ltd Ads
INTERNET - Internet Information Providers
|
$14.29
|
-0.31
-2.12% |
$14.79
|
171,706
86.55% of 50 DAV
50 DAV is 198,400
|
$18.10
-21.05%
|
8/7/2013
|
$12.01
|
PP = $13.30
|
|
MB = $13.97
|
Most Recent Note - 8/21/2013 9:19:42 PM
G - Found prompt support near prior highs and it is now consolidating well above its 50 DMA line. Disciplined investors always limit losses if any stock falls more than -7-8% from their purchase price.
>>> The latest Featured Stock Update with an annotated graph appeared on 8/7/2013. Click here.
View all notes |
Alert me of new notes |
CANSLIM.net Company Profile |
SEC |
Zacks Reports |
StockTalk |
News |
Chart |
Request a new note
C
A N
S L
I M
|
CELG
-
NASDAQ
Celgene Corp
DRUGS - Drug Manufacturers - Major
|
$137.57
|
+1.83
1.35% |
$139.77
|
2,670,315
104.61% of 50 DAV
50 DAV is 2,552,600
|
$149.92
-8.24%
|
7/11/2013
|
$133.25
|
PP = $131.92
|
|
MB = $138.52
|
Most Recent Note - 8/21/2013 9:42:54 PM
Y - Consolidating above prior highs in the $131 area coinciding with its 50 DMA line, defining important chart support. See the latest FSU analysis for more details and a new annotated graph.
>>> The latest Featured Stock Update with an annotated graph appeared on 8/21/2013. Click here.
View all notes |
Alert me of new notes |
CANSLIM.net Company Profile |
SEC |
Zacks Reports |
StockTalk |
News |
Chart |
Request a new note
C
A N
S L
I M
|
FLT
-
NYSE
Fleetcor Technologies
DIVERSIFIED SERVICES - Business/Management Services
|
$96.96
|
-0.84
-0.86% |
$98.18
|
689,071
103.98% of 50 DAV
50 DAV is 662,700
|
$100.87
-3.88%
|
8/19/2013
|
$99.01
|
PP = $100.97
|
|
MB = $106.02
|
Most Recent Note - 8/19/2013 12:13:29 PM
Y- Holding its ground in a tight range, it has formed an advanced "3-weeks tight" base, albeit a riskier "late stage" base. New pivot point is cited and its color code is changed to yellow. Keep in mind the M criteria argues against new buying efforts until a new confirmed rally.
>>> The latest Featured Stock Update with an annotated graph appeared on 8/12/2013. Click here.
View all notes |
Alert me of new notes |
CANSLIM.net Company Profile |
SEC |
Zacks Reports |
StockTalk |
News |
Chart |
Request a new note
C
A N
S L
I M
|
GNRC
-
NYSE
Generac Hldgs Inc
CONSUMER DURABLES - Electronic Equipment
|
$41.71
|
-0.57
-1.35% |
$42.45
|
685,362
63.90% of 50 DAV
50 DAV is 1,072,600
|
$44.30
-5.85%
|
7/30/2013
|
$42.60
|
PP = $42.10
|
|
MB = $44.21
|
Most Recent Note - 8/15/2013 7:17:46 PM
Y - Holding its ground stubbornly after it recently rallied from an advanced "3-weeks tight" base and priced a Secondary Offering. Disciplined investors always limit losses by selling if any stock falls more than -7% from its purchase price.
>>> The latest Featured Stock Update with an annotated graph appeared on 7/30/2013. Click here.
View all notes |
Alert me of new notes |
CANSLIM.net Company Profile |
SEC |
Zacks Reports |
StockTalk |
News |
Chart |
Request a new note
C
A N
S L
I M
|
Symbol/Exchange
Company Name
Industry Group |
PRICE |
CHANGE
(%Change) |
Day High |
Volume
(% DAV)
(% 50 day avg vol) |
52 Wk Hi
% From Hi |
Featured
Date |
Price
Featured |
Pivot Featured |
|
Max Buy |
KORS
-
NYSE
Michael Kors Hldgs Ltd
RETAIL - Apparel Stores
|
$71.65
|
+0.39
0.55% |
$72.38
|
2,396,087
67.88% of 50 DAV
50 DAV is 3,529,800
|
$72.98
-1.82%
|
8/6/2013
|
$69.66
|
PP = $66.28
|
|
MB = $69.59
|
Most Recent Note - 8/15/2013 7:19:05 PM
G - Holding its ground beyond its "max buy" level. Prior highs in the $66 area define initial support to watch on pullbacks.
>>> The latest Featured Stock Update with an annotated graph appeared on 8/6/2013. Click here.
View all notes |
Alert me of new notes |
CANSLIM.net Company Profile |
SEC |
Zacks Reports |
StockTalk |
News |
Chart |
Request a new note
C
A N
S L
I M
|
LOPE
-
NASDAQ
Grand Canyon Education
DIVERSIFIED SERVICES - Education and; Training Services
|
$33.29
|
-0.03
-0.09% |
$33.59
|
176,226
39.40% of 50 DAV
50 DAV is 447,300
|
$37.17
-10.44%
|
6/19/2013
|
$31.47
|
PP = $34.17
|
|
MB = $35.88
|
Most Recent Note - 8/21/2013 9:47:50 PM
G - Color code is changed to green as it has slumped below its 50 DMA line. Recently reported earnings +15% on +19% sales for the Jun '13 quarter, below the +25% minimum earnings guideline (C criteria), raising fundamental concerns.
>>> The latest Featured Stock Update with an annotated graph appeared on 8/14/2013. Click here.
View all notes |
Alert me of new notes |
CANSLIM.net Company Profile |
SEC |
Zacks Reports |
StockTalk |
News |
Chart |
Request a new note
C
A N
S L
I M
|
PCLN
-
NASDAQ
Priceline.Com Inc
INTERNET - Internet Software and Services
|
$940.20
|
+7.43
0.80% |
$951.00
|
537,210
75.63% of 50 DAV
50 DAV is 710,300
|
$994.98
-5.51%
|
7/8/2013
|
$878.28
|
PP = $847.43
|
|
MB = $889.80
|
Most Recent Note - 8/16/2013 6:57:21 PM
G - Consolidating above prior highs, extended from any sound base. Reported earnings +24% on +27% sales revenues for the Jun '13 quarter, just under the +25% minimum earnings guideline (C criteria).
>>> The latest Featured Stock Update with an annotated graph appeared on 8/19/2013. Click here.
View all notes |
Alert me of new notes |
CANSLIM.net Company Profile |
SEC |
Zacks Reports |
StockTalk |
News |
Chart |
Request a new note
C
A N
S L
I M
|
PRAA
-
NASDAQ
Portfolio Recovery Assoc
DIVERSIFIED SERVICES - Business/Management Services
|
$54.48
|
-0.93
-1.68% |
$55.20
|
292,925
56.42% of 50 DAV
50 DAV is 519,200
|
$57.57
-5.37%
|
7/31/2013
|
$51.43
|
PP = $54.72
|
|
MB = $57.46
|
Most Recent Note - 8/21/2013 9:53:49 PM
Y - Holding its ground near prior highs with volume totals cooling in recent weeks. Any slump below its old high close ($53.86 on 6/17/13) would raise greater concerns as it would completely negate the recent technical breakout.
>>> The latest Featured Stock Update with an annotated graph appeared on 8/2/2013. Click here.
View all notes |
Alert me of new notes |
CANSLIM.net Company Profile |
SEC |
Zacks Reports |
StockTalk |
News |
Chart |
Request a new note
C
A N
S L
I M
|
PRLB
-
NYSE
Proto Labs Inc
MANUFACTURING - Small Tools and Accessories
|
$70.01
|
+1.51
2.20% |
$71.10
|
497,401
100.83% of 50 DAV
50 DAV is 493,300
|
$72.08
-2.87%
|
7/29/2013
|
$64.86
|
PP = $67.50
|
|
MB = $70.88
|
Most Recent Note - 8/19/2013 12:09:12 PM
Y - Recently consolidating above its 50 DMA line with volume totals cooling in recent weeks. That important short-term average and prior lows define important support to watch. Disciplined investors always limit losses if any stock falls more than -7% from their purchase price.
>>> The latest Featured Stock Update with an annotated graph appeared on 8/5/2013. Click here.
View all notes |
Alert me of new notes |
CANSLIM.net Company Profile |
SEC |
Zacks Reports |
StockTalk |
News |
Chart |
Request a new note
C
A N
S L
I M
|
Symbol/Exchange
Company Name
Industry Group |
PRICE |
CHANGE
(%Change) |
Day High |
Volume
(% DAV)
(% 50 day avg vol) |
52 Wk Hi
% From Hi |
Featured
Date |
Price
Featured |
Pivot Featured |
|
Max Buy |
QCOR
-
NASDAQ
Questcor Pharmaceuticals
DRUGS - Biotechnology
|
$67.83
|
+2.88
4.43% |
$68.89
|
1,789,870
85.33% of 50 DAV
50 DAV is 2,097,500
|
$70.55
-3.86%
|
7/31/2013
|
$66.46
|
PP = $59.01
|
|
MB = $61.96
|
Most Recent Note - 8/21/2013 9:11:57 PM
G - Gapped up today for a solid gain, bucking a mostly negative market. It is extended beyond its "max buy" level, consolidating in a tight trading range for the past 3 weeks.
>>> The latest Featured Stock Update with an annotated graph appeared on 8/1/2013. Click here.
View all notes |
Alert me of new notes |
CANSLIM.net Company Profile |
SEC |
Zacks Reports |
StockTalk |
News |
Chart |
Request a new note
C
A N
S L
I M
|
SFUN
-
NYSE
Soufun Hldgs Ltd Ads A
INTERNET - Internet Information Providers
|
$40.67
|
+0.59
1.47% |
$41.31
|
481,402
97.27% of 50 DAV
50 DAV is 494,900
|
$42.15
-3.51%
|
7/16/2013
|
$29.54
|
PP = $27.90
|
|
MB = $29.30
|
Most Recent Note - 8/19/2013 12:00:36 PM
G - Rallying near its 52-week high hit last week with today's considerable volume-driven gain. Very extended from its latest base, and prior reports noted - "Disciplined investors avoid chasing stocks too extended from sound bases."
>>> The latest Featured Stock Update with an annotated graph appeared on 8/8/2013. Click here.
View all notes |
Alert me of new notes |
CANSLIM.net Company Profile |
SEC |
Zacks Reports |
StockTalk |
News |
Chart |
Request a new note
C
A N
S L
I M
|
SSNC
-
NASDAQ
S S & C Technologies
COMPUTER SOFTWARE and SERVICES - Application Software
|
$35.35
|
-0.08
-0.23% |
$35.74
|
160,237
37.98% of 50 DAV
50 DAV is 421,900
|
$38.80
-8.89%
|
7/11/2013
|
$35.80
|
PP = $34.54
|
|
MB = $36.27
|
Most Recent Note - 8/16/2013 6:58:24 PM
Y - Still trading above its 50 DMA line and prior highs in the $34 area defining important support. Disciplined investors always limit losses if ever any stock falls more than -7% from their purchase price.
>>> The latest Featured Stock Update with an annotated graph appeared on 8/9/2013. Click here.
View all notes |
Alert me of new notes |
CANSLIM.net Company Profile |
SEC |
Zacks Reports |
StockTalk |
News |
Chart |
Request a new note
C
A N
S L
I M
|
SSYS
-
NASDAQ
Stratasys Ltd
COMPUTER HARDWARE - Computer Peripherals
|
$104.51
|
-0.61
-0.58% |
$105.16
|
507,313
61.16% of 50 DAV
50 DAV is 829,500
|
$104.34
0.16%
|
7/8/2013
|
$91.44
|
PP = $95.00
|
|
MB = $99.75
|
Most Recent Note - 8/19/2013 12:02:45 PM
G - Considerable gain today for a new 52-week high, rallying above its "max buy" level again, and its color code is changed to green
>>> The latest Featured Stock Update with an annotated graph appeared on 8/16/2013. Click here.
View all notes |
Alert me of new notes |
CANSLIM.net Company Profile |
SEC |
Zacks Reports |
StockTalk |
News |
Chart |
Request a new note
C
A N
S L
I M
|
STMP
-
NASDAQ
Stamps.Com Inc
INTERNET - Internet Software and Services
|
$41.02
|
+0.22
0.54% |
$41.39
|
57,509
43.05% of 50 DAV
50 DAV is 133,600
|
$46.47
-11.73%
|
7/31/2013
|
$40.00
|
PP = $42.98
|
|
MB = $45.13
|
Most Recent Note - 8/21/2013 9:46:11 PM
Y - Recently found support at its 50 DMA line. Disciplined investors always limit losses if any stock falls more than -7% from their purchase price. Any stock which is sold can be bought again later if strength returns.
>>> The latest Featured Stock Update with an annotated graph appeared on 7/31/2013. Click here.
View all notes |
Alert me of new notes |
CANSLIM.net Company Profile |
SEC |
Zacks Reports |
StockTalk |
News |
Chart |
Request a new note
C
A N
S L
I M
|
Symbol/Exchange
Company Name
Industry Group |
PRICE |
CHANGE
(%Change) |
Day High |
Volume
(% DAV)
(% 50 day avg vol) |
52 Wk Hi
% From Hi |
Featured
Date |
Price
Featured |
Pivot Featured |
|
Max Buy |
VRX
-
NYSE
Valeant Pharmaceuticals
DRUGS - Drug Manufacturers - Other
|
$99.77
|
-1.76
-1.73% |
$101.61
|
1,526,411
95.41% of 50 DAV
50 DAV is 1,599,900
|
$105.40
-5.34%
|
4/30/2013
|
$60.24
|
PP = $76.66
|
|
MB = $80.49
|
Most Recent Note - 8/15/2013 7:10:07 PM
G- Holding its ground after rallying into new 52-week high territory with 9 gains in the span of 10 sessions. Reported earnings +33% on +34% sales revenues for the Jun '13 quarter, above the +25% minimum earnings guideline (C criteria). See the latest FSU analysis for more details and a new annotated graph.
>>> The latest Featured Stock Update with an annotated graph appeared on 8/15/2013. Click here.
View all notes |
Alert me of new notes |
CANSLIM.net Company Profile |
SEC |
Zacks Reports |
StockTalk |
News |
Chart |
Request a new note
C
A N
S L
I M
|
YNDX
-
NASDAQ
Yandex N V Class A
INTERNET - Internet Information Providers
|
$32.73
|
-0.04
-0.12% |
$33.43
|
1,018,392
40.46% of 50 DAV
50 DAV is 2,517,100
|
$34.79
-5.92%
|
7/10/2013
|
$29.29
|
PP = $29.59
|
|
MB = $31.07
|
Most Recent Note - 8/19/2013 12:15:13 PM
G - Retreating from its 52-week high hit last week. Its 50 DMA line coincides with prior highs in the $29 area defining important near-term support to watch.
>>> The latest Featured Stock Update with an annotated graph appeared on 8/20/2013. Click here.
View all notes |
Alert me of new notes |
CANSLIM.net Company Profile |
SEC |
Zacks Reports |
StockTalk |
News |
Chart |
Request a new note
C
A N
S L
I M
|
|
|
|
THESE ARE NOT BUY RECOMMENDATIONS!
Comments contained in the body of this report are technical
opinions only. The material herein has been obtained
from sources believed to be reliable and accurate, however,
its accuracy and completeness cannot be guaranteed.
This site is not an investment advisor, hence it does
not endorse or recommend any securities or other investments.
Any recommendation contained in this report may not
be suitable for all investors and it is not to be deemed
an offer or solicitation on our part with respect to
the purchase or sale of any securities. All trademarks,
service marks and trade names appearing in this report
are the property of their respective owners, and are
likewise used for identification purposes only.
This report is a service available
only to active Paid Premium Members.
You may opt-out of receiving report notifications
at any time. Questions or comments may be submitted
by writing to Premium Membership Services 665 S.E. 10 Street, Suite 201 Deerfield Beach, FL 33441-5634 or by calling 1-800-965-8307
or 954-785-1121.
|
|
|

