***Last / Change / Volume data in this table is the closing quote data***
Symbol/Exchange
Company Name
Industry Group |
PRICE |
CHANGE
(%Change) |
Day High |
Volume
(% DAV)
(% 50 day avg vol) |
52 Wk Hi
% From Hi |
Featured
Date |
Price
Featured |
Pivot Featured |
|
Max Buy |
AMBA
-
NASDAQ
Ambarella Inc
ELECTRONICS - Semiconductor - Specialized
|
$16.12
|
+0.54
3.47% |
$16.22
|
588,035
57.12% of 50 DAV
50 DAV is 1,029,400
|
$19.44
-17.08%
|
7/15/2013
|
$17.87
|
PP = $18.68
|
|
MB = $19.61
|
Most Recent Note - 8/15/2013 7:14:10 PM
G - Slumping further below its 50 DMA line which acted as resistance recently. Subsequent damaging losses below recent lows near $15.50 would raise more serious concerns and trigger more worrisome technical sell signals.
>>> The latest Featured Stock Update with an annotated graph appeared on 8/13/2013. Click here.
View all notes |
Alert me of new notes |
CANSLIM.net Company Profile |
SEC |
Zacks Reports |
StockTalk |
News |
Chart |
Request a new note
C
A N
S L
I M


|
BITA
-
NYSE
Bitauto Hldgs Ltd Ads
INTERNET - Internet Information Providers
|
$14.60
|
+0.24
1.67% |
$14.78
|
302,939
155.11% of 50 DAV
50 DAV is 195,300
|
$18.10
-19.34%
|
8/7/2013
|
$12.01
|
PP = $13.30
|
|
MB = $13.97
|
Most Recent Note - 8/19/2013 12:06:37 PM
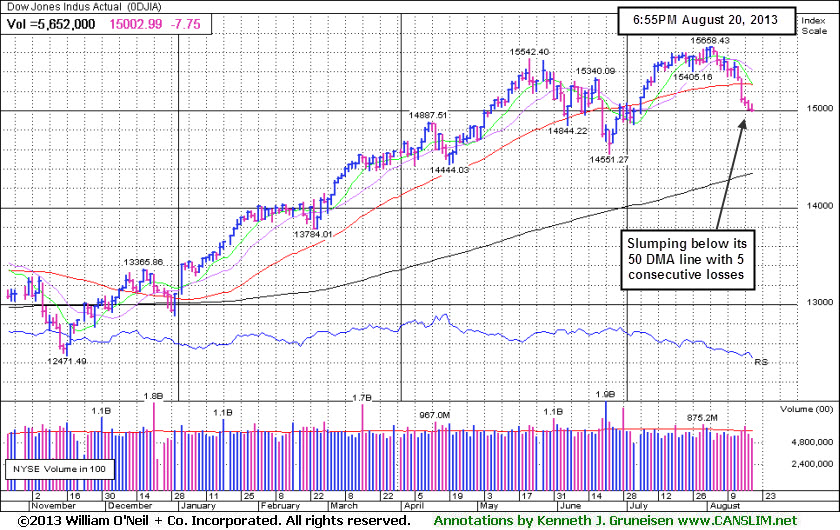
G - Gapped up today, finding prompt support near prior highs and rebounding toward its recent high closes following 5 consecutive losses marked by above average volume. Disciplined investors always limit losses if any stock falls more than -7-8% from their purchase price.
>>> The latest Featured Stock Update with an annotated graph appeared on 8/7/2013. Click here.
View all notes |
Alert me of new notes |
CANSLIM.net Company Profile |
SEC |
Zacks Reports |
StockTalk |
News |
Chart |
Request a new note
C
A N
S L
I M
|
CELG
-
NASDAQ
Celgene Corp
DRUGS - Drug Manufacturers - Major
|
$135.74
|
+3.30
2.49% |
$136.85
|
2,176,829
85.14% of 50 DAV
50 DAV is 2,556,900
|
$149.92
-9.46%
|
7/11/2013
|
$133.25
|
PP = $131.92
|
|
MB = $138.52
|
Most Recent Note - 8/13/2013 6:43:38 PM
Y - Color code is changed to yellow after retreating below its "max buy" level with a loss today on average volume. Prior highs in the $131 area define initial chart support above its 50 DMA line.
>>> The latest Featured Stock Update with an annotated graph appeared on 7/29/2013. Click here.
View all notes |
Alert me of new notes |
CANSLIM.net Company Profile |
SEC |
Zacks Reports |
StockTalk |
News |
Chart |
Request a new note
C
A N
S L
I M
|
FLT
-
NYSE
Fleetcor Technologies
DIVERSIFIED SERVICES - Business/Management Services
|
$97.80
|
+0.29
0.30% |
$98.40
|
388,325
58.10% of 50 DAV
50 DAV is 668,400
|
$100.87
-3.04%
|
8/19/2013
|
$99.01
|
PP = $100.97
|
|
MB = $106.02
|
Most Recent Note - 8/19/2013 12:13:29 PM
Y- Holding its ground in a tight range, it has formed an advanced "3-weeks tight" base, albeit a riskier "late stage" base. New pivot point is cited and its color code is changed to yellow. Keep in mind the M criteria argues against new buying efforts until a new confirmed rally.
>>> The latest Featured Stock Update with an annotated graph appeared on 8/12/2013. Click here.
View all notes |
Alert me of new notes |
CANSLIM.net Company Profile |
SEC |
Zacks Reports |
StockTalk |
News |
Chart |
Request a new note
C
A N
S L
I M
|
GNRC
-
NYSE
Generac Hldgs Inc
CONSUMER DURABLES - Electronic Equipment
|
$42.28
|
-0.02
-0.05% |
$42.70
|
719,948
66.10% of 50 DAV
50 DAV is 1,089,100
|
$44.30
-4.56%
|
7/30/2013
|
$42.60
|
PP = $42.10
|
|
MB = $44.21
|
Most Recent Note - 8/15/2013 7:17:46 PM
Y - Holding its ground stubbornly after it recently rallied from an advanced "3-weeks tight" base and priced a Secondary Offering. Disciplined investors always limit losses by selling if any stock falls more than -7% from its purchase price.
>>> The latest Featured Stock Update with an annotated graph appeared on 7/30/2013. Click here.
View all notes |
Alert me of new notes |
CANSLIM.net Company Profile |
SEC |
Zacks Reports |
StockTalk |
News |
Chart |
Request a new note
C
A N
S L
I M
|
Symbol/Exchange
Company Name
Industry Group |
PRICE |
CHANGE
(%Change) |
Day High |
Volume
(% DAV)
(% 50 day avg vol) |
52 Wk Hi
% From Hi |
Featured
Date |
Price
Featured |
Pivot Featured |
|
Max Buy |
KORS
-
NYSE
Michael Kors Hldgs Ltd
RETAIL - Apparel Stores
|
$71.26
|
+1.50
2.15% |
$72.01
|
2,217,020
62.69% of 50 DAV
50 DAV is 3,536,700
|
$72.98
-2.36%
|
8/6/2013
|
$69.66
|
PP = $66.28
|
|
MB = $69.59
|
Most Recent Note - 8/15/2013 7:19:05 PM
G - Holding its ground beyond its "max buy" level. Prior highs in the $66 area define initial support to watch on pullbacks.
>>> The latest Featured Stock Update with an annotated graph appeared on 8/6/2013. Click here.
View all notes |
Alert me of new notes |
CANSLIM.net Company Profile |
SEC |
Zacks Reports |
StockTalk |
News |
Chart |
Request a new note
C
A N
S L
I M
|
LOPE
-
NASDAQ
Grand Canyon Education
DIVERSIFIED SERVICES - Education and; Training Services
|
$33.32
|
+0.57
1.74% |
$33.49
|
335,556
75.05% of 50 DAV
50 DAV is 447,100
|
$37.17
-10.36%
|
6/19/2013
|
$31.47
|
PP = $34.17
|
|
MB = $35.88
|
Most Recent Note - 8/14/2013 7:11:26 PM
Y - Consolidating above important near-term support. Reported earnings +15% on +19% sales for the Jun '13 quarter, below the +25% minimum earnings guideline (C criteria), raising fundamental concerns. See the latest FSU analysis for more details and a new annotated graph.
>>> The latest Featured Stock Update with an annotated graph appeared on 8/14/2013. Click here.
View all notes |
Alert me of new notes |
CANSLIM.net Company Profile |
SEC |
Zacks Reports |
StockTalk |
News |
Chart |
Request a new note
C
A N
S L
I M
|
PCLN
-
NASDAQ
Priceline.Com Inc
INTERNET - Internet Software and Services
|
$932.77
|
-0.36
-0.04% |
$942.15
|
346,314
48.51% of 50 DAV
50 DAV is 713,900
|
$994.98
-6.25%
|
7/8/2013
|
$878.28
|
PP = $847.43
|
|
MB = $889.80
|
Most Recent Note - 8/16/2013 6:57:21 PM
G - Consolidating above prior highs, extended from any sound base. Reported earnings +24% on +27% sales revenues for the Jun '13 quarter, just under the +25% minimum earnings guideline (C criteria).
>>> The latest Featured Stock Update with an annotated graph appeared on 8/19/2013. Click here.
View all notes |
Alert me of new notes |
CANSLIM.net Company Profile |
SEC |
Zacks Reports |
StockTalk |
News |
Chart |
Request a new note
C
A N
S L
I M
|
PRAA
-
NASDAQ
Portfolio Recovery Assoc
DIVERSIFIED SERVICES - Business/Management Services
|
$55.41
|
+0.23
0.42% |
$55.73
|
377,848
73.16% of 50 DAV
50 DAV is 516,500
|
$57.57
-3.75%
|
7/31/2013
|
$51.43
|
PP = $54.72
|
|
MB = $57.46
|
Most Recent Note - 8/14/2013 1:09:23 PM
Y - Perched at its 52-week high today holding its ground following an impressive spurt of volume-driven gains. It rallied above the pivot point with +130% above average volume on the prior session clinching a new technical buy signal.
>>> The latest Featured Stock Update with an annotated graph appeared on 8/2/2013. Click here.
View all notes |
Alert me of new notes |
CANSLIM.net Company Profile |
SEC |
Zacks Reports |
StockTalk |
News |
Chart |
Request a new note
C
A N
S L
I M
|
PRLB
-
NYSE
Proto Labs Inc
MANUFACTURING - Small Tools and Accessories
|
$68.50
|
+1.95
2.93% |
$68.70
|
338,030
68.52% of 50 DAV
50 DAV is 493,300
|
$72.08
-4.97%
|
7/29/2013
|
$64.86
|
PP = $67.50
|
|
MB = $70.88
|
Most Recent Note - 8/19/2013 12:09:12 PM
Y - Recently consolidating above its 50 DMA line with volume totals cooling in recent weeks. That important short-term average and prior lows define important support to watch. Disciplined investors always limit losses if any stock falls more than -7% from their purchase price.
>>> The latest Featured Stock Update with an annotated graph appeared on 8/5/2013. Click here.
View all notes |
Alert me of new notes |
CANSLIM.net Company Profile |
SEC |
Zacks Reports |
StockTalk |
News |
Chart |
Request a new note
C
A N
S L
I M
|
Symbol/Exchange
Company Name
Industry Group |
PRICE |
CHANGE
(%Change) |
Day High |
Volume
(% DAV)
(% 50 day avg vol) |
52 Wk Hi
% From Hi |
Featured
Date |
Price
Featured |
Pivot Featured |
|
Max Buy |
QCOR
-
NASDAQ
Questcor Pharmaceuticals
DRUGS - Biotechnology
|
$64.95
|
-0.18
-0.28% |
$66.12
|
1,397,605
66.73% of 50 DAV
50 DAV is 2,094,400
|
$70.55
-7.94%
|
7/31/2013
|
$66.46
|
PP = $59.01
|
|
MB = $61.96
|
Most Recent Note - 8/13/2013 7:04:51 PM
G - Rallied to its second-best close today following a brief consolidation. Quickly got extended beyond its "max buy" level after highlighted in yellow in the 7/31/13 mid-day report (read here) with a weekly graph which illustrated its powerful long-term breakout to new highs.
>>> The latest Featured Stock Update with an annotated graph appeared on 8/1/2013. Click here.
View all notes |
Alert me of new notes |
CANSLIM.net Company Profile |
SEC |
Zacks Reports |
StockTalk |
News |
Chart |
Request a new note
C
A N
S L
I M
|
SFUN
-
NYSE
Soufun Hldgs Ltd Ads A
INTERNET - Internet Information Providers
|
$40.08
|
-0.18
-0.45% |
$40.66
|
389,873
78.33% of 50 DAV
50 DAV is 497,700
|
$42.15
-4.91%
|
7/16/2013
|
$29.54
|
PP = $27.90
|
|
MB = $29.30
|
Most Recent Note - 8/19/2013 12:00:36 PM
G - Rallying near its 52-week high hit last week with today's considerable volume-driven gain. Very extended from its latest base, and prior reports noted - "Disciplined investors avoid chasing stocks too extended from sound bases."
>>> The latest Featured Stock Update with an annotated graph appeared on 8/8/2013. Click here.
View all notes |
Alert me of new notes |
CANSLIM.net Company Profile |
SEC |
Zacks Reports |
StockTalk |
News |
Chart |
Request a new note
C
A N
S L
I M
|
SSNC
-
NASDAQ
S S & C Technologies
COMPUTER SOFTWARE and SERVICES - Application Software
|
$35.43
|
+0.63
1.81% |
$35.63
|
165,658
38.78% of 50 DAV
50 DAV is 427,200
|
$38.80
-8.69%
|
7/11/2013
|
$35.80
|
PP = $34.54
|
|
MB = $36.27
|
Most Recent Note - 8/16/2013 6:58:24 PM
Y - Still trading above its 50 DMA line and prior highs in the $34 area defining important support. Disciplined investors always limit losses if ever any stock falls more than -7% from their purchase price.
>>> The latest Featured Stock Update with an annotated graph appeared on 8/9/2013. Click here.
View all notes |
Alert me of new notes |
CANSLIM.net Company Profile |
SEC |
Zacks Reports |
StockTalk |
News |
Chart |
Request a new note
C
A N
S L
I M
|
SSYS
-
NASDAQ
Stratasys Ltd
COMPUTER HARDWARE - Computer Peripherals
|
$105.12
|
-0.08
-0.08% |
$106.16
|
748,665
89.51% of 50 DAV
50 DAV is 836,400
|
$104.34
0.75%
|
7/8/2013
|
$91.44
|
PP = $95.00
|
|
MB = $99.75
|
Most Recent Note - 8/19/2013 12:02:45 PM
G - Considerable gain today for a new 52-week high, rallying above its "max buy" level again, and its color code is changed to green
>>> The latest Featured Stock Update with an annotated graph appeared on 8/16/2013. Click here.
View all notes |
Alert me of new notes |
CANSLIM.net Company Profile |
SEC |
Zacks Reports |
StockTalk |
News |
Chart |
Request a new note
C
A N
S L
I M
|
STMP
-
NASDAQ
Stamps.Com Inc
INTERNET - Internet Software and Services
|
$40.80
|
+0.28
0.69% |
$40.99
|
79,001
57.79% of 50 DAV
50 DAV is 136,700
|
$46.47
-12.20%
|
7/31/2013
|
$40.00
|
PP = $42.98
|
|
MB = $45.13
|
Most Recent Note - 8/13/2013 6:53:00 PM
Y - Found support at its 50 DMA line again after a recent bout of distributional pressure. Disciplined investors always limit losses if any stock falls more than -7% from their purchase price. Any stock which is sold can be bought again later if strength returns.
>>> The latest Featured Stock Update with an annotated graph appeared on 7/31/2013. Click here.
View all notes |
Alert me of new notes |
CANSLIM.net Company Profile |
SEC |
Zacks Reports |
StockTalk |
News |
Chart |
Request a new note
C
A N
S L
I M
|
Symbol/Exchange
Company Name
Industry Group |
PRICE |
CHANGE
(%Change) |
Day High |
Volume
(% DAV)
(% 50 day avg vol) |
52 Wk Hi
% From Hi |
Featured
Date |
Price
Featured |
Pivot Featured |
|
Max Buy |
VRX
-
NYSE
Valeant Pharmaceuticals
DRUGS - Drug Manufacturers - Other
|
$101.53
|
+0.47
0.47% |
$102.45
|
801,528
49.96% of 50 DAV
50 DAV is 1,604,200
|
$105.40
-3.67%
|
4/30/2013
|
$60.24
|
PP = $76.66
|
|
MB = $80.49
|
Most Recent Note - 8/15/2013 7:10:07 PM
G- Holding its ground after rallying into new 52-week high territory with 9 gains in the span of 10 sessions. Reported earnings +33% on +34% sales revenues for the Jun '13 quarter, above the +25% minimum earnings guideline (C criteria). See the latest FSU analysis for more details and a new annotated graph.
>>> The latest Featured Stock Update with an annotated graph appeared on 8/15/2013. Click here.
View all notes |
Alert me of new notes |
CANSLIM.net Company Profile |
SEC |
Zacks Reports |
StockTalk |
News |
Chart |
Request a new note
C
A N
S L
I M
|
YNDX
-
NASDAQ
Yandex N V Class A
INTERNET - Internet Information Providers
|
$32.77
|
+0.39
1.20% |
$32.98
|
863,371
34.24% of 50 DAV
50 DAV is 2,521,700
|
$34.79
-5.81%
|
7/10/2013
|
$29.29
|
PP = $29.59
|
|
MB = $31.07
|
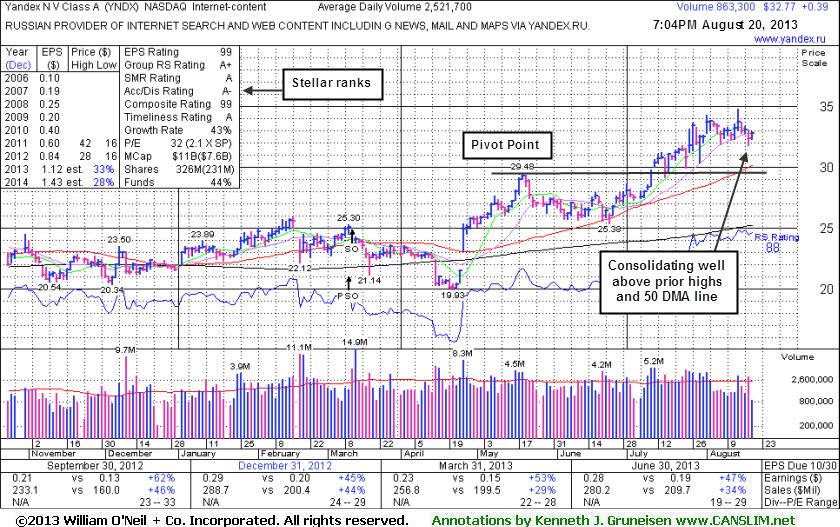
Most Recent Note - 8/19/2013 12:15:13 PM
G - Retreating from its 52-week high hit last week. Its 50 DMA line coincides with prior highs in the $29 area defining important near-term support to watch.
>>> The latest Featured Stock Update with an annotated graph appeared on 8/20/2013. Click here.
View all notes |
Alert me of new notes |
CANSLIM.net Company Profile |
SEC |
Zacks Reports |
StockTalk |
News |
Chart |
Request a new note
C
A N
S L
I M
|