You are not logged in.
This means you
CAN ONLY VIEW reports that were published prior to Monday, April 14, 2025.
You
MUST UPGRADE YOUR MEMBERSHIP if you want to see any current reports.
AFTER MARKET UPDATE - MONDAY, AUGUST 19TH, 2013
Previous After Market Report Next After Market Report >>>
|
|
|
|
DOW |
-70.73 |
15,010.74 |
-0.47% |
|
Volume |
640,281,350 |
-23% |
|
Volume |
1,387,466,080 |
-5% |
|
NASDAQ |
-13.69 |
3,589.09 |
-0.38% |
|
Advancers |
580 |
18% |
|
Advancers |
761 |
29% |
|
S&P 500 |
-9.77 |
1,646.06 |
-0.59% |
|
Decliners |
2,502 |
79% |
|
Decliners |
1,777 |
68% |
|
Russell 2000 |
-11.05 |
1,013.25 |
-1.08% |
|
52 Wk Highs |
17 |
|
|
52 Wk Highs |
46 |
|
|
S&P 600 |
-5.14 |
575.10 |
-0.89% |
|
52 Wk Lows |
469 |
|
|
52 Wk Lows |
50 |
|
|
 |
Major Averages' Slump Continues
Kenneth J. Gruneisen - Passed the CAN SLIM® Master's Exam
Monday's volume totals were reported lighter than the prior session totals on the NYSE and on the Nasdaq exchange. Breadth was negative as decliners led advancers more than a 4-1 margin on the NYSE and by a 9-4 margin on the Nasdaq exchange. There were only 6 high-ranked companies from the CANSLIM.net Leaders List that made new 52-week highs and appeared on the CANSLIM.net BreakOuts Page, down abruptly from a total of 62 stocks last Tuesday as leadership evaporated quickly. The list of stocks hitting new 52-week lows outnumbered new 52-week highs on the Nasdaq exchange and on the NYSE. There were gains for only 5 of the 17 high-ranked companies currently included on the Featured Stocks Page. The market (M criteria) clearly signaled that the major averages are in a "correction" based on Thursday's technical damage. Individual holdings should be closely monitored for any worrisome technical sell signals. This is precisely how the fact-based system helps investors avoid serious setbacks and raise cash levels during market downdrafts. Historic studies suggest that no new buying efforts should be made during market corrections.
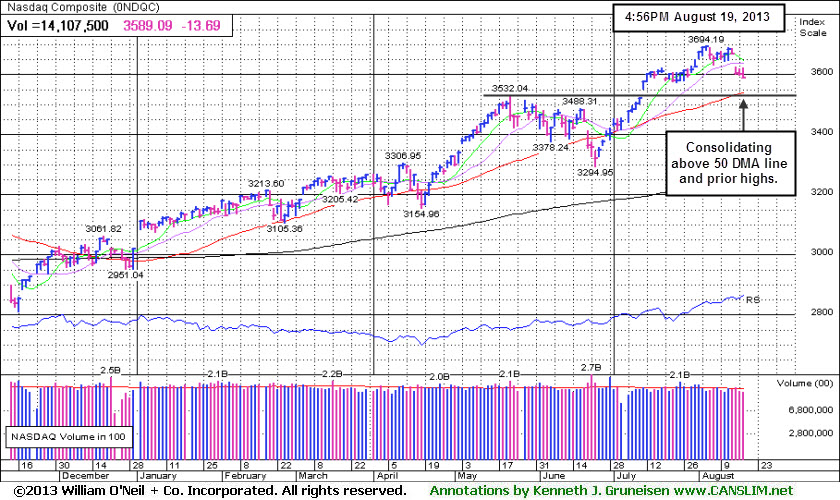
Monday's session was choppy as the indices toggled between gains and losses. Fears that the Fed may begin to taper their easing measures have investors are wary of making moves ahead of Wednesday's FOMC minutes release. The Dow and S&P 500 index are now both trading below their respective 50-day moving average (DMA) lines.
Eight of the 10 sectors on the S&P ended lower, led by a decline in energy stocks. Shares of Exxon Mobil Corp (XOM -1.13%). Also in the space, Apache Corp (APA -4.58%) after the stock received an analyst downgrade due to its exposure in Egypt. Shares of Bank of America Corp (BAC -1.87%). On the earnings front, Saks Inc (SKS -0.31%) after the retailer posted a wider-than-expected quarterly loss. Shares of Urban Outfitters (URBN +0.45%) ahead of their scheduled earnings after the close. On the M&A front, industrial tech firm Edwards Group Ltd (EVAC +18.34%) rose on news that the company was being acquired by Sweden's Atlas Copco for $10.50 per share.
Turning to fixed income markets, Treasuries were lower along the curve. The benchmark 10-year note was down 15/32 to yield 2.88% and the 30-year bond was nearly a full point to yield 3.90%.
Stay familiar with companies listed on the CANSLIM.net Featured Stocks Page - a page showing the most action-worthy candidates' latest notes and links to additional resources including detailed analysis with data-packed graphs which are annotated by a Certified expert. The Premium Member Homepage - includes "dynamic archives" to all prior pay reports published. Watch for an announcement via email concerning the next WEBCAST.
PICTURED: The Nasdaq Composite Index is consolidating above prior highs and its 50-day moving average (DMA) line.
|
 Kenneth J. Gruneisen started out as a licensed stockbroker in August 1987, a couple of months prior to the historic stock market crash that took the Dow Jones Industrial Average down -22.6% in a single day. He has published daily fact-based fundamental and technical analysis on high-ranked stocks online for two decades. Through FACTBASEDINVESTING.COM, Kenneth provides educational articles, news, market commentary, and other information regarding proven investment systems that work in good times and bad.
Comments contained in the body of this report are technical opinions only and are not necessarily those of Gruneisen Growth Corp. The material herein has been obtained from sources believed to be reliable and accurate, however, its accuracy and completeness cannot be guaranteed. Our firm, employees, and customers may effect transactions, including transactions contrary to any recommendation herein, or have positions in the securities mentioned herein or options with respect thereto. Any recommendation contained in this report may not be suitable for all investors and it is not to be deemed an offer or solicitation on our part with respect to the purchase or sale of any securities. |
|
 |
Financial, Tech, and Commodity-Linked Groups Lost Ground
Kenneth J. Gruneisen - Passed the CAN SLIM® Master's Exam
Commodity-linked groups ended lower on Monday as the Gold & Silver Index ($XAU -1.75%), Integrated Oil Index ($XOI -1.63%), and the Oil Services Index ($OSX -1.25%) lost ground. Weakness in the influential financial groups also weighed on the major averages as the Bank Index ($BKX -1.34%) and Broker/Dealer Index ($XBD -0.90%) fell. The Networking Index ($NWX -1.12%) led the tech sector lower while the Semiconductor Index ($SOX -0.69%), Internet Index ($IIX -0.61%), and Biotechnology Index ($BTK -0.51%) finished with modest losses. The Healthcare Index ($HMO -0.17%) and the Retail Index ($RLX -0.09%) edged lower, rounding out a widely negative session.
Charts courtesy www.stockcharts.com
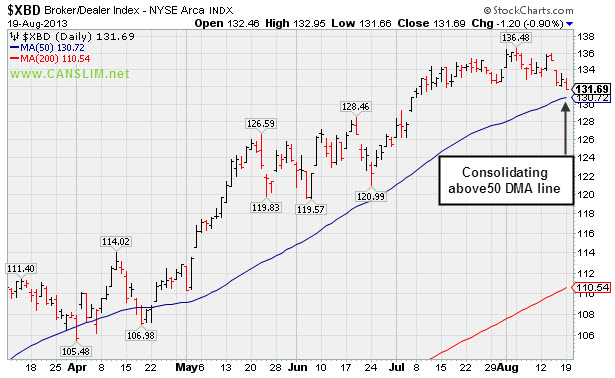
PICTURED: The Broker/Dealer Index ($XBD -0.90%) is consolidating above its 50-day moving average (DMA) line. It found prompt support on prior pullbacks near that important short-term average throughout its ongoing advance this year.
| Oil Services |
$OSX |
256.58 |
-3.26 |
-1.25% |
+16.54% |
| Healthcare |
$HMO |
3,338.35 |
-5.64 |
-0.17% |
+32.78% |
| Integrated Oil |
$XOI |
1,344.57 |
-22.25 |
-1.63% |
+8.27% |
| Semiconductor |
$SOX |
459.29 |
-3.17 |
-0.69% |
+19.59% |
| Networking |
$NWX |
286.13 |
-3.24 |
-1.12% |
+26.30% |
| Internet |
$IIX |
396.66 |
-2.42 |
-0.61% |
+21.30% |
| Broker/Dealer |
$XBD |
131.69 |
-1.20 |
-0.90% |
+39.61% |
| Retail |
$RLX |
811.60 |
-0.76 |
-0.09% |
+24.28% |
| Gold & Silver |
$XAU |
107.36 |
-1.91 |
-1.75% |
-35.17% |
| Bank |
$BKX |
63.84 |
-0.87 |
-1.34% |
+24.49% |
| Biotech |
$BTK |
1,994.82 |
-10.30 |
-0.51% |
+28.95% |
|
|
|
 |
Following Slightly Sub Par Earnings Market Slump Also Raised Concerns
Kenneth J. Gruneisen - Passed the CAN SLIM® Master's Exam
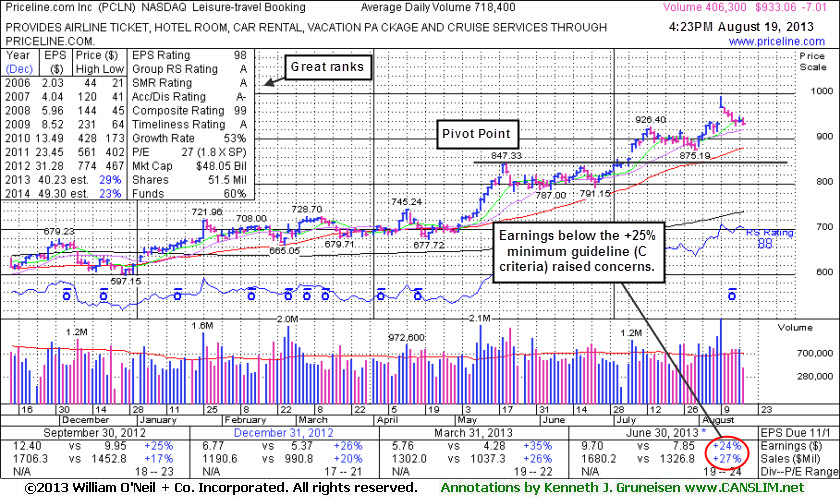
Priceline.com Inc. (PCLN -$6.94 or -0.74% to $933.13) is consolidating -6.2% off its 52-week high, trading above prior highs in the $926 area that define initial support to watch on pullbacks. Not long ago it reported earnings +24% on +27% sales revenues for the Jun '13 quarter, just under the +25% minimum earnings guideline (C criteria), raising fundamental concerns. Broader market conditions (M criteria) also have recently deteriorated, as noted in the market commentary since last Thursday,hurting the outlook for all stocks.
PCLN was last shown in the FSU section on 7/25/13 with an annotated graph under the headline, "Still Consolidating Well Above Prior Highs". The Leisure - Travel Booking firm has earned stellar ranks, despite the latest quarter's slightly sub par results. Its strong annual earnings history satisfies the A criteria.
Keep in mind, the investment system's biggest winning models were typically held by at least a few mutual funds and attracting many others. However, once a stock is very heavily owned by a long list of mutual funds, as is now the case with PCLN, investors should be especially cautious and alert for any technical sell signals or fundamental disappointments which could prompt a rush for the exits. The number of top-rated funds owning its shares rose from 1,528 in Sep '12 to 1,684 in Jun '13, and increasing interest is an encouraging sign concerning the I criteria. Its current Up/Down Volume Ratio of 1.4 is an unbiased indication its shares have been under accumulation over the past 50 days.
|
|
|
Color Codes Explained :
Y - Better candidates highlighted by our
staff of experts.
G - Previously featured
in past reports as yellow but may no longer be buyable under the
guidelines.
***Last / Change / Volume data in this table is the closing quote data***
Symbol/Exchange
Company Name
Industry Group |
PRICE |
CHANGE
(%Change) |
Day High |
Volume
(% DAV)
(% 50 day avg vol) |
52 Wk Hi
% From Hi |
Featured
Date |
Price
Featured |
Pivot Featured |
|
Max Buy |
AMBA
-
NASDAQ
Ambarella Inc
ELECTRONICS - Semiconductor - Specialized
|
$15.58
|
-0.43
-2.69% |
$16.01
|
600,362
57.71% of 50 DAV
50 DAV is 1,040,300
|
$19.44
-19.85%
|
7/15/2013
|
$17.87
|
PP = $18.68
|
|
MB = $19.61
|
Most Recent Note - 8/15/2013 7:14:10 PM
G - Slumping further below its 50 DMA line which acted as resistance recently. Subsequent damaging losses below recent lows near $15.50 would raise more serious concerns and trigger more worrisome technical sell signals.
>>> The latest Featured Stock Update with an annotated graph appeared on 8/13/2013. Click here.
View all notes |
Alert me of new notes |
CANSLIM.net Company Profile |
SEC |
Zacks Reports |
StockTalk |
News |
Chart |
Request a new note
C
A N
S L
I M


|
BITA
-
NYSE
Bitauto Hldgs Ltd Ads
INTERNET - Internet Information Providers
|
$14.36
|
+1.50
11.66% |
$15.33
|
589,882
317.14% of 50 DAV
50 DAV is 186,000
|
$18.10
-20.66%
|
8/7/2013
|
$12.01
|
PP = $13.30
|
|
MB = $13.97
|
 Most Recent Note - 8/19/2013 12:06:37 PM
G - Gapped up today, finding prompt support near prior highs and rebounding toward its recent high closes following 5 consecutive losses marked by above average volume. Disciplined investors always limit losses if any stock falls more than -7-8% from their purchase price.
>>> The latest Featured Stock Update with an annotated graph appeared on 8/7/2013. Click here.
View all notes |
Alert me of new notes |
CANSLIM.net Company Profile |
SEC |
Zacks Reports |
StockTalk |
News |
Chart |
Request a new note
C
A N
S L
I M
|
CELG
-
NASDAQ
Celgene Corp
DRUGS - Drug Manufacturers - Major
|
$132.44
|
-0.05
-0.04% |
$135.75
|
1,754,312
67.67% of 50 DAV
50 DAV is 2,592,600
|
$149.92
-11.66%
|
7/11/2013
|
$133.25
|
PP = $131.92
|
|
MB = $138.52
|
Most Recent Note - 8/13/2013 6:43:38 PM
Y - Color code is changed to yellow after retreating below its "max buy" level with a loss today on average volume. Prior highs in the $131 area define initial chart support above its 50 DMA line.
>>> The latest Featured Stock Update with an annotated graph appeared on 7/29/2013. Click here.
View all notes |
Alert me of new notes |
CANSLIM.net Company Profile |
SEC |
Zacks Reports |
StockTalk |
News |
Chart |
Request a new note
C
A N
S L
I M
|
FLT
-
NYSE
Fleetcor Technologies
DIVERSIFIED SERVICES - Business/Management Services
|
$97.51
|
-0.16
-0.16% |
$99.65
|
324,590
48.23% of 50 DAV
50 DAV is 673,000
|
$100.87
-3.33%
|
8/19/2013
|
$99.01
|
PP = $100.97
|
|
MB = $106.02
|
Most Recent Note - 8/19/2013 12:13:29 PM
Y- Holding its ground in a tight range, it has formed an advanced "3-weeks tight" base, albeit a riskier "late stage" base. New pivot point is cited and its color code is changed to yellow. Keep in mind the M criteria argues against new buying efforts until a new confirmed rally.
>>> The latest Featured Stock Update with an annotated graph appeared on 8/12/2013. Click here.
View all notes |
Alert me of new notes |
CANSLIM.net Company Profile |
SEC |
Zacks Reports |
StockTalk |
News |
Chart |
Request a new note
C
A N
S L
I M
|
GNRC
-
NYSE
Generac Hldgs Inc
CONSUMER DURABLES - Electronic Equipment
|
$42.30
|
-0.48
-1.12% |
$42.84
|
489,198
44.29% of 50 DAV
50 DAV is 1,104,600
|
$44.30
-4.51%
|
7/30/2013
|
$42.60
|
PP = $42.10
|
|
MB = $44.21
|
Most Recent Note - 8/15/2013 7:17:46 PM
Y - Holding its ground stubbornly after it recently rallied from an advanced "3-weeks tight" base and priced a Secondary Offering. Disciplined investors always limit losses by selling if any stock falls more than -7% from its purchase price.
>>> The latest Featured Stock Update with an annotated graph appeared on 7/30/2013. Click here.
View all notes |
Alert me of new notes |
CANSLIM.net Company Profile |
SEC |
Zacks Reports |
StockTalk |
News |
Chart |
Request a new note
C
A N
S L
I M
|
Symbol/Exchange
Company Name
Industry Group |
PRICE |
CHANGE
(%Change) |
Day High |
Volume
(% DAV)
(% 50 day avg vol) |
52 Wk Hi
% From Hi |
Featured
Date |
Price
Featured |
Pivot Featured |
|
Max Buy |
KORS
-
NYSE
Michael Kors Hldgs Ltd
RETAIL - Apparel Stores
|
$69.76
|
-0.44
-0.63% |
$70.44
|
2,032,134
57.21% of 50 DAV
50 DAV is 3,551,900
|
$72.98
-4.41%
|
8/6/2013
|
$69.66
|
PP = $66.28
|
|
MB = $69.59
|
Most Recent Note - 8/15/2013 7:19:05 PM
G - Holding its ground beyond its "max buy" level. Prior highs in the $66 area define initial support to watch on pullbacks.
>>> The latest Featured Stock Update with an annotated graph appeared on 8/6/2013. Click here.
View all notes |
Alert me of new notes |
CANSLIM.net Company Profile |
SEC |
Zacks Reports |
StockTalk |
News |
Chart |
Request a new note
C
A N
S L
I M
|
LOPE
-
NASDAQ
Grand Canyon Education
DIVERSIFIED SERVICES - Education and; Training Services
|
$32.75
|
-1.12
-3.31% |
$34.00
|
401,818
90.38% of 50 DAV
50 DAV is 444,600
|
$37.17
-11.89%
|
6/19/2013
|
$31.47
|
PP = $34.17
|
|
MB = $35.88
|
Most Recent Note - 8/14/2013 7:11:26 PM
Y - Consolidating above important near-term support. Reported earnings +15% on +19% sales for the Jun '13 quarter, below the +25% minimum earnings guideline (C criteria), raising fundamental concerns. See the latest FSU analysis for more details and a new annotated graph.
>>> The latest Featured Stock Update with an annotated graph appeared on 8/14/2013. Click here.
View all notes |
Alert me of new notes |
CANSLIM.net Company Profile |
SEC |
Zacks Reports |
StockTalk |
News |
Chart |
Request a new note
C
A N
S L
I M
|
PCLN
-
NASDAQ
Priceline.Com Inc
INTERNET - Internet Software and Services
|
$933.13
|
-6.94
-0.74% |
$947.00
|
466,830
64.98% of 50 DAV
50 DAV is 718,400
|
$994.98
-6.22%
|
7/8/2013
|
$878.28
|
PP = $847.43
|
|
MB = $889.80
|
Most Recent Note - 8/16/2013 6:57:21 PM
G - Consolidating above prior highs, extended from any sound base. Reported earnings +24% on +27% sales revenues for the Jun '13 quarter, just under the +25% minimum earnings guideline (C criteria).
>>> The latest Featured Stock Update with an annotated graph appeared on 8/19/2013. Click here.
View all notes |
Alert me of new notes |
CANSLIM.net Company Profile |
SEC |
Zacks Reports |
StockTalk |
News |
Chart |
Request a new note
C
A N
S L
I M
|
PRAA
-
NASDAQ
Portfolio Recovery Assoc
DIVERSIFIED SERVICES - Business/Management Services
|
$55.18
|
-0.40
-0.72% |
$56.59
|
589,768
115.32% of 50 DAV
50 DAV is 511,400
|
$57.57
-4.15%
|
7/31/2013
|
$51.43
|
PP = $54.72
|
|
MB = $57.46
|
Most Recent Note - 8/14/2013 1:09:23 PM
Y - Perched at its 52-week high today holding its ground following an impressive spurt of volume-driven gains. It rallied above the pivot point with +130% above average volume on the prior session clinching a new technical buy signal.
>>> The latest Featured Stock Update with an annotated graph appeared on 8/2/2013. Click here.
View all notes |
Alert me of new notes |
CANSLIM.net Company Profile |
SEC |
Zacks Reports |
StockTalk |
News |
Chart |
Request a new note
C
A N
S L
I M
|
PRLB
-
NYSE
Proto Labs Inc
MANUFACTURING - Small Tools and Accessories
|
$66.55
|
+0.93
1.42% |
$67.87
|
247,650
49.69% of 50 DAV
50 DAV is 498,400
|
$72.08
-7.67%
|
7/29/2013
|
$64.86
|
PP = $67.50
|
|
MB = $70.88
|
Most Recent Note - 8/19/2013 12:09:12 PM
Y - Recently consolidating above its 50 DMA line with volume totals cooling in recent weeks. That important short-term average and prior lows define important support to watch. Disciplined investors always limit losses if any stock falls more than -7% from their purchase price.
>>> The latest Featured Stock Update with an annotated graph appeared on 8/5/2013. Click here.
View all notes |
Alert me of new notes |
CANSLIM.net Company Profile |
SEC |
Zacks Reports |
StockTalk |
News |
Chart |
Request a new note
C
A N
S L
I M
|
Symbol/Exchange
Company Name
Industry Group |
PRICE |
CHANGE
(%Change) |
Day High |
Volume
(% DAV)
(% 50 day avg vol) |
52 Wk Hi
% From Hi |
Featured
Date |
Price
Featured |
Pivot Featured |
|
Max Buy |
QCOR
-
NASDAQ
Questcor Pharmaceuticals
DRUGS - Biotechnology
|
$65.13
|
-0.19
-0.29% |
$66.98
|
879,960
41.52% of 50 DAV
50 DAV is 2,119,300
|
$70.55
-7.68%
|
7/31/2013
|
$66.46
|
PP = $59.01
|
|
MB = $61.96
|
Most Recent Note - 8/13/2013 7:04:51 PM
G - Rallied to its second-best close today following a brief consolidation. Quickly got extended beyond its "max buy" level after highlighted in yellow in the 7/31/13 mid-day report (read here) with a weekly graph which illustrated its powerful long-term breakout to new highs.
>>> The latest Featured Stock Update with an annotated graph appeared on 8/1/2013. Click here.
View all notes |
Alert me of new notes |
CANSLIM.net Company Profile |
SEC |
Zacks Reports |
StockTalk |
News |
Chart |
Request a new note
C
A N
S L
I M
|
SFUN
-
NYSE
Soufun Hldgs Ltd Ads A
INTERNET - Internet Information Providers
|
$40.26
|
+4.09
11.31% |
$41.71
|
1,332,020
275.50% of 50 DAV
50 DAV is 483,500
|
$42.15
-4.48%
|
7/16/2013
|
$29.54
|
PP = $27.90
|
|
MB = $29.30
|
Most Recent Note - 8/19/2013 12:00:36 PM
G - Rallying near its 52-week high hit last week with today's considerable volume-driven gain. Very extended from its latest base, and prior reports noted - "Disciplined investors avoid chasing stocks too extended from sound bases."
>>> The latest Featured Stock Update with an annotated graph appeared on 8/8/2013. Click here.
View all notes |
Alert me of new notes |
CANSLIM.net Company Profile |
SEC |
Zacks Reports |
StockTalk |
News |
Chart |
Request a new note
C
A N
S L
I M
|
SSNC
-
NASDAQ
S S & C Technologies
COMPUTER SOFTWARE and SERVICES - Application Software
|
$34.80
|
-0.17
-0.49% |
$35.20
|
255,360
59.73% of 50 DAV
50 DAV is 427,500
|
$38.80
-10.31%
|
7/11/2013
|
$35.80
|
PP = $34.54
|
|
MB = $36.27
|
Most Recent Note - 8/16/2013 6:58:24 PM
Y - Still trading above its 50 DMA line and prior highs in the $34 area defining important support. Disciplined investors always limit losses if ever any stock falls more than -7% from their purchase price.
>>> The latest Featured Stock Update with an annotated graph appeared on 8/9/2013. Click here.
View all notes |
Alert me of new notes |
CANSLIM.net Company Profile |
SEC |
Zacks Reports |
StockTalk |
News |
Chart |
Request a new note
C
A N
S L
I M
|
SSYS
-
NASDAQ
Stratasys Ltd
COMPUTER HARDWARE - Computer Peripherals
|
$105.20
|
+5.97
6.02% |
$107.13
|
1,614,258
198.43% of 50 DAV
50 DAV is 813,500
|
$104.34
0.83%
|
7/8/2013
|
$91.44
|
PP = $95.00
|
|
MB = $99.75
|
Most Recent Note - 8/19/2013 12:02:45 PM
G - Considerable gain today for a new 52-week high, rallying above its "max buy" level again, and its color code is changed to green
>>> The latest Featured Stock Update with an annotated graph appeared on 8/16/2013. Click here.
View all notes |
Alert me of new notes |
CANSLIM.net Company Profile |
SEC |
Zacks Reports |
StockTalk |
News |
Chart |
Request a new note
C
A N
S L
I M
|
STMP
-
NASDAQ
Stamps.Com Inc
INTERNET - Internet Software and Services
|
$40.52
|
+0.55
1.38% |
$40.66
|
135,959
97.67% of 50 DAV
50 DAV is 139,200
|
$46.47
-12.80%
|
7/31/2013
|
$40.00
|
PP = $42.98
|
|
MB = $45.13
|
Most Recent Note - 8/13/2013 6:53:00 PM
Y - Found support at its 50 DMA line again after a recent bout of distributional pressure. Disciplined investors always limit losses if any stock falls more than -7% from their purchase price. Any stock which is sold can be bought again later if strength returns.
>>> The latest Featured Stock Update with an annotated graph appeared on 7/31/2013. Click here.
View all notes |
Alert me of new notes |
CANSLIM.net Company Profile |
SEC |
Zacks Reports |
StockTalk |
News |
Chart |
Request a new note
C
A N
S L
I M
|
Symbol/Exchange
Company Name
Industry Group |
PRICE |
CHANGE
(%Change) |
Day High |
Volume
(% DAV)
(% 50 day avg vol) |
52 Wk Hi
% From Hi |
Featured
Date |
Price
Featured |
Pivot Featured |
|
Max Buy |
VRX
-
NYSE
Valeant Pharmaceuticals
DRUGS - Drug Manufacturers - Other
|
$101.06
|
-1.94
-1.88% |
$103.21
|
1,548,433
96.84% of 50 DAV
50 DAV is 1,598,900
|
$105.40
-4.12%
|
4/30/2013
|
$60.24
|
PP = $76.66
|
|
MB = $80.49
|
Most Recent Note - 8/15/2013 7:10:07 PM
G- Holding its ground after rallying into new 52-week high territory with 9 gains in the span of 10 sessions. Reported earnings +33% on +34% sales revenues for the Jun '13 quarter, above the +25% minimum earnings guideline (C criteria). See the latest FSU analysis for more details and a new annotated graph.
>>> The latest Featured Stock Update with an annotated graph appeared on 8/15/2013. Click here.
View all notes |
Alert me of new notes |
CANSLIM.net Company Profile |
SEC |
Zacks Reports |
StockTalk |
News |
Chart |
Request a new note
C
A N
S L
I M
|
YNDX
-
NASDAQ
Yandex N V Class A
INTERNET - Internet Information Providers
|
$32.38
|
-0.74
-2.23% |
$33.08
|
3,267,874
131.14% of 50 DAV
50 DAV is 2,491,900
|
$34.79
-6.93%
|
7/10/2013
|
$29.29
|
PP = $29.59
|
|
MB = $31.07
|
Most Recent Note - 8/19/2013 12:15:13 PM
G - Retreating from its 52-week high hit last week. Its 50 DMA line coincides with prior highs in the $29 area defining important near-term support to watch.
>>> The latest Featured Stock Update with an annotated graph appeared on 7/26/2013. Click here.
View all notes |
Alert me of new notes |
CANSLIM.net Company Profile |
SEC |
Zacks Reports |
StockTalk |
News |
Chart |
Request a new note
C
A N
S L
I M
|
|
|
|
THESE ARE NOT BUY RECOMMENDATIONS!
Comments contained in the body of this report are technical
opinions only. The material herein has been obtained
from sources believed to be reliable and accurate, however,
its accuracy and completeness cannot be guaranteed.
This site is not an investment advisor, hence it does
not endorse or recommend any securities or other investments.
Any recommendation contained in this report may not
be suitable for all investors and it is not to be deemed
an offer or solicitation on our part with respect to
the purchase or sale of any securities. All trademarks,
service marks and trade names appearing in this report
are the property of their respective owners, and are
likewise used for identification purposes only.
This report is a service available
only to active Paid Premium Members.
You may opt-out of receiving report notifications
at any time. Questions or comments may be submitted
by writing to Premium Membership Services 665 S.E. 10 Street, Suite 201 Deerfield Beach, FL 33441-5634 or by calling 1-800-965-8307
or 954-785-1121.
|
|
|

