You are not logged in.
This means you
CAN ONLY VIEW reports that were published prior to Monday, April 14, 2025.
You
MUST UPGRADE YOUR MEMBERSHIP if you want to see any current reports.
AFTER MARKET UPDATE - WEDNESDAY, AUGUST 19TH, 2009
Previous After Market Report Next After Market Report >>>
|
|
|
|
DOW |
+61.22 |
9,279.16 |
+0.66% |
|
Volume |
988,249,570 |
-0% |
|
Volume |
2,030,916,360 |
+14% |
|
NASDAQ |
+13.32 |
1,969.24 |
+0.68% |
|
Advancers |
1,848 |
59% |
|
Advancers |
1,707 |
60% |
|
S&P 500 |
+6.79 |
996.46 |
+0.69% |
|
Decliners |
1,142 |
37% |
|
Decliners |
963 |
34% |
|
Russell 2000 |
+5.22 |
561.65 |
+0.94% |
|
52 Wk Highs |
39 |
|
|
52 Wk Highs |
18 |
|
|
S&P 600 |
+2.17 |
297.14 |
+0.74% |
|
52 Wk Lows |
4 |
|
|
52 Wk Lows |
6 |
|
|
 |
Light Volume Totals Underscore Market's Half-Hearted Gains
Adam Sarhan, Contributing Writer,
The major averages fluctuated between positive and negative territory on Wednesday, days after the market fell into a correction. The indices ended with modest gains while volume was reported slightly lighter on the NYSE and the Nasdaq volume total rose - both totals were below average volume totals. Advancers led decliners by a 3-to-2 ratio on the NYSE and by nearly a 2-to-1 ratio on the Nasdaq exchange. There were only 6 high-ranked companies from the CANSLIM.net Leaders List that made a new 52-week high and appeared on the CANSLIM.net BreakOuts Page, one up from the 5 issues that appeared on the prior session. New 52-week highs outnumbered new 52-week lows on both exchanges, and new lows were in the single digits.
The US dollar tumbled on Wednesday which helped the major averages and a slew of commodities (i.e. gold and crude oil) rally. CANSLIM.net's Market Commentary has noted multiple times in the past about how important it is in today's modern age to keep an eye on other markets since they are so interdependent. Energy shares were among the day's strongest advancers since crude oil managed to recover much that it lost earlier in the week.
China's stock market fell another -5% which extended its decline from its 2009 high to over -20% which is the classic definition of a bear market. Normally, bear markets occur whenever a market or individual stock fall -20% from its most recent high. It is also important to note that China was one of the first of the globe's stock markets to recover from last year's brutal sell off. The fact it is back in "bear market" territory suggests that it may also lead the way lower again.
So far, the U.S. and Chinese governments have pledged more than $13 trillion (the entire size of the US economy) to combat the worst financial crisis since the Great Depression. This massive influx of government aid played a pivotal role in fueling the major rally we have seen in stock markets around the globe. Remember to remain cautious until a new batch of high ranked leadership emerges and the market manages to produce a sound follow-through day.
Money Management Services:
Are you looking for a money manager who follows a proven set of rules? All of our portfolio managers have completed the Master's Program and are highly skilled at using this powerful investment system. You may inquire about having your account professionally managed using this fact-based investment system by clicking HERE. *Accounts over $250,000 please. ** Serious inquiries only.
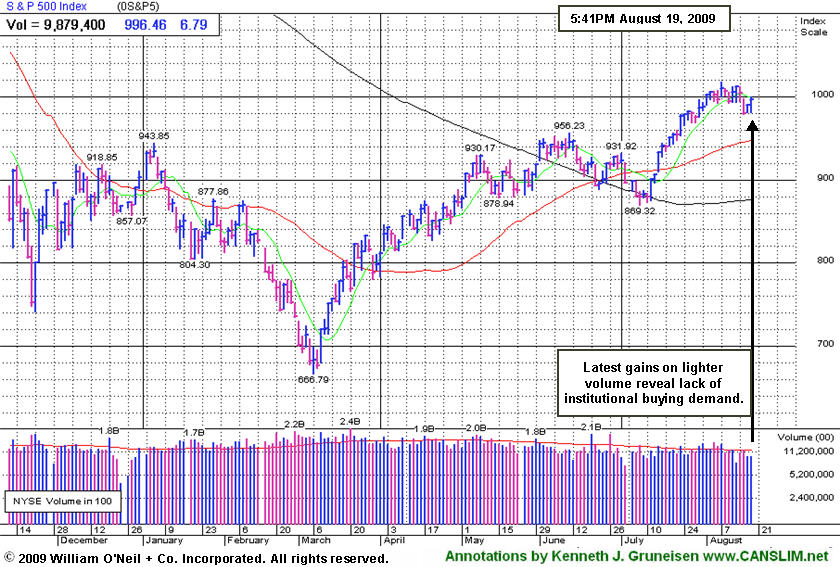
PICTURED: The S&P 500 Index's 2 most recent gains came with below average volume, evidence indicative of very little institutional buying demand since the market correction began. Remember to remain cautious until a new batch of high ranked leadership emerges and the market manages to produce a sound follow-through day.
|
|
|
 |
Retail Index Consolidating Above Prior Chart Highs
Kenneth J. Gruneisen - Passed the CAN SLIM® Master's Exam
Commodity-linked areas were among Wednesday's leading gainers as the Gold & Silver Index ($XAU +1.18%), Integrated Oil Index ($XOI +1.58%), and Oil Services Index ($OSX +1.66%) advanced. The Biotechnology Index ($BTK +2.19%) led the tech sector while there were smaller gains from the Networking Index ($NWX +0.30%), Semiconductor Index ($SOX +0.60%), and Internet Index ($IIX +0.61%). While the Retail Index ($RLX +0.65%) was also a positive influence, modest losses for the Healthcare Index ($HMO -0.68%), Broker/Dealer Index ($XBD -0.20%), and Bank Index ($BKX -0.16%) created a drag that limited the major averages' ability to rally.
Charts courtesy www.stockcharts.com
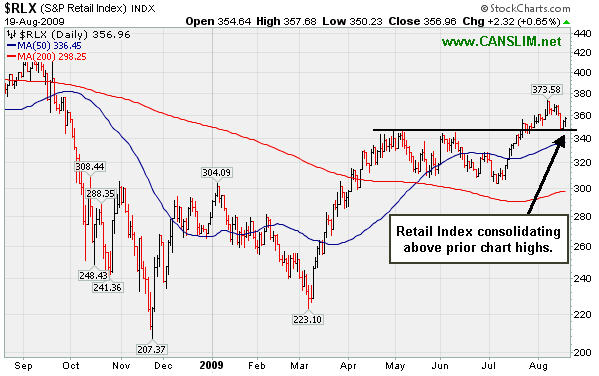
PICTURED: The Retail Index ($RLX +0.65%) is consolidating above prior chart highs.
| Oil Services |
$OSX |
171.38 |
+2.80 |
+1.66% |
+41.18% |
| Healthcare |
$HMO |
1,195.14 |
-8.14 |
-0.68% |
+24.47% |
| Integrated Oil |
$XOI |
949.26 |
+14.78 |
+1.58% |
-3.11% |
| Semiconductor |
$SOX |
293.42 |
+1.75 |
+0.60% |
+38.29% |
| Networking |
$NWX |
207.48 |
+0.63 |
+0.30% |
+44.19% |
| Internet |
$IIX |
200.19 |
+1.21 |
+0.61% |
+49.65% |
| Broker/Dealer |
$XBD |
107.99 |
-0.22 |
-0.20% |
+39.40% |
| Retail |
$RLX |
356.96 |
+2.32 |
+0.65% |
+27.82% |
| Gold & Silver |
$XAU |
142.88 |
+1.66 |
+1.18% |
+15.37% |
| Bank |
$BKX |
44.65 |
-0.07 |
-0.16% |
+0.74% |
| Biotech |
$BTK |
859.95 |
+18.46 |
+2.19% |
+32.88% |
|
|
|
 |
Relative Strength Rank Emphasizes Recent Underperformance
Kenneth J. Gruneisen - Passed the CAN SLIM® Master's Exam
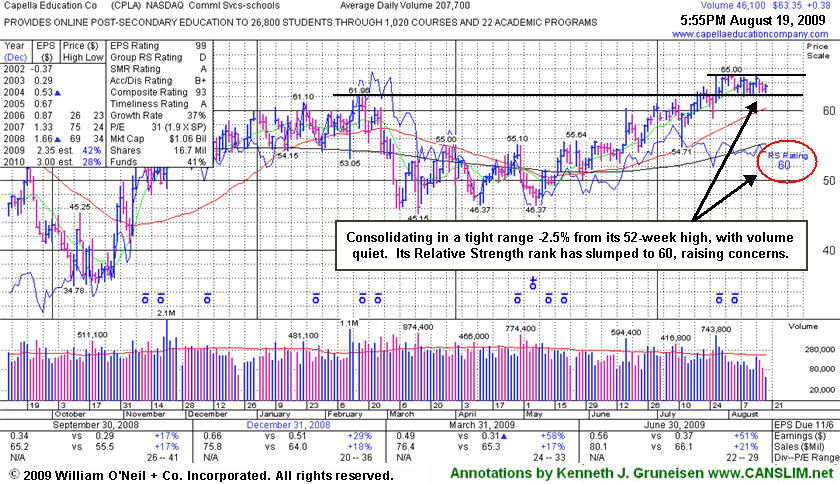
Capella Education Co. (CPLA +$0.38 or +0.60% to $63.35) is consolidating above prior chart highs now which are likely to serve as a support level. Just -2.5% from its 52-week high, volume has been mostly quiet during its healthy consolidation, and there is virtually no resistance due to overhead supply. Its gap up gain on 7/28/09 with more than +50% above average volume helped it rise above its pivot point and trigger a technical buy signal. However, since first featured in yellow in the 7/09/09 Mid-Day BreakOuts Report (read here) its Relative Strength rank has slumped to a mediocre 60 (see the red circle), under the 80+ guideline, a sign that it has recently been lagging. By comparison, Bank Of America Corp (BAC -0.89%) is now -57.6% off its 52 week high, yet it currently is being rewarded with a 90 Relative Strength rank. This anomaly is due to the fact the newspapers' relative strength ranking system puts greater emphasis on the most recent 6 month period, and CPLA has moved mostly sideways in that time frame, meanwhile many badly beaten down stocks like BAC have rallied back considerably from their extreme lows in the past 6 months.
This is a strong performing leader in the Commercial Services-Schools Group. While the group has shown some leadership, concern is raised by the fact it currently has a D for a Relative Strength Rating. CPLA's small supply of only 13.9 million shares in the float could contribute to greater price volatility in the event of institutional accumulation or distribution. The number of top-rated funds owning an interest rose from 91 in Sept '08, to 136 as of June '09, which is reassuring with respect to the I criteria. It has a very good earnings history that satisfies the C & A criteria.
A follow through day of constructive gains with heavier volume from the major averages, and from this issue, would be very crucial reassurances confirming heavy buying demand from the large institutional investors - demand which can fuel a sustained rally. Meanwhile, subsequent deterioration back under its pivot point would negate its breakout, raise concerns, and trigger a technical sell signal.
|
|
|
Color Codes Explained :
Y - Better candidates highlighted by our
staff of experts.
G - Previously featured
in past reports as yellow but may no longer be buyable under the
guidelines.
***Last / Change / Volume quote data in this table corresponds with the timestamp on the note***
Symbol/Exchange
Company Name
Industry Group |
Last |
Chg. |
Vol
% DAV |
Date Featured |
Price Featured |
Latest Pivot Point
Featured |
Status |
| Latest Max Buy Price |
CPLA
- NASDAQ
Capella Education Co
DIVERSIFIED SERVICES - Education and Training Services
|
$63.35
|
+0.38
|
47,569
23% DAV
207,700
|
7/9/2009
(Date
Featured) |
$59.69
(Price
Featured) |
PP = $62.06 |
Y |
| MB = $65.16 |
Most Recent Note - 8/19/2009 4:27:49 PM
Y - Quietly consolidating in a tight range on light volume, now -2.5% off its 52-week high, still above its pivot point but below the "max buy" level. Featured in yellow in the 7/09/09 Mid-Day BreakOuts Report (read here). The Commercial Services-Schools Group has shown some leadership but has low ranks, and CPLA's Relative Strength rank has slumped to 60, under the 80+ guideline. Its small supply of only 13.9 million shares in the float could contribute to greater price volatility in the event of institutional accumulation or distribution. The number of top-rated funds owning an interest rose from 91 in Sept '08, to 136 as of June '09, which is reassuring with respect to the I criteria. It has a very good earnings history that satisfies the C & A criteria, while recent quarters showed steady sales revenues increases in the +17-18% range.
>>> The latest Featured Stock Update with an annotated graph appeared on 8/19/2009. click here.
|
|
C
A
S
I |
News |
Chart |
SEC
View all notes Alert
me of new notes
Company
Profile
|
CRM
- NYSE
Salesforce.com Inc
INTERNET - Internet Software & Services
|
$45.04
|
+0.74
|
2,231,523
134% DAV
1,665,900
|
8/16/2009
(Date
Featured) |
$47.12
(Price
Featured) |
PP = $45.59 |
G |
| MB = $47.87 |
Most Recent Note - 8/19/2009 4:49:32 PM
G - Positively reversed today, yet it remains under its pivot point. Color code was changed to green, and it would need to rally back above its pivot point for the outlook to improve. A Stock Bulletin was just published on 8/16/09 (read here).
>>> The latest Featured Stock Update with an annotated graph appeared on 8/16/2009. click here.
|
|
C
A
S
I |
News |
Chart |
SEC
View all notes Alert
me of new notes
Company
Profile
|
GMCR
- NASDAQ
Green Mtn Coffee Roastrs
FOOD & BEVERAGE - Processed & Packaged Goods
|
$55.61
|
-3.22
|
3,520,761
221% DAV
1,591,200
|
7/17/2009
(Date
Featured) |
$60.15
(Price
Featured) |
PP = $63.79 |
G |
| MB = $66.98 |
Most Recent Note - 8/19/2009 4:50:55 PM
G - Gapped down again today for another considerable loss with heavy volume more than 2 times average indicative of distribution, raising concerns while approaching the next support at prior chart lows in the $53 area. Its gap down and considerable loss on 8/17/09 on heavy volume triggered technical sell signals, capping a 6 session losing streak as it violated its 50 DMA line, prior highs in the $62-63 area, and an upward trendline. GMCR traded up more than +168% since appearing with an annotated graph under the headline "It May Soon Be Time To Go Green" when featured in the January 2009 CANSLIM.net News (read here).
>>> The latest Featured Stock Update with an annotated graph appeared on 8/14/2009. click here.
|
|
C
A
S
I |
News |
Chart |
SEC
View all notes Alert
me of new notes
Company
Profile
|
LFT
-
|
$25.72
|
-2.26
|
3,359,693
427% DAV
787,100
|
8/10/2009
(Date
Featured) |
$31.49
(Price
Featured) |
PP = $30.57 |
G |
| MB = $32.10 |
Most Recent Note - 8/19/2009 4:52:05 PM
G - Gapped down again today after reporting results for the quarter ended June 30, 2009, falling substantially on heavy volume 4 times average indicative of distributional pressure. Color code was changed to green after it technically negated its recent breakout.
>>> The latest Featured Stock Update with an annotated graph appeared on 8/12/2009. click here.
|
|
C
A
S
I |
News |
Chart |
SEC
View all notes Alert
me of new notes
Company
Profile
|
NTES
- NASDAQ
Netease Inc Adr
INTERNET - Internet Information Providers
|
$41.44
|
+0.06
|
1,544,904
64% DAV
2,430,000
|
7/17/2009
(Date
Featured) |
$39.29
(Price
Featured) |
PP = $38.74 |
G |
| MB = $40.68 |
Most Recent Note - 8/19/2009 5:04:42 PM
G - Small gains on lighter volume followed 3 consecutive losses with much heavier volume that pressured it near its 50 DMA line. Thus far it has found support near its short-term average and prior chart highs in the $38 area. A 8/13/09 gap down for a considerable loss on nearly 4 times average volume triggered a technical sell signal. Results for the quarter ended June 30, 2009 showed a big earnings per share increase, but sales revenues were reported at -1% versus the year ago period, continuing its pattern of worrisome sequential deceleration in sales revenues increases from +79%, +59%, +42% in the Jun, Sep, Dec '08 comparisons and +24% in Mar '09. First featured at $26.75 in the 3/31/09 CANSLIM.net Mid-Day Breakouts Report (read here).
>>> The latest Featured Stock Update with an annotated graph appeared on 8/13/2009. click here.
|
|
C
A
S
I |
News |
Chart |
SEC
View all notes Alert
me of new notes
Company
Profile
|
NVEC
- NASDAQ
N V E Corp
ELECTRONICS - Semiconductor - Specialized
|
$51.62
|
+0.84
|
55,278
57% DAV
96,700
|
3/13/2009
(Date
Featured) |
$33.85
(Price
Featured) |
PP = $49.60 |
G |
| MB = $52.08 |
Most Recent Note - 8/19/2009 5:05:30 PM
G - Quietly consolidating near important initial support at its 50 DMA line (now $48.66) and prior chart highs. Featured in the 7/23/09 Mid-Day BreakOuts Report (read here) after it gapped up for a considerable gain on heavy volume following news of stronger sales revenues (+41%) and solid earnings increases for the quarter ended June 30, 2009. The technical action was described as a "breakaway gap" from a valid ascending base. Quarterly sales revenues in the 6 million dollar range are still rather minuscule, leaving concerns.
>>> The latest Featured Stock Update with an annotated graph appeared on 8/18/2009. click here.
|
|
C
A
S
I |
News |
Chart |
SEC
View all notes Alert
me of new notes
Company
Profile
|
PEGA
- NASDAQ
Pegasystems Inc
COMPUTER SOFTWARE & SERVICES - Business Software & Services
|
$27.94
|
+0.07
|
353,404
116% DAV
304,100
|
7/29/2009
(Date
Featured) |
$27.53
(Price
Featured) |
PP = $27.49 |
G |
| MB = $28.86 |
Most Recent Note - 8/19/2009 5:07:12 PM
G - Positively reversed today while testing support near its 50 DMA line. Color code was changed to green after a 8/17/09 gap down loss while volume spiked higher. Previous resistance in the mid-$27 area has been noted as an important technical support level to watch above its 50 DMA line. Considerable 8/05/09 gain with nearly 5 times average volume followed strong Q2 earnings and raised guidance. The high-ranked software firm triggered a technical buy signal when rising from the "double bottom" base when it was featured in the 7/29/09 mid-day report (read here).
>>> The latest Featured Stock Update with an annotated graph appeared on 8/11/2009. click here.
|
|
C
A
S
I |
News |
Chart |
SEC
View all notes Alert
me of new notes
Company
Profile
|
UTA
-
|
$12.06
|
+0.13
|
365,616
65% DAV
562,700
|
7/28/2009
(Date
Featured) |
$12.87
(Price
Featured) |
PP = $12.70 |
G |
| MB = $13.34 |
Most Recent Note - 8/19/2009 5:09:11 PM
G - Consolidating on quieter volume near its 50 DMA line and prior chart highs. A negative reversal on 8/13/09 for a loss on very heavy volume was noted as a clear sign of worrisome distributional pressure. Wider intra-day swings of late were noted as a sign of uncertainty raising concerns. Strong action prompted it to be featured in yellow with pivot point and max buy levels noted in the 7/28/09 mid-day breakouts report (read here), with additional analysis included in the after market update (read here).
>>> The latest Featured Stock Update with an annotated graph appeared on 8/7/2009. click here.
|
|
C
A
S
I |
News |
Chart |
SEC
View all notes Alert
me of new notes
Company
Profile
|
|
|
|
THESE ARE NOT BUY RECOMMENDATIONS!
Comments contained in the body of this report are technical
opinions only. The material herein has been obtained
from sources believed to be reliable and accurate, however,
its accuracy and completeness cannot be guaranteed.
This site is not an investment advisor, hence it does
not endorse or recommend any securities or other investments.
Any recommendation contained in this report may not
be suitable for all investors and it is not to be deemed
an offer or solicitation on our part with respect to
the purchase or sale of any securities. All trademarks,
service marks and trade names appearing in this report
are the property of their respective owners, and are
likewise used for identification purposes only.
This report is a service available
only to active Paid Premium Members.
You may opt-out of receiving report notifications
at any time. Questions or comments may be submitted
by writing to Premium Membership Services 665 S.E. 10 Street, Suite 201 Deerfield Beach, FL 33441-5634 or by calling 1-800-965-8307
or 954-785-1121.
|
|
|


