You are not logged in.
This means you
CAN ONLY VIEW reports that were published prior to Tuesday, March 11, 2025.
You
MUST UPGRADE YOUR MEMBERSHIP if you want to see any current reports.
AFTER MARKET UPDATE - THURSDAY, AUGUST 20TH, 2009
Previous After Market Report Next After Market Report >>>
|
|
|
|
DOW |
+70.89 |
9,350.05 |
+0.76% |
|
Volume |
1,046,333,290 |
+6% |
|
Volume |
2,031,707,480 |
+0% |
|
NASDAQ |
+19.98 |
1,989.22 |
+1.01% |
|
Advancers |
2,224 |
71% |
|
Advancers |
1,771 |
62% |
|
S&P 500 |
+10.91 |
1,007.37 |
+1.09% |
|
Decliners |
812 |
26% |
|
Decliners |
929 |
33% |
|
Russell 2000 |
+7.03 |
568.68 |
+1.25% |
|
52 Wk Highs |
76 |
|
|
52 Wk Highs |
42 |
|
|
S&P 600 |
+3.74 |
300.88 |
+1.26% |
|
52 Wk Lows |
1 |
|
|
52 Wk Lows |
4 |
|
|
 |
Major Averages Rally Again With Below Average Volume
Adam Sarhan, Contributing Writer,
The major averages rallied for a third consecutive day, helped by a big rally in China and news that American International Group Inc. (AIG +21.25%) said it plans to repay the government. The indices ended with modest gains while volume was reported slightly higher on both exchanges, but volume continues to be below average which is not a good sign of institutional sponsorship. Advancers led decliners by over a 2-to-1 ratio on the NYSE and by nearly a 2-to-1 ratio on the Nasdaq exchange. There were 14 high-ranked companies from the CANSLIM.net Leaders List that made a new 52-week high and appeared on the CANSLIM.net BreakOuts Page, up from the 6 issues that appeared on the prior session. New 52-week highs outnumbered new 52-week lows on both exchanges.
Overnight, shares in China rallied +5% after briefly touching bear market territory on Wednesday- marked by a decline of -20% from a prior high. This helped shares around the world rally, since most of the recent sell-off stemmed from China. AIG surged +22% for the top gain in the Standard & Poor’s 500 Index after Chief Executive Officer Robert Benmosche said the company plans to repay the government bailout and do something for its shareholders. Benmosche, the company's new CEO, said in an interview in Croatia that "at the end of the day, we believe we will be able to pay back the government and we hope we will be able to do something for our shareholders as well." Last year, AIG agreed to exchange nearly +80% of its equity for a $60 billion credit line, an investment of as much as $70 billion and $52.5 billion to buy mortgage-linked assets owned or backed by the insurer. This was one of the largest bailouts in history. If the company can repay the government it is a net positive, so the news boosted optimism that the brunt of the financial crisis is now behind us- which bodes well for other financial firms
Elsewhere, Treasury Secretary Timothy Geithner said he thinks the US economic recovery is still in the nascent stages as evidenced by the recent onslaught of stronger-than-expected earnings and economic data. Geithner said, "We have a long way to go, but we are starting to see signs of stability, and these signs mark the first steps to recovery." On the economic front, US leading economic indicators rose last month for a fourth straight month. The Conference Board’s gauge rose +0.6% for the longest consecutive series of increases since 2004. Another report showed that manufacturing in the Philadelphia region unexpectedly expanded this month which was the first increase in almost a year. The economic and manufacturing data added to recent flurry of evidence that the recession may be ending.
PICTURED: The S&P 500 Index continues to advance on below average volume as it approaches its recent chart resistance level (prior highs at 1,018).
|
|
|
 |
Financial And Tech Groups Lead Gainers
Kenneth J. Gruneisen - Passed the CAN SLIM® Master's Exam
The financial group helped underpin the major averages' gains on Thursday as the Broker/Dealer Index ($XBD +1.94%) and Bank Index ($BKX +2.87%) were on the rise. Tech sector indices ended unanimously higher as the Internet Index ($IIX +1.74%), Networking Index ($NWX +1.98%), Semiconductor Index ($SOX +1.02%), and Biotechnology Index ($BTK +1.42%) advanced. Generally defensive areas also posed gains as the Healthcare Index ($HMO +1.51%), Gold & Silver Index ($XAU +0.94%), Integrated Oil Index ($XOI +0.95%), and Oil Services Index ($OSX +1.46%) climbed. The Retail Index ($RLX +0.41%) rounded out the widely positive session with a modest gain.
Charts courtesy www.stockcharts.com
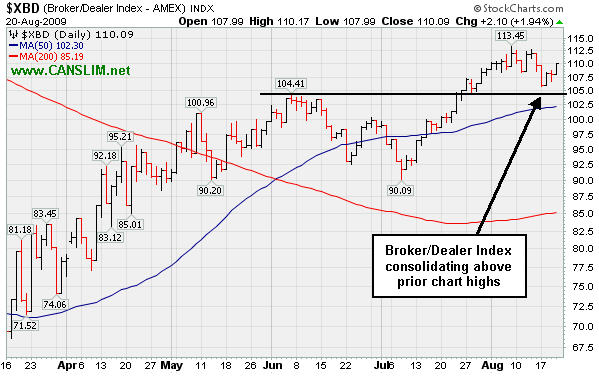
PICTURED: The Broker/Dealer Index ($XBD +1.94%) is consolidating above prior chart highs.
| Oil Services |
$OSX |
173.88 |
+2.50 |
+1.46% |
+43.24% |
| Healthcare |
$HMO |
1,213.19 |
+18.05 |
+1.51% |
+26.35% |
| Integrated Oil |
$XOI |
958.26 |
+9.00 |
+0.95% |
-2.19% |
| Semiconductor |
$SOX |
296.41 |
+2.99 |
+1.02% |
+39.70% |
| Networking |
$NWX |
211.58 |
+4.10 |
+1.98% |
+47.04% |
| Internet |
$IIX |
203.68 |
+3.49 |
+1.74% |
+52.26% |
| Broker/Dealer |
$XBD |
110.09 |
+2.10 |
+1.94% |
+42.11% |
| Retail |
$RLX |
358.41 |
+1.45 |
+0.41% |
+28.34% |
| Gold & Silver |
$XAU |
144.22 |
+1.34 |
+0.94% |
+16.45% |
| Bank |
$BKX |
45.93 |
+1.28 |
+2.87% |
+3.63% |
| Biotech |
$BTK |
872.18 |
+12.23 |
+1.42% |
+34.77% |
|
|
|
 |
Deterioration Raises Concerns After Initial Big Gains
Kenneth J. Gruneisen - Passed the CAN SLIM® Master's Exam
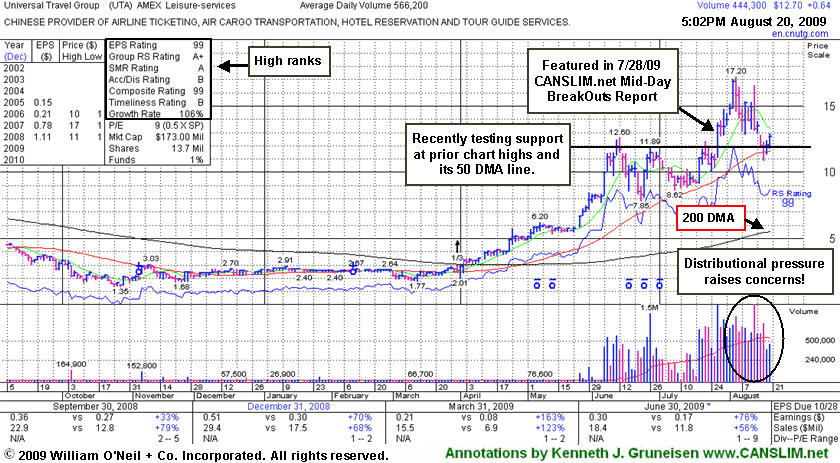
Universal Travel Group (UTA +$0.64 or +5.06% to $12.70) has posted gains on light volume after recently encountering heavy distributional pressure, pulling back near prior chart highs and its 50-day moving average line. The Chinese provider of airline tickets and travel related services erased all of its gains since it gapped up on 7/28/09 when rising from a choppy 6-week base. Strong action had prompted it to be featured in yellow at $12.87 in the 7/28/09 CANSLIM.net Mid-Day Breakouts report (read here), and it subsequently traded as much as +33.64% higher. Its considerable gain above its pivot point came with very heavy volume nearly 6 times its average daily trading total. Heavy volume, well above the minimum +50% above average volume guideline, has accompanied many of the market's biggest historic winners.
The investment system has a rule that says whenever a stock rises +20% or more in 2-3 weeks or less from when it was bought, that stock should be held for at least 8 weeks and be given a chance to produce bigger gains. The rule was created because the market's most explosive winners often got off to a strong start. However, the stock's bad breakdown and deteriorating market environment (the M criteria) argue strongly against giving it the benefit of any doubt. For now it is making a stand at an important level, but keep in mind that there is a lot of risk after its many-fold run from its March lows. The fact that it is trading more than +100% above its 200-day moving average line gives investors another reason to be especially disciplined about making proper entries and exits. Always limit losses if any stock falls more than -7% from your buy point.
|
|
|
Color Codes Explained :
Y - Better candidates highlighted by our
staff of experts.
G - Previously featured
in past reports as yellow but may no longer be buyable under the
guidelines.
***Last / Change / Volume quote data in this table corresponds with the timestamp on the note***
Symbol/Exchange
Company Name
Industry Group |
Last |
Chg. |
Vol
% DAV |
Date Featured |
Price Featured |
Latest Pivot Point
Featured |
Status |
| Latest Max Buy Price |
CPLA
- NASDAQ
Capella Education Co
DIVERSIFIED SERVICES - Education and Training Services
|
$64.65
|
+1.30
|
69,704
34% DAV
204,800
|
7/9/2009
(Date
Featured) |
$59.69
(Price
Featured) |
PP = $62.06 |
Y |
| MB = $65.16 |
Most Recent Note - 8/20/2009 4:36:19 PM
Y - Quietly consolidating in a tight range on light volume, now -0.5% off its 52-week high, still above its pivot point but below the "max buy" level. Featured in yellow in the 7/09/09 Mid-Day BreakOuts Report (read here). The Commercial Services-Schools Group has shown some leadership but has low ranks, and CPLA's Relative Strength rank has slumped to 55, under the 80+ guideline. Its small supply of only 13.9 million shares in the float could contribute to greater price volatility in the event of institutional accumulation or distribution. The number of top-rated funds owning an interest rose from 91 in Sept '08, to 136 as of June '09, which is reassuring with respect to the I criteria. It has a very good earnings history that satisfies the C & A criteria, while recent quarters showed steady sales revenues increases in the +17-18% range.
>>> The latest Featured Stock Update with an annotated graph appeared on 8/19/2009. click here.
|
|
C
A
S
I |
News |
Chart |
SEC
View all notes Alert
me of new notes
Company
Profile
|
CRM
- NYSE
Salesforce.com Inc
INTERNET - Internet Software & Services
|
$46.18
|
+1.14
|
4,011,411
240% DAV
1,668,800
|
8/16/2009
(Date
Featured) |
$47.12
(Price
Featured) |
PP = $45.59 |
Y |
| MB = $47.87 |
Most Recent Note - 8/20/2009 7:00:26 PM
Y - Posted a solid gain today with nearly 2 times average volume and reported its latest quarterly financial report after the close. The gain helped it rally back above its previously cited pivot point. Color code is changed to yellow based on its resilience. A Stock Bulletin was published with detailed analysis and an annotated graph on 8/16/09 (read here).
>>> The latest Featured Stock Update with an annotated graph appeared on 8/16/2009. click here.
|
|
C
A
S
I |
News |
Chart |
SEC
View all notes Alert
me of new notes
Company
Profile
|
GMCR
- NASDAQ
Green Mtn Coffee Roastrs
FOOD & BEVERAGE - Processed & Packaged Goods
|
$58.50
|
+2.89
|
2,235,086
137% DAV
1,635,600
|
7/17/2009
(Date
Featured) |
$60.15
(Price
Featured) |
PP = $63.79 |
G |
| MB = $66.98 |
Most Recent Note - 8/20/2009 5:33:51 PM
G - Posted a solid gain today with above average volume, yet recent distribution raised concerns while approaching the next support at prior chart lows in the $53 area. Its gap down and considerable loss on 8/17/09 on heavy volume triggered technical sell signals, capping a 6 session losing streak as it violated its 50 DMA line, prior highs in the $62-63 area, and an upward trendline. GMCR traded up more than +168% since appearing with an annotated graph under the headline "It May Soon Be Time To Go Green" when featured in the January 2009 CANSLIM.net News (read here).
>>> The latest Featured Stock Update with an annotated graph appeared on 8/14/2009. click here.
|
|
C
A
S
I |
News |
Chart |
SEC
View all notes Alert
me of new notes
Company
Profile
|
LFT
-
|
$27.61
|
+1.89
|
1,059,337
127% DAV
834,900
|
8/10/2009
(Date
Featured) |
$31.49
(Price
Featured) |
PP = $30.57 |
G |
| MB = $32.10 |
Most Recent Note - 8/20/2009 5:38:45 PM
G - Gain today with volume near average helped it promptly rebound above its 50 DMA line. After reporting results for the quarter ended June 30, 2009 it fell substantially on heavy volume 4 times average indicative of distributional pressure. Color code was changed to green after it technically negated its recent breakout.
>>> The latest Featured Stock Update with an annotated graph appeared on 8/12/2009. click here.
|
|
C
A
S
I |
News |
Chart |
SEC
View all notes Alert
me of new notes
Company
Profile
|
NTES
- NASDAQ
Netease Inc Adr
INTERNET - Internet Information Providers
|
$41.74
|
+0.30
|
1,120,183
46% DAV
2,428,000
|
7/17/2009
(Date
Featured) |
$39.29
(Price
Featured) |
PP = $38.74 |
G |
| MB = $40.68 |
Most Recent Note - 8/20/2009 5:40:02 PM
G - Three small gains on ever-lighter volume have followed 3 consecutive losses with much heavier volume that pressured it near its 50 DMA line. Thus far it has found support near its short-term average and prior chart highs in the $38 area. A 8/13/09 gap down for a considerable loss on nearly 4 times average volume triggered a technical sell signal. Results for the quarter ended June 30, 2009 showed a big earnings per share increase, but sales revenues were reported at -1% versus the year ago period, continuing its pattern of worrisome sequential deceleration in sales revenues increases from +79%, +59%, +42% in the Jun, Sep, Dec '08 comparisons and +24% in Mar '09. First featured at $26.75 in the 3/31/09 CANSLIM.net Mid-Day Breakouts Report (read here).
>>> The latest Featured Stock Update with an annotated graph appeared on 8/13/2009. click here.
|
|
C
A
S
I |
News |
Chart |
SEC
View all notes Alert
me of new notes
Company
Profile
|
NVEC
- NASDAQ
N V E Corp
ELECTRONICS - Semiconductor - Specialized
|
$52.47
|
+0.85
|
33,532
35% DAV
95,900
|
3/13/2009
(Date
Featured) |
$33.85
(Price
Featured) |
PP = $49.60 |
G |
| MB = $52.08 |
Most Recent Note - 8/20/2009 6:17:59 PM
G - Quietly consolidating just above important initial support at its 50 DMA line (now $48.66) and prior chart highs. Featured in the 7/23/09 Mid-Day BreakOuts Report (read here) after it gapped up for a considerable gain on heavy volume following news of stronger sales revenues (+41%) and solid earnings increases for the quarter ended June 30, 2009. The technical action was described as a "breakaway gap" from a valid ascending base. Quarterly sales revenues in the 6 million dollar range are still rather minuscule, leaving concerns.
>>> The latest Featured Stock Update with an annotated graph appeared on 8/18/2009. click here.
|
|
C
A
S
I |
News |
Chart |
SEC
View all notes Alert
me of new notes
Company
Profile
|
PEGA
- NASDAQ
Pegasystems Inc
COMPUTER SOFTWARE & SERVICES - Business Software & Services
|
$28.64
|
+0.70
|
402,509
130% DAV
308,700
|
7/29/2009
(Date
Featured) |
$27.53
(Price
Featured) |
PP = $27.49 |
Y |
| MB = $28.86 |
Most Recent Note - 8/20/2009 6:21:14 PM
Y - Holding its ground above its 50 DMA line. Color code is changed to yellow based on its resilience near its short-term average and pivot point. Concerns were raised by its 8/17/09 gap down loss while volume spiked higher. Previous resistance in the mid-$27 area has been noted as an important technical support level to watch above its 50 DMA line. Considerable 8/05/09 gain with nearly 5 times average volume followed strong Q2 earnings and raised guidance. The high-ranked software firm triggered a technical buy signal when rising from the "double bottom" base when it was featured in the 7/29/09 mid-day report (read here).
>>> The latest Featured Stock Update with an annotated graph appeared on 8/11/2009. click here.
|
|
C
A
S
I |
News |
Chart |
SEC
View all notes Alert
me of new notes
Company
Profile
|
UTA
-
|
$12.67
|
+0.61
|
446,193
79% DAV
566,200
|
7/28/2009
(Date
Featured) |
$12.87
(Price
Featured) |
PP = $12.70 |
G |
| MB = $13.34 |
Most Recent Note - 8/20/2009 6:22:14 PM
G - Consolidating near its 50 DMA line and prior chart highs. A negative reversal on 8/13/09 for a loss on very heavy volume was noted as a clear sign of worrisome distributional pressure. Wider intra-day swings of late were noted as a sign of uncertainty raising concerns. Strong action prompted it to be featured in yellow with pivot point and max buy levels noted in the 7/28/09 mid-day breakouts report (read here), with additional analysis included in the after market update (read here).
>>> The latest Featured Stock Update with an annotated graph appeared on 8/20/2009. click here.
|
|
C
A
S
I |
News |
Chart |
SEC
View all notes Alert
me of new notes
Company
Profile
|
|
|
|
THESE ARE NOT BUY RECOMMENDATIONS!
Comments contained in the body of this report are technical
opinions only. The material herein has been obtained
from sources believed to be reliable and accurate, however,
its accuracy and completeness cannot be guaranteed.
This site is not an investment advisor, hence it does
not endorse or recommend any securities or other investments.
Any recommendation contained in this report may not
be suitable for all investors and it is not to be deemed
an offer or solicitation on our part with respect to
the purchase or sale of any securities. All trademarks,
service marks and trade names appearing in this report
are the property of their respective owners, and are
likewise used for identification purposes only.
This report is a service available
only to active Paid Premium Members.
You may opt-out of receiving report notifications
at any time. Questions or comments may be submitted
by writing to Premium Membership Services 665 S.E. 10 Street, Suite 201 Deerfield Beach, FL 33441-5634 or by calling 1-800-965-8307
or 954-785-1121.
|
|
|


