You are not logged in.
This means you
CAN ONLY VIEW reports that were published prior to Monday, April 14, 2025.
You
MUST UPGRADE YOUR MEMBERSHIP if you want to see any current reports.
AFTER MARKET UPDATE - MONDAY, AUGUST 18TH, 2014
Previous After Market Report Next After Market Report >>>
|
|
|
|
DOW |
+175.83 |
16,838.74 |
+1.06% |
|
Volume |
592,205,860 |
-20% |
|
Volume |
1,456,285,250 |
-13% |
|
NASDAQ |
+43.38 |
4,508.31 |
+0.97% |
|
Advancers |
2,434 |
77% |
|
Advancers |
2,104 |
73% |
|
S&P 500 |
+16.68 |
1,971.74 |
+0.85% |
|
Decliners |
648 |
20% |
|
Decliners |
690 |
24% |
|
Russell 2000 |
+16.75 |
1,158.40 |
+1.47% |
|
52 Wk Highs |
178 |
|
|
52 Wk Highs |
81 |
|
|
S&P 600 |
+9.54 |
666.64 |
+1.45% |
|
52 Wk Lows |
17 |
|
|
52 Wk Lows |
39 |
|
|
 |
Major Averages Rose With Higher Volume Totals
Kenneth J. Gruneisen - Passed the CAN SLIM® Master's Exam
Stocks kicked off the week on a positive note. The Dow Jones Industrial Average gained 175 points to 16,838. The S&P 500 rose 16 points to 1,971. The NASDAQ increased 43 points to 4,508, its highest level since March 2000. Volume totals were lighter on both major exchanges. Breadth was positive as advancers led decliners by a 3-1 margin on the NYSE and on the NASDAQ exchange. Leadership expanded as there were 56 high-ranked companies from the CANSLIM.net Leaders List that made new 52-week highs and appeared on the CANSLIM.net BreakOuts Page, up from the prior session total of 41 stocks. New 52-week highs outnumbered new 52-week lows on the NYSE and on the Nasdaq exchange. There were gains for 7 of the 10 of the high-ranked companies currently included on the Featured Stocks Page. The market (M criteria) deterioration recently earned the label of a "correction" as the technical damage became significant to chart readers and leadership (stocks hitting new 52-week highs) waned. Disciplined investors limit losses and reduce market exposure during rough market periods by selling any stocks which fall more than -7% from their purchase price.
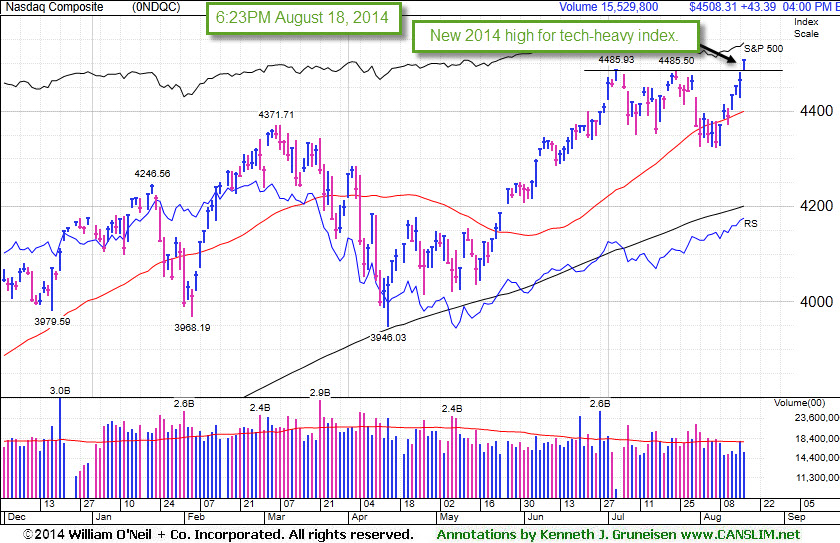 PICTURED: The tech-heavy Nasdaq Composite Index rallied to a new 2014 high with a solid gain on Monday.
Reduced concerns surrounding global conflicts and an encouraging housing report helped the market advance. Tensions eased as Ukraine and Russia discussed the possibility of a truce and U.S. airstrikes helped Iraqi forces regain control of the country's largest dam from Islamic militants.
On the economic front, a report from the NAHB showed homebuilder confidence unexpectedly increased in August to a seven-month high. In response PulteGroup (PHM +2.79%) and Lennar (LEN +1.65%) both rose.
Overall, eight of the 10 S&P 500 sectors finished higher. Industrials and technology were among the best performing groups. General Electric (GE +1.68%) rose. Index-heavyweight Apple (AAPL +1.20%) rose. Consumer discretionary stocks also staged a rally. Dollar General (DG +11.63%) jumped after offering to buy Family Dollar (FDO +4.93%) for $9.7 billion. The more defensive sectors of telecom and utilities declined. AT&T (T -0.26%) and Dominion Resources (D -0.32%) edged lower.
Treasuries pared last week's rally. The 10-year note declined 14/32 to yield 2.39%. The 30-year bond fell by more than a full point to yield 3.20%.
|
 Kenneth J. Gruneisen started out as a licensed stockbroker in August 1987, a couple of months prior to the historic stock market crash that took the Dow Jones Industrial Average down -22.6% in a single day. He has published daily fact-based fundamental and technical analysis on high-ranked stocks online for two decades. Through FACTBASEDINVESTING.COM, Kenneth provides educational articles, news, market commentary, and other information regarding proven investment systems that work in good times and bad.
Comments contained in the body of this report are technical opinions only and are not necessarily those of Gruneisen Growth Corp. The material herein has been obtained from sources believed to be reliable and accurate, however, its accuracy and completeness cannot be guaranteed. Our firm, employees, and customers may effect transactions, including transactions contrary to any recommendation herein, or have positions in the securities mentioned herein or options with respect thereto. Any recommendation contained in this report may not be suitable for all investors and it is not to be deemed an offer or solicitation on our part with respect to the purchase or sale of any securities. |
|
 |
Financial, Retail, Tech and Commodity-Linked Groups Rose
Kenneth J. Gruneisen - Passed the CAN SLIM® Master's Exam
The Broker/Dealer ($XBD +1.18%), Bank ($BKX +1.20%), and the Retail ($RLX +0.95%) were influential positive indexes boosting the major averages. The Biotech ($BTK +1.00%) and the Networking ($NWX +0.96%) indexes outpaced the Semiconductor ($SOX +0.46%) index while the tech sector had a positive bias on Monday. Commodity-linked groups had a slightly positive bias as the Gold & Silver ($XAU +0.49%), Oil Services ($OSX +0.31%) and the Integrated Oil ($XOI +0.36%) edged higher.
Charts courtesy www.stockcharts.com
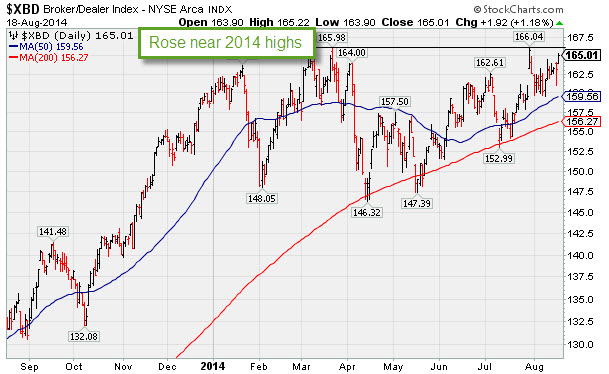
PICTURED: The Broker/Dealer index ($XBD +1.18%) rose near its 2014 highs,
| Oil Services |
$OSX |
285.42 |
+0.88 |
+0.31% |
+1.56% |
| Integrated Oil |
$XOI |
1,647.78 |
+5.83 |
+0.36% |
+9.62% |
| Semiconductor |
$SOX |
627.47 |
+2.87 |
+0.46% |
+17.28% |
| Networking |
$NWX |
324.44 |
+3.09 |
+0.96% |
+0.15% |
| Broker/Dealer |
$XBD |
165.01 |
+1.92 |
+1.18% |
+2.77% |
| Retail |
$RLX |
917.14 |
+8.67 |
+0.95% |
-2.41% |
| Gold & Silver |
$XAU |
102.47 |
+0.50 |
+0.49% |
+21.77% |
| Bank |
$BKX |
69.84 |
+0.83 |
+1.20% |
+0.84% |
| Biotech |
$BTK |
2,940.44 |
+29.24 |
+1.00% |
+26.18% |
|
|
|
 |
Relative Strength Rating Slumped While Building Longer Base
Kenneth J. Gruneisen - Passed the CAN SLIM® Master's Exam
Amtrust Financial Svcs (AFSI +$0.11 or +0.27% to $41.41) reversed into the red for a small loss on above average volume, a sign of distributional pressure near its prior highs. Its Relative Strength rating has slumped to 78, below the 80+ minimum guideline for buy candidates. It has been consolidating above its 50-day moving average (DMA) line, yet it is still facing some resistance due to overhead supply up through the $47 level. AFSI was last shown in this FSU section on 7/23/14 with detailed analysis and annotated graphs under the headline, "50-Day Moving Average Line Acted as Recent Resistance".
The number of top-rated funds owning an interest rose from 363 on Dec '14 to 376 in Jun '14, a somewhat reassuring sign concerning the I criteria. The high-ranked Insurance - Property/Casualty/Title firm reported earnings +79% on +56% sales revenues for the quarter ended Jun '14 quarter versus the year ago period, its 8th consecutive comparison above the +25% minimum earnings guideline (C criteria). It has a great annual earnings (A criteria) history and it has earned an impressive 98 Earnings Per Share rating, well above the 80+ minimum rating for buy candidates.

|
|
|
Color Codes Explained :
Y - Better candidates highlighted by our
staff of experts.
G - Previously featured
in past reports as yellow but may no longer be buyable under the
guidelines.
***Last / Change / Volume data in this table is the closing quote data***
Symbol/Exchange
Company Name
Industry Group |
PRICE |
CHANGE
(%Change) |
Day High |
Volume
(% DAV)
(% 50 day avg vol) |
52 Wk Hi
% From Hi |
Featured
Date |
Price
Featured |
Pivot Featured |
|
Max Buy |
ACT
-
NYSE
Actavis plc
Medical-Generic Drugs
|
$218.07
|
+2.64
1.23% |
$218.07
|
1,632,625
64.18% of 50 DAV
50 DAV is 2,544,000
|
$230.77
-5.50%
|
6/20/2014
|
$216.53
|
PP = $230.87
|
|
MB = $242.41
|
 Most Recent Note - 8/18/2014 7:01:15 PM
G - Inched higher today for as 5th consecutive gain on light volume, rebounding above its 50 DMA line helping its outlook to improve. Reported earnings +70% on +34% sales revenues for the Jun '14 quarter.
>>> FEATURED STOCK ARTICLE : Enduring Distributional Pressure While Sputtering Near 50-Day Average - 8/5/2014
View all notes |
Set NEW NOTE alert |
CANSLIM.net Company Profile |
SEC
News |
Chart |
Request a new note
C
A N
S L
I M


|
AFSI
-
NASDAQ
Amtrust Financial Svcs
INSURANCE - Property and; Casualty Insurance
|
$44.97
|
-0.45
-0.99% |
$45.89
|
716,186
168.28% of 50 DAV
50 DAV is 425,600
|
$47.10
-4.52%
|
5/21/2014
|
$44.85
|
PP = $44.85
|
|
MB = $47.09
|
Most Recent Note - 8/18/2014 6:58:23 PM
G - Reversed into the red after challenging its 52-week high today. Reported +79% earnings on +56% sales for the Jun '14 quarter. Facing little resistance due to overhead supply up through the $47 level. See the latest FSU analysis for more details and new annotated graphs.
>>> FEATURED STOCK ARTICLE : Relative Strength Rating Slumped While Building Longer Base - 8/18/2014
View all notes |
Set NEW NOTE alert |
CANSLIM.net Company Profile |
SEC
News |
Chart |
Request a new note
C
A N
S L
I M
|
BITA
-
NYSE
Bitauto Hldgs Ltd Ads
Internet-Content
|
$82.28
|
+3.92
5.00% |
$82.63
|
1,781,837
186.58% of 50 DAV
50 DAV is 955,000
|
$79.40
3.63%
|
6/26/2014
|
$46.20
|
PP = $47.03
|
|
MB = $49.38
|
Most Recent Note - 8/18/2014 1:24:45 PM
G - Powering to yet another new 52-week high with today's 9th consecutive gain, having the look of a "climax run" and getting more extended from its prior base. Its 50 DMA line ($53.48) defines important near-term support to watch on pullbacks.
>>> FEATURED STOCK ARTICLE : Perched at High After 3 Consecutive Volume-Driven Gains - 8/8/2014
View all notes |
Set NEW NOTE alert |
CANSLIM.net Company Profile |
SEC
News |
Chart |
Request a new note
C
A N
S L
I M
|
EQM
-
NYSE
E Q T Midstream Partners
ENERGY - Oil and Gas Pipelines
|
$91.58
|
-0.64
-0.69% |
$93.55
|
119,019
33.81% of 50 DAV
50 DAV is 352,000
|
$102.51
-10.66%
|
12/12/2013
|
$53.17
|
PP = $56.51
|
|
MB = $59.34
|
Most Recent Note - 8/18/2014 7:05:44 PM
G - Its 50 DMA line acted as a resistance level. Subsequent gains above that important short-term average are needed to help its technical stance improve. Reported earnings +37% on +21% sales revenues for the Jun '14 quarter, an improvement after 2 sub par quarterly earnings comparisons.
>>> FEATURED STOCK ARTICLE : Following 50-Day Moving Average Violation Gains Lacked Volume - 8/7/2014
View all notes |
Set NEW NOTE alert |
CANSLIM.net Company Profile |
SEC
News |
Chart |
Request a new note
C
A N
S L
I M
|
FB
-
NASDAQ
Facebook Inc Cl A
INTERNET
|
$74.59
|
+0.96
1.30% |
$74.72
|
23,904,805
57.02% of 50 DAV
50 DAV is 41,927,000
|
$76.74
-2.80%
|
7/24/2014
|
$76.00
|
PP = $72.69
|
|
MB = $76.32
|
Most Recent Note - 8/18/2014 7:06:52 PM
Y - Volume totals have generally been cooling while consolidating near its pivot point, stubbornly holding its ground after gapping up on 7/24/14. Prior highs in the $72 area define initial support above its 50 DMA line ($68.91).
>>> FEATURED STOCK ARTICLE : Breakaway Gap May Signal Beginning of Meaningful Rally - 7/24/2014
View all notes |
Set NEW NOTE alert |
CANSLIM.net Company Profile |
SEC
News |
Chart |
Request a new note
C
A N
S L
I M
|
Symbol/Exchange
Company Name
Industry Group |
PRICE |
CHANGE
(%Change) |
Day High |
Volume
(% DAV)
(% 50 day avg vol) |
52 Wk Hi
% From Hi |
Featured
Date |
Price
Featured |
Pivot Featured |
|
Max Buy |
PANW
-
NYSE
Palo Alto Networks
Computer Sftwr-Security
|
$85.58
|
+0.95
1.12% |
$86.45
|
1,137,669
76.56% of 50 DAV
50 DAV is 1,486,000
|
$87.79
-2.52%
|
7/30/2014
|
$84.21
|
PP = $85.88
|
|
MB = $90.17
|
Most Recent Note - 8/14/2014 12:54:43 PM
Y - Hit another new 52-week high with today's volume-driven gain. Volume should be at least +40% above average behind gains above a stock's pivot point during a market rally (M criteria) to trigger a proper technical buy signal. Prior session's gain on +89% above average volume approached and briefly exceeded its pivot point but it did not close above that threshold. Its 50 DMA line defines important near-term support.
>>> FEATURED STOCK ARTICLE : Building on New Base Pattern Above 50-Day Average - 8/11/2014
View all notes |
Set NEW NOTE alert |
CANSLIM.net Company Profile |
SEC
News |
Chart |
Request a new note
C
A N
S L
I M
|
TARO
-
NYSE
Taro Pharmaceutical Inds
DRUGS - Drug Manufacturers - Other
|
$154.08
|
-0.96
-0.62% |
$158.25
|
166,202
218.69% of 50 DAV
50 DAV is 76,000
|
$157.78
-2.34%
|
7/30/2014
|
$144.24
|
PP = $149.99
|
|
MB = $157.49
|
Most Recent Note - 8/18/2014 1:39:01 PM
G - Touched yet another new 52-week high with today's 8th consecutive gain. Found support at its 50 DMA line while building on its latest base pattern. Reported earnings -18% on -15% sales revenues for the Jun '14 quarter, below the +25% minimum earnings guideline (C criteria) raising fundamental concerns and its color code was changed to green.
>>> FEATURED STOCK ARTICLE : Still Building on an Advanced Base Pattern - 8/6/2014
View all notes |
Set NEW NOTE alert |
CANSLIM.net Company Profile |
SEC
News |
Chart |
Request a new note
C
A N
S L
I M
|
TRN
-
NYSE
Trinity Industries Inc
TRANSPORTATION - Railroads
|
$45.36
|
+1.28
2.90% |
$45.36
|
2,566,584
91.34% of 50 DAV
50 DAV is 2,810,000
|
$47.83
-5.16%
|
4/30/2014
|
$37.79
|
PP = $38.03
|
|
MB = $39.93
|
Most Recent Note - 8/18/2014 7:09:52 PM
Y - Rallied near its best-ever close with a gain today on higher (near average) volume. Promptly rebounded above its 50 DMA line following a brief violation, a sign of encouraging support. Reported earnings +91% on +39% sales for the Jun '14 quarter.
>>> FEATURED STOCK ARTICLE : Earnings News Due Following Tuesday's Close - 7/28/2014
View all notes |
Set NEW NOTE alert |
CANSLIM.net Company Profile |
SEC
News |
Chart |
Request a new note
C
A N
S L
I M
|
UA
-
NYSE
Under Armour Inc Cl A
CONSUMER NON-DURABLES - Textile - Apparel Clothing
|
$70.18
|
+1.34
1.95% |
$70.41
|
2,433,267
95.42% of 50 DAV
50 DAV is 2,550,000
|
$70.94
-1.07%
|
7/10/2014
|
$58.50
|
PP = $60.79
|
|
MB = $63.83
|
Most Recent Note - 8/18/2014 7:11:08 PM
G - Recently reported earnings +0% on +34% sales revenues for the Jun '14 quarter, below the +25% minimum earnings guideline (C criteria), yet the company raised its guidance. Finished at a new all-time high close today and no resistance remains due to overhead supply.
>>> FEATURED STOCK ARTICLE : Bullish Action Despite Latest Earnings Below +25% Minimum Guideline - 7/30/2014
View all notes |
Set NEW NOTE alert |
CANSLIM.net Company Profile |
SEC
News |
Chart |
Request a new note
C
A N
S L
I M
|
WLK
-
NYSE
Westlake Chemical Corp
CHEMICALS - Specialty Chemicals
|
$91.78
|
+2.61
2.93% |
$92.35
|
1,022,671
199.74% of 50 DAV
50 DAV is 512,000
|
$91.97
-0.21%
|
4/29/2014
|
$72.79
|
PP = $69.31
|
|
MB = $72.78
|
Most Recent Note - 8/18/2014 1:40:29 PM
G - Reported earnings +11% on +6% sales revenues for the Jun '14 quarter, below the +25% minimum earnings guideline (C criteria), raising fundamental concerns. Gapped up today and hit a new 52-week high. Found support at its 50 DMA line ($85.98) where a subsequent violation would raise greater concerns and trigger a technical sell signal.
>>> FEATURED STOCK ARTICLE : Extended From Prior Base After Streak of 8 Consecutive Gains - 7/25/2014
View all notes |
Set NEW NOTE alert |
CANSLIM.net Company Profile |
SEC
News |
Chart |
Request a new note
C
A N
S L
I M
|
Symbol/Exchange
Company Name
Industry Group |
PRICE |
CHANGE
(%Change) |
Day High |
Volume
(% DAV)
(% 50 day avg vol) |
52 Wk Hi
% From Hi |
Featured
Date |
Price
Featured |
Pivot Featured |
|
Max Buy |
|
|
|
THESE ARE NOT BUY RECOMMENDATIONS!
Comments contained in the body of this report are technical
opinions only. The material herein has been obtained
from sources believed to be reliable and accurate, however,
its accuracy and completeness cannot be guaranteed.
This site is not an investment advisor, hence it does
not endorse or recommend any securities or other investments.
Any recommendation contained in this report may not
be suitable for all investors and it is not to be deemed
an offer or solicitation on our part with respect to
the purchase or sale of any securities. All trademarks,
service marks and trade names appearing in this report
are the property of their respective owners, and are
likewise used for identification purposes only.
This report is a service available
only to active Paid Premium Members.
You may opt-out of receiving report notifications
at any time. Questions or comments may be submitted
by writing to Premium Membership Services 665 S.E. 10 Street, Suite 201 Deerfield Beach, FL 33441-5634 or by calling 1-800-965-8307
or 954-785-1121.
|
|
|

