You are not logged in.
This means you
CAN ONLY VIEW reports that were published prior to Monday, April 14, 2025.
You
MUST UPGRADE YOUR MEMBERSHIP if you want to see any current reports.
AFTER MARKET UPDATE - WEDNESDAY, AUGUST 18TH, 2010
Previous After Market Report Next After Market Report >>>
|
|
|
|
DOW |
+9.69 |
10,415.54 |
+0.09% |
|
Volume |
921,245,620 |
-6% |
|
Volume |
1,610,329,900 |
-6% |
|
NASDAQ |
+6.26 |
2,215.70 |
+0.28% |
|
Advancers |
1,737 |
55% |
|
Advancers |
1,320 |
48% |
|
S&P 500 |
+1.62 |
1,094.16 |
+0.15% |
|
Decliners |
1,276 |
41% |
|
Decliners |
1,302 |
47% |
|
Russell 2000 |
+1.74 |
628.04 |
+0.28% |
|
52 Wk Highs |
203 |
|
|
52 Wk Highs |
39 |
|
|
S&P 600 |
+1.30 |
335.93 |
+0.39% |
|
52 Wk Lows |
21 |
|
|
52 Wk Lows |
51 |
|
|
 |
Major Averages Inch Higher On Lighter Volume Totals
Kenneth J. Gruneisen - Passed the CAN SLIM® Master's Exam
The major averages ended slightly higher on Wednesday as investors looked past lackluster earnings and retail sales. Volume totals on were reported lower on both major exchanges versus the prior session, which was a sign that institutional investors were not aggressively buying shares. Advancers led decliners by about a 3-to-2 ratio on the NYSE while the mix was nearly even on the Nasdaq exchange. New 52-week highs outnumbered new 52-week lows on the NYSE but trailed new lows on the Nasdaq exchange. There were 26 high-ranked companies from the CANSLIM.net Leaders List made a new 52-week high and appeared on the CANSLIM.net BreakOuts Page, one more than the 25 issues that appeared on the prior session.
The major averages opened lower after retail sales and the latest round of corporate earnings failed to impress analysts' lofty expectations. Deere & Company (DE -1.86%) and Target Corporation (TGT +2.51%) ended lower which put initial pressure on equities. However, stocks rallied after speculation spread that the M&A market will heat up which is a net positive for equities and the economy. In other news, General Motors filed for its initial public offering (IPO) under the ticker symbol: GM.
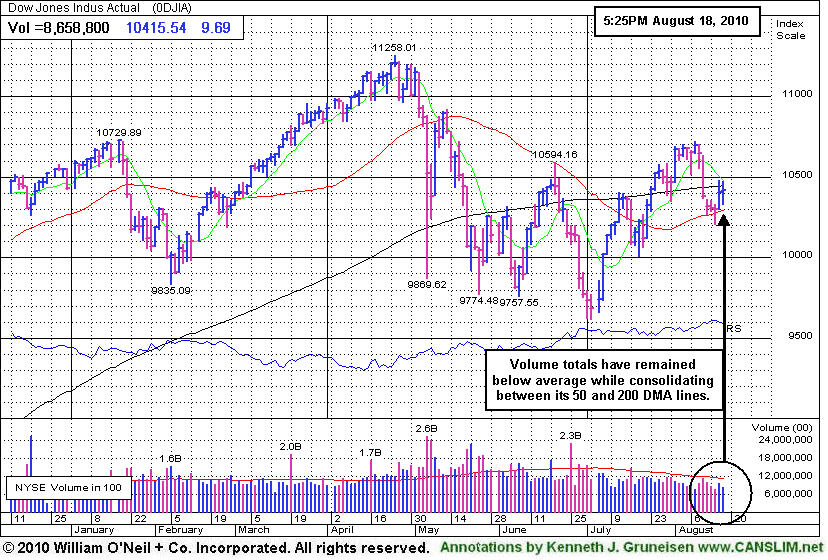
It is disconcerting to see the action in several leading stocks remain questionable at best evidenced by the dearth of high ranked leaders breaking out of sound bases. In addition, The technical action in the major averages is not ideal. Currently, resistance for the Dow Jones Industrial Average and the benchmark S&P 500 index is their respective 200 DMA lines, while the Nasdaq composite faces resistance at its 50 DMA line. Wednesday's action does not change our cautious outlook. Put simply, we can expect this sideways/choppy action to continue until the market breaks out above resistance or below support (recent chart lows). The first scenario will have bullish ramifications while the second will be clearly bearish. Trade accordingly.
Does Your Broker Follow The Rules?
Our skilled team of portfolio managers knows how to follow the rules of this fact-based investment system. We do not follow opinion or the "conviction list" of some large Wall Street institution which would have us fully invested even during horrific bear markets. Instead, we remain fluid and only buy the best stocks when they are triggering proper technical buy signals. If you are not completely satisfied with the way your portfolio is being managed, Click here to submit your inquiry. *Accounts over $250,000 please. ** Serious inquires only.
PICTURED: The Dow Jones Industrial Average is consolidating between its 50 and 200 DMA lines. Volume totals have remained below average behind all gains since its July 2nd low.
|
 Kenneth J. Gruneisen started out as a licensed stockbroker in August 1987, a couple of months prior to the historic stock market crash that took the Dow Jones Industrial Average down -22.6% in a single day. He has published daily fact-based fundamental and technical analysis on high-ranked stocks online for two decades. Through FACTBASEDINVESTING.COM, Kenneth provides educational articles, news, market commentary, and other information regarding proven investment systems that work in good times and bad.
Comments contained in the body of this report are technical opinions only and are not necessarily those of Gruneisen Growth Corp. The material herein has been obtained from sources believed to be reliable and accurate, however, its accuracy and completeness cannot be guaranteed. Our firm, employees, and customers may effect transactions, including transactions contrary to any recommendation herein, or have positions in the securities mentioned herein or options with respect thereto. Any recommendation contained in this report may not be suitable for all investors and it is not to be deemed an offer or solicitation on our part with respect to the purchase or sale of any securities. |
|
 |
Retail Index Faces Resistance Ahead
Kenneth J. Gruneisen - Passed the CAN SLIM® Master's Exam
The Semiconductor Index ($SOX +1.07%) led the tech sector and the Networking Index ($NWX +0.40%) posted a small gain while the Biotechnology Index ($BTK -0.01%) and Internet Index ($IIX -0.15%) ended flat or slightly lower. The Healthcare Index ($HMO +0.06%) was also virtually unchanged. The Retail Index ($RLX +1.65%) and Gold & Silver Index ($XAU +1.95%) posted solid gains while there were smaller gains from the influential Bank Index ($BKX +0.26%) and Broker/Dealer Index ($XBD +0.52%). Meanwhile, energy-related shares lagged as the Oil Services Index ($OSX -0.94%) and Integrated Oil Index ($XOI -0.85%) lost ground.
Charts courtesy www.stockcharts.com
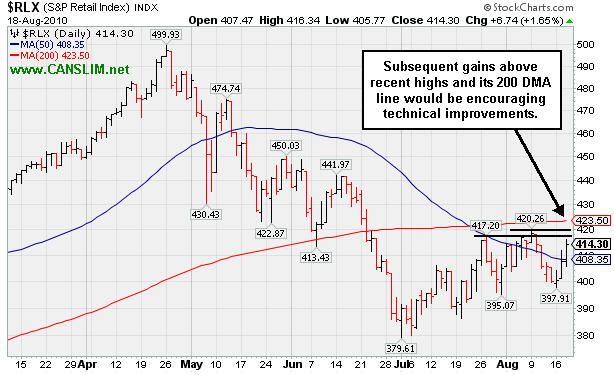
PICTURED: The Retail Index ($RLX +1.65%) is clawing its way above its 50 DMA line again. Subsequent gains above recent highs and its 200 DMA line would be more encouraging technical improvements.
| Oil Services |
$OSX |
180.63 |
-1.72 |
-0.94% |
-7.33% |
| Healthcare |
$HMO |
1,499.27 |
+0.94 |
+0.06% |
+1.79% |
| Integrated Oil |
$XOI |
977.67 |
-8.38 |
-0.85% |
-8.48% |
| Semiconductor |
$SOX |
332.10 |
+3.50 |
+1.07% |
-7.73% |
| Networking |
$NWX |
232.34 |
+0.93 |
+0.40% |
+0.55% |
| Internet |
$IIX |
246.27 |
-0.36 |
-0.15% |
+5.31% |
| Broker/Dealer |
$XBD |
105.59 |
+0.55 |
+0.52% |
-8.22% |
| Retail |
$RLX |
414.30 |
+6.74 |
+1.65% |
+0.77% |
| Gold & Silver |
$XAU |
180.84 |
+3.46 |
+1.95% |
+7.48% |
| Bank |
$BKX |
46.19 |
+0.12 |
+0.26% |
+8.15% |
| Biotech |
$BTK |
1,098.98 |
-0.08 |
-0.01% |
+16.65% |
|
|
|
 |
New High Close Helps Beverage Firm Clear Overhead Supply
Kenneth J. Gruneisen - Passed the CAN SLIM® Master's Exam
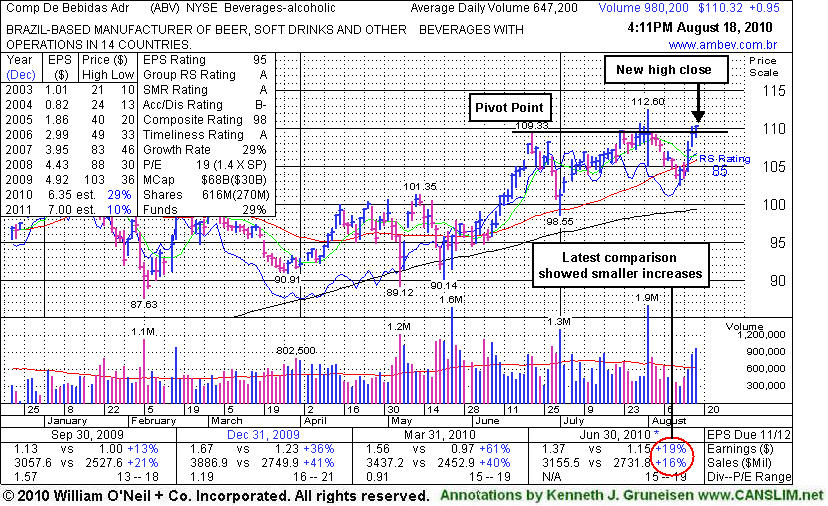
Comp De Bebidas Adr (ABV +$0.95 or +0.87% to $110.32) posted another gain with above average volume and finished at its highest ever close. It faces no resistance due to overhead supply after having impressively rebounded near its all-time high following a recent slump under its 50 DMA line. Its color code was changed to green despite its resilience, as fundamental concerns were raised after it results for the quarter ended June 30, 2010 showed +19% earnings on +16% sales revenues, below the +25% guideline. Ideal buy candidates under the fact-based system historically showed stronger increases in the latest quarter reported.
The Brazil-based beverage firm briefly hit an all-time high and churned a lot of volume on 8/02/10, however distributional pressure led it to close the session virtually unchanged and below its pivot point cited when featured in the 6/29/10 mid-day report (read here). It found impressive support near its 200 DMA line in recent months. It has a great annual earnings (A criteria) history.
|
|
|
Color Codes Explained :
Y - Better candidates highlighted by our
staff of experts.
G - Previously featured
in past reports as yellow but may no longer be buyable under the
guidelines.
***Last / Change / Volume data in this table is the closing quote data***
Symbol/Exchange
Company Name
Industry Group |
PRICE |
CHANGE
(%Change) |
Day High |
Volume
(% DAV)
(% 50 day avg vol) |
52 Wk Hi
% From Hi |
Featured
Date |
Price
Featured |
Pivot Featured |
|
Max Buy |
AAPL
-
NASDAQ
Apple Inc
COMPUTER HARDWARE - Personal Computers
|
$253.07
|
+1.10
0.44% |
$254.65
|
12,078,689
49.83% of 50 DAV
50 DAV is 24,239,200
|
$279.01
-9.30%
|
6/17/2010
|
$270.95
|
PP = $272.56
|
|
MB = $286.19
|
Most Recent Note - 8/17/2010 4:35:52 PM
G - Small gain on light volume today. Slumped below its 50 DMA line recently and raised concerns. A rally above its recent high near $266 is needed for its outlook to improve, meanwhile the recent chart low ($239) defines an important support level.
>>> The latest Featured Stock Update with an annotated graph appeared on 8/9/2010. Click here.
View all notes |
Alert me of new notes |
CANSLIM.net Company Profile |
SEC |
Zacks Reports |
StockTalk |
News |
Chart |
Request a new note
C
A N
S L
I M


|
ABV
-
NYSE
Comp De Bebidas Adr
FOOD and BEVERAGE - Beverages - Brewers
|
$110.32
|
+0.95
0.87% |
$110.44
|
988,306
152.92% of 50 DAV
50 DAV is 646,300
|
$112.60
-2.02%
|
6/29/2010
|
$104.74
|
PP = $109.33
|
|
MB = $114.80
|
 Most Recent Note - 8/18/2010 4:16:41 PM
G - This Brazil-based beverage firm ended at a new high close. Color code was changed to green despite its resilience, as fundamental concerns were raised due to the quarter ended June 30, 2010 it reported +19% earnings on +16% sales revenues, below the +25% guidelines.
>>> The latest Featured Stock Update with an annotated graph appeared on 8/18/2010. Click here.
View all notes |
Alert me of new notes |
CANSLIM.net Company Profile |
SEC |
Zacks Reports |
StockTalk |
News |
Chart |
Request a new note
C
A N
S L
I M
|
BIDU
-
NASDAQ
Baidu Inc Ads
INTERNET - Internet Information Providers
|
$82.92
|
-1.51
-1.78% |
$84.80
|
7,643,561
66.45% of 50 DAV
50 DAV is 11,503,400
|
$88.32
-6.11%
|
7/14/2010
|
$75.03
|
PP = $78.59
|
|
MB = $82.52
|
Most Recent Note - 8/17/2010 4:43:42 PM
G - Volume totals have been cooling while it consolidates above prior highs that define technical support along with its 50 DMA line.
>>> The latest Featured Stock Update with an annotated graph appeared on 8/13/2010. Click here.
View all notes |
Alert me of new notes |
CANSLIM.net Company Profile |
SEC |
Zacks Reports |
StockTalk |
News |
Chart |
Request a new note
C
A N
S L
I M
|
CACC
-
NASDAQ
Credit Acceptance Corp
FINANCIAL SERVICES - Credit Services
|
$61.23
|
+0.32
0.53% |
$61.41
|
40,823
77.02% of 50 DAV
50 DAV is 53,000
|
$61.08
0.25%
|
7/29/2010
|
$52.04
|
PP = $54.07
|
|
MB = $56.77
|
Most Recent Note - 8/18/2010 4:32:57 PM
G - Hit another new 52-week high with a gain on light volume today. Extended from its prior base, previous resistance near $54 defines initial chart support to watch.
>>> The latest Featured Stock Update with an annotated graph appeared on 8/2/2010. Click here.
View all notes |
Alert me of new notes |
CANSLIM.net Company Profile |
SEC |
Zacks Reports |
StockTalk |
News |
Chart |
Request a new note
C
A N
S L
I M
|
CRM
-
NYSE
Salesforce.Com Inc
INTERNET - Internet Software and Services
|
$99.33
|
+0.00
0.00% |
$99.89
|
1,798,962
79.27% of 50 DAV
50 DAV is 2,269,400
|
$104.44
-4.89%
|
6/2/2010
|
$88.44
|
PP = $89.60
|
|
MB = $94.08
|
Most Recent Note - 8/17/2010 4:58:32 PM
G - Gapped up today for a solid gain on average volume, rising from support near prior highs in the $97 area after nearly testing its 50 DMA line.
>>> The latest Featured Stock Update with an annotated graph appeared on 8/16/2010. Click here.
View all notes |
Alert me of new notes |
CANSLIM.net Company Profile |
SEC |
Zacks Reports |
StockTalk |
News |
Chart |
Request a new note
C
A N
S L
I M
|
Symbol/Exchange
Company Name
Industry Group |
PRICE |
CHANGE
(%Change) |
Day High |
Volume
(% DAV)
(% 50 day avg vol) |
52 Wk Hi
% From Hi |
Featured
Date |
Price
Featured |
Pivot Featured |
|
Max Buy |
FFIV
-
NASDAQ
F 5 Networks Inc
INTERNET - Internet Software and Services
|
$88.86
|
+0.95
1.08% |
$89.52
|
1,781,405
104.11% of 50 DAV
50 DAV is 1,711,000
|
$92.70
-4.14%
|
6/16/2010
|
$74.50
|
PP = $74.10
|
|
MB = $77.81
|
Most Recent Note - 8/18/2010 4:35:08 PM
G - Rebounding toward its high with gains on average volume following 2 consecutive damaging gaps down last week. Recently noted as -"extended from any sound base after recent volume-driven gains, it could go on to produce more climactic gains."
>>> The latest Featured Stock Update with an annotated graph appeared on 8/4/2010. Click here.
View all notes |
Alert me of new notes |
CANSLIM.net Company Profile |
SEC |
Zacks Reports |
StockTalk |
News |
Chart |
Request a new note
C
A N
S L
I M
|
FOSL
-
NASDAQ
Fossil Inc
CONSUMER DURABLES - Recreational Goods, Other
|
$45.00
|
+0.50
1.12% |
$45.44
|
576,524
66.47% of 50 DAV
50 DAV is 867,400
|
$46.30
-2.81%
|
8/10/2010
|
$45.54
|
PP = $42.69
|
|
MB = $44.82
|
Most Recent Note - 8/18/2010 4:45:11 PM
G - Gain with light volume today led to a close above its "max buy" level and its color code is changed to green. It has been consolidating quietly following a considerable "breakaway gap" on 8/10/10 for a new 52-week high and all-time high.
>>> The latest Featured Stock Update with an annotated graph appeared on 8/11/2010. Click here.
View all notes |
Alert me of new notes |
CANSLIM.net Company Profile |
SEC |
Zacks Reports |
StockTalk |
News |
Chart |
Request a new note
C
A N
S L
I M
|
GMCR
-
NASDAQ
Green Mtn Coffee Roastrs
FOOD and BEVERAGE - Processed and Packaged Goods
|
$32.64
|
-0.67
-2.01% |
$33.74
|
1,879,534
78.12% of 50 DAV
50 DAV is 2,406,100
|
$33.98
-3.94%
|
8/17/2010
|
$33.62
|
PP = $33.30
|
|
MB = $34.97
|
Most Recent Note - 8/18/2010 4:49:14 PM
Y - Finished near the session low today with a loss on light volume. It was featured in yellow again in the 8/17/10 mid-day report as it hit a new 52-week high, rising from a 19-week cup shaped pattern without forming a handle. It showed great resilience in rebounding from lows since it was dropped from the Featured Stocks list on 4/28/10. The number of top-rated funds owning its shares rose to 124 in Jun '10 from 111 in Mar '10. GMCR rallied more than 5-fold from its November '08 low.
>>> The latest Featured Stock Update with an annotated graph appeared on 8/17/2010. Click here.
View all notes |
Alert me of new notes |
CANSLIM.net Company Profile |
SEC |
Zacks Reports |
StockTalk |
News |
Chart |
Request a new note
C
A N
S L
I M
|
MELI
-
NASDAQ
Mercadolibre Inc
INTERNET - Internet Software and; Services
|
$69.89
|
+0.66
0.95% |
$70.25
|
679,891
65.46% of 50 DAV
50 DAV is 1,038,600
|
$70.32
-0.61%
|
5/13/2010
|
$54.21
|
PP = $55.85
|
|
MB = $58.64
|
Most Recent Note - 8/18/2010 4:52:25 PM
G - Perched at a new 52-week high after considerable gains, extended from any sound base. Prior highs in the $62 area define initial chart support.
>>> The latest Featured Stock Update with an annotated graph appeared on 7/23/2010. Click here.
View all notes |
Alert me of new notes |
CANSLIM.net Company Profile |
SEC |
Zacks Reports |
StockTalk |
News |
Chart |
Request a new note
C
A N
S L
I M
|
MRX
-
NYSE
Medicis Pharmaceut Cl A
DRUGS - Biotechnology
|
$27.19
|
+0.08
0.30% |
$27.57
|
1,005,491
90.44% of 50 DAV
50 DAV is 1,111,800
|
$28.15
-3.41%
|
8/12/2010
|
$26.88
|
PP = $26.71
|
|
MB = $28.05
|
Most Recent Note - 8/18/2010 4:53:58 PM
Y - Volume totals behind 4 consecutive gains have been below average while consolidating above prior chart highs since its 8/06/10 breakout from a sound base. The high-ranked Medical - Ethical Drugs firm was featured in the mid-day report on 8/12/10 and noted for its strong quarterly and annual earnings history.
>>> The latest Featured Stock Update with an annotated graph appeared on 8/12/2010. Click here.
View all notes |
Alert me of new notes |
CANSLIM.net Company Profile |
SEC |
Zacks Reports |
StockTalk |
News |
Chart |
Request a new note
C
A N
S L
I M
|
Symbol/Exchange
Company Name
Industry Group |
PRICE |
CHANGE
(%Change) |
Day High |
Volume
(% DAV)
(% 50 day avg vol) |
52 Wk Hi
% From Hi |
Featured
Date |
Price
Featured |
Pivot Featured |
|
Max Buy |
MWIV
-
NASDAQ
M W I Veterinary Supply
HEALTH SERVICES - Medical Instruments and; Supplies
|
$51.98
|
+1.01
1.98% |
$52.74
|
109,513
148.19% of 50 DAV
50 DAV is 73,900
|
$54.48
-4.59%
|
7/29/2010
|
$52.05
|
PP = $52.09
|
|
MB = $54.69
|
Most Recent Note - 8/18/2010 5:00:22 PM
Y - Posted gains for 3 days in a row with above average volume. Recently repaired its 50 DMA line violation and color code was changed to yellow based on its technical improvement. Recent lows in the $46 area define important chart support level.
>>> The latest Featured Stock Update with an annotated graph appeared on 7/30/2010. Click here.
View all notes |
Alert me of new notes |
CANSLIM.net Company Profile |
SEC |
Zacks Reports |
StockTalk |
News |
Chart |
Request a new note
C
A N
S L
I M
|
NEM
-
NYSE
Newmont Mining Corp
METALS and MINING - Gold
|
$59.49
|
+1.11
1.90% |
$59.86
|
6,177,541
77.06% of 50 DAV
50 DAV is 8,016,700
|
$63.38
-6.14%
|
6/22/2010
|
$59.60
|
PP = $59.67
|
|
MB = $62.65
|
Most Recent Note - 8/18/2010 5:15:09 PM
Y - Rallied further above its 50 DMA line with another light volume gain today and its color code is changed to yellow based on its resilience. Distributional action in recent weeks has been followed by no gains with average or higher volume.
>>> The latest Featured Stock Update with an annotated graph appeared on 8/6/2010. Click here.
View all notes |
Alert me of new notes |
CANSLIM.net Company Profile |
SEC |
Zacks Reports |
StockTalk |
News |
Chart |
Request a new note
C
A N
S L
I M
|
NEOG
-
NASDAQ
Neogen Corp
DRUGS - Diagnostic Substances
|
$28.15
|
-0.11
-0.39% |
$28.58
|
52,795
60.41% of 50 DAV
50 DAV is 87,400
|
$30.39
-7.37%
|
7/22/2010
|
$27.19
|
PP = $27.87
|
|
MB = $29.26
|
Most Recent Note - 8/17/2010 4:09:31 PM
G - Rising on light volume this week after halting its near its 50 DMA line and prior highs in the $27 area defining important technical support. The slump below its pivot point negated its recent breakout raising concerns, and its color code was changed to green
>>> The latest Featured Stock Update with an annotated graph appeared on 7/22/2010. Click here.
View all notes |
Alert me of new notes |
CANSLIM.net Company Profile |
SEC |
Zacks Reports |
StockTalk |
News |
Chart |
Request a new note
C
A N
S L
I M
|
NFLX
-
NASDAQ
Netflix Inc
SPECIALTY RETAIL - Music and Video Stores
|
$125.70
|
-7.27
-5.47% |
$130.15
|
8,475,598
201.25% of 50 DAV
50 DAV is 4,211,400
|
$140.90
-10.79%
|
8/10/2010
|
$124.05
|
PP = $124.00
|
|
MB = $130.20
|
Most Recent Note - 8/18/2010 5:22:21 PM
G - Gapped down and closed near its session low today following a negative reversal on the prior session after hitting an all-time high. Its prior high of $124 is now an important support level to watch.
>>> The latest Featured Stock Update with an annotated graph appeared on 8/10/2010. Click here.
View all notes |
Alert me of new notes |
CANSLIM.net Company Profile |
SEC |
Zacks Reports |
StockTalk |
News |
Chart |
Request a new note
C
A N
S L
I M
|
ROVI
-
NASDAQ
Rovi Corp
COMPUTER SOFTWARE andamp; SERVICES - Security Software andamp; Services
|
$42.41
|
-0.21
-0.49% |
$42.84
|
506,776
43.73% of 50 DAV
50 DAV is 1,158,900
|
$44.96
-5.67%
|
6/3/2010
|
$38.70
|
PP = $40.16
|
|
MB = $42.17
|
Most Recent Note - 8/17/2010 4:14:59 PM
G - Wedged back above its "max buy" level with gains on light volume this week. Color code is changed to green again. Time is needed for it to form a sound new base. Prior highs in the $40 area and its 50 DMA line define chart support.
>>> The latest Featured Stock Update with an annotated graph appeared on 7/21/2010. Click here.
View all notes |
Alert me of new notes |
CANSLIM.net Company Profile |
SEC |
Zacks Reports |
StockTalk |
News |
Chart |
Request a new note
C
A N
S L
I M
|
Symbol/Exchange
Company Name
Industry Group |
PRICE |
CHANGE
(%Change) |
Day High |
Volume
(% DAV)
(% 50 day avg vol) |
52 Wk Hi
% From Hi |
Featured
Date |
Price
Featured |
Pivot Featured |
|
Max Buy |
SHOO
-
NASDAQ
Steven Madden Limited
CONSUMER NON-DURABLES - Textile - Apparel Footwear
|
$36.87
|
+1.17
3.28% |
$37.32
|
452,914
103.55% of 50 DAV
50 DAV is 437,400
|
$40.98
-10.03%
|
8/5/2010
|
$39.55
|
PP = $41.08
|
|
MB = $43.13
|
Most Recent Note - 8/18/2010 5:35:24 PM
G - Average volume marked today's 3rd consecutive gain after it found support near its 50 DMA line. It recently retraced more than half of the depth of the previously noted cup shaped pattern.
>>> The latest Featured Stock Update with an annotated graph appeared on 8/5/2010. Click here.
View all notes |
Alert me of new notes |
CANSLIM.net Company Profile |
SEC |
Zacks Reports |
StockTalk |
News |
Chart |
Request a new note
C
A N
S L
I M
|
VIT
-
NYSE
Vanceinfo Tech Inc Ads
COMPUTER SOFTWARE and SERVICES - Business Software and Services
|
$24.99
|
-0.51
-2.00% |
$25.61
|
366,779
72.98% of 50 DAV
50 DAV is 502,600
|
$27.96
-10.62%
|
7/8/2010
|
$25.20
|
PP = $26.58
|
|
MB = $27.91
|
Most Recent Note - 8/18/2010 5:43:13 PM
G - Loss on light volume today slumping near its 50 DMA line. Distributional pressure on the prior session led to trading under its 7/29/10 low ($24.55) and its 50 DMA line.
>>> The latest Featured Stock Update with an annotated graph appeared on 7/26/2010. Click here.
View all notes |
Alert me of new notes |
CANSLIM.net Company Profile |
SEC |
Zacks Reports |
StockTalk |
News |
Chart |
Request a new note
C
A N
S L
I M
|
|
|
|
THESE ARE NOT BUY RECOMMENDATIONS!
Comments contained in the body of this report are technical
opinions only. The material herein has been obtained
from sources believed to be reliable and accurate, however,
its accuracy and completeness cannot be guaranteed.
This site is not an investment advisor, hence it does
not endorse or recommend any securities or other investments.
Any recommendation contained in this report may not
be suitable for all investors and it is not to be deemed
an offer or solicitation on our part with respect to
the purchase or sale of any securities. All trademarks,
service marks and trade names appearing in this report
are the property of their respective owners, and are
likewise used for identification purposes only.
This report is a service available
only to active Paid Premium Members.
You may opt-out of receiving report notifications
at any time. Questions or comments may be submitted
by writing to Premium Membership Services 665 S.E. 10 Street, Suite 201 Deerfield Beach, FL 33441-5634 or by calling 1-800-965-8307
or 954-785-1121.
|
|
|

