You are not logged in.
This means you
CAN ONLY VIEW reports that were published prior to Monday, April 14, 2025.
You
MUST UPGRADE YOUR MEMBERSHIP if you want to see any current reports.
AFTER MARKET UPDATE - TUESDAY, AUGUST 17TH, 2010
Previous After Market Report Next After Market Report >>>
|
|
|
|
DOW |
+103.84 |
10,405.85 |
+1.01% |
|
Volume |
980,923,050 |
+24% |
|
Volume |
1,705,268,730 |
+8% |
|
NASDAQ |
+27.57 |
2,209.44 |
+1.26% |
|
Advancers |
2,391 |
76% |
|
Advancers |
1,991 |
72% |
|
S&P 500 |
+13.16 |
1,092.54 |
+1.22% |
|
Decliners |
650 |
21% |
|
Decliners |
661 |
24% |
|
Russell 2000 |
+11.20 |
626.30 |
+1.82% |
|
52 Wk Highs |
226 |
|
|
52 Wk Highs |
44 |
|
|
S&P 600 |
+5.90 |
334.63 |
+1.79% |
|
52 Wk Lows |
17 |
|
|
52 Wk Lows |
53 |
|
|
 |
Breadth Positive While Volume Remains Below Average Behind Gains
Adam Sarhan, Contributing Writer,
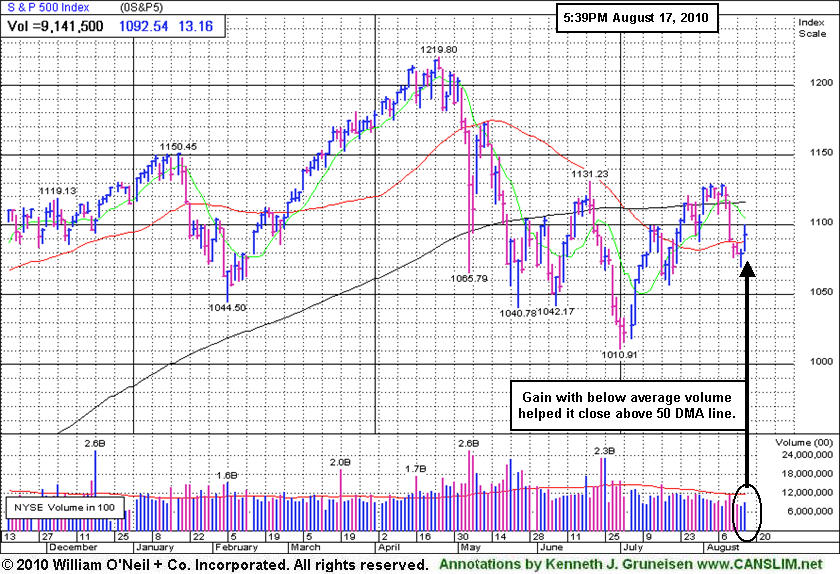
The major averages rallied on Tuesday as the latest round of earnings topped estimates and a flurry of mergers and acquisitions (M&A) were announced. Volume totals on were reported higher on both major exchanges versus the prior session, which was a sign that institutional investors were buying shares. Advancers trumped decliners by over a 3-to-1 ratio on the NYSE and Nasdaq exchange as the major averages closed in the middle of their daily range. New 52-week highs outnumbered new 52-week lows on the NYSE but trailed new lows on the Nasdaq exchange. There were 25 high-ranked companies from the CANSLIM.net Leaders List made a new 52-week high and appeared on the CANSLIM.net BreakOuts Page, up from the 11 issues that appeared on the prior session.
The market opened higher after a flurry of mergers and acquisition news was announced. The "big" news came when an Australian firm made an unsolicited takeover bid of $39 billion for Potash Corp. of Saskatchewan Inc. (POT +27.66%). Potash Corp., the world’s largest fertilizer producer, rejected the unsolicited bid from BHP Billiton Ltd. (BHP -2.40%) as too low, but the news helped lift other fertilizer firms' shares. So far, global M&A business has topped $1.22 trillion in 2010 which is +17% higher than the same time last year, according to Bloomberg. The increase in M&A business bodes well for the ongoing economic recovery.
Most European indexes rose after German investor confidence in fell more than forecast to a 16-month low. The ZEW Center for European Economic Research released a report which is designed to project six months ahead fell to to 14 in August from 21.2 in the prior month. This was much lower than the Street's forecast of 20. The market was able to shrug off the negative report when the US dollar fell (euro rallied) and the M&A news was released.
The technical action in the major averages is not ideal. Currently, resistance for the Dow Jones Industrial Average is its 200 DMA line, while the Nasdaq composite faces resistance at its 50 DMA line. The action in leading stocks remains questionable, which is a somewhat disconcerting sign. Tuesday's action does not change our cautious outlook. Put simply, we can expect this sideways/choppy action to continue until the market breaks out above resistance or below support (recent chart lows). The first scenario will have bullish ramifications while the second will be clearly bearish. Trade accordingly.
Are You Capitalizing On The Current Rally?
Our skilled team of portfolio managers knows how to follow the rules of this fact-based investment system. We do not follow opinion or the "conviction list" of some large Wall Street institution which would have us fully invested even during horrific bear markets. Instead, we remain fluid and only buy the best stocks when they are triggering proper technical buy signals. If you are not completely satisfied with the way your portfolio is being managed, Click here to submit your inquiry. *Accounts over $250,000 please. ** Serious inquires only.
PICTURED: The benchmark S&P 500 Index managed to close above its 50 DMA line but still faces resistance near its 200 DMA line (1,116) and then its prior chart highs near 1,131.
|
|
|
 |
Broker/Dealer Index Rallies At 50 DMA Line After 5 Straight Losses
Kenneth J. Gruneisen - Passed the CAN SLIM® Master's Exam
The rising Retail Index ($RLX +1.77%) and a gain from the influential Broker/Dealer Index ($XBD +1.85%) helped underpin a widespread rally on Tuesday. The tech sector produced solid gains across the board as the Networking Index ($NWX +1.68%), Biotechnology Index ($BTK +1.16%), Internet Index ($IIX +1.32%), and Semiconductor Index ($SOX +1.34%) ended unanimously higher. Commodity-linked groups also traded up as the Gold & Silver Index ($XAU +1.37%), Oil Services Index ($OSX +2.12%), and the Integrated Oil Index ($XOI +0.97%) rose. Lagging other gainers, the Bank Index ($BKX +0.37%) and Healthcare Index ($HMO +0.25%) edged higher.
Charts courtesy www.stockcharts.com
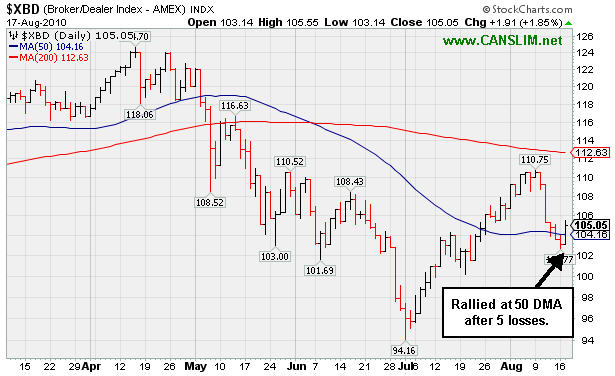
PICTURED: The Broker/Dealer Index ($XBD +1.85%) ended a 5 session losing streak and rallied at its 50-day moving average line.
| Oil Services |
$OSX |
182.35 |
+3.78 |
+2.12% |
-6.45% |
| Healthcare |
$HMO |
1,498.33 |
+3.73 |
+0.25% |
+1.72% |
| Integrated Oil |
$XOI |
986.05 |
+9.43 |
+0.97% |
-7.69% |
| Semiconductor |
$SOX |
328.60 |
+4.34 |
+1.34% |
-8.70% |
| Networking |
$NWX |
231.41 |
+3.83 |
+1.68% |
+0.15% |
| Internet |
$IIX |
246.63 |
+3.22 |
+1.32% |
+5.46% |
| Broker/Dealer |
$XBD |
105.05 |
+1.91 |
+1.85% |
-8.69% |
| Retail |
$RLX |
407.56 |
+7.10 |
+1.77% |
-0.87% |
| Gold & Silver |
$XAU |
177.38 |
+2.39 |
+1.37% |
+5.43% |
| Bank |
$BKX |
46.07 |
+0.17 |
+0.37% |
+7.87% |
| Biotech |
$BTK |
1,099.05 |
+12.64 |
+1.16% |
+16.66% |
|
|
|
 |
Former Favorite Percolates to New High Again
Kenneth J. Gruneisen - Passed the CAN SLIM® Master's Exam
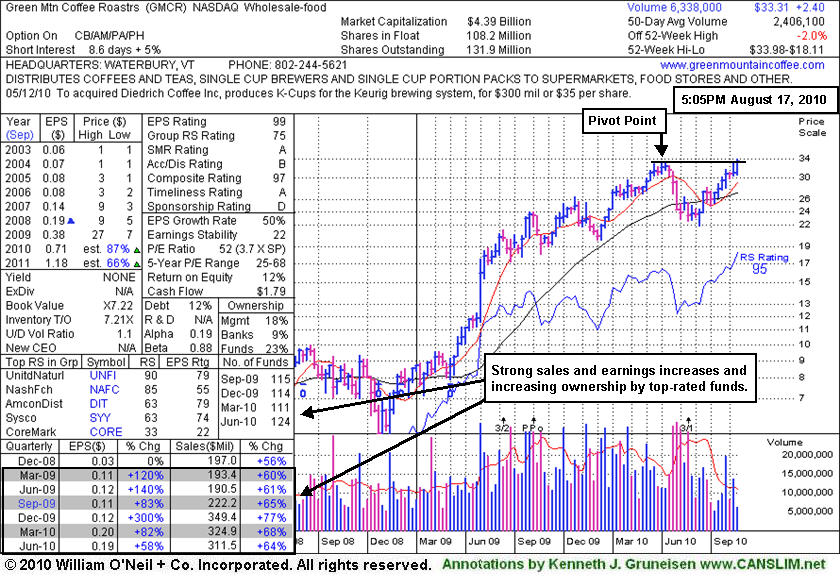
Green Mountain Coffee Roasters (GMCR +$1.03 or +3.19% to $33.31) hit a new 52-week high today with a gain backed by +67% above average volume while rising from a 19-week cup shaped pattern without forming a handle. It is now clear of resistance due to overhead supply, even though its latest base did not include the "shakeout" period. It could also stall or form a high handle, meanwhile disciplined investors might watch for more reassuring price/volume action in the near-term. The weekly datagraph below illustrates its history of strong sales revenues and earnings increases. The number of top-rated funds owning its shares rose to 124 in Jun '10 from 111 in Mar '10, helping satisfy the I criteria of the fact-based investment system.
GMCR was dropped from the Featured Stocks list on 4/28/10 and subsequently slumped below its 200-day moving average line before rebounding. Do not be confused when looking back at past reports as its share price was impacted by a 3:1 stock split effective on 5/18/10. It rallied more than 5-fold from its November '08 low. It traded up as much as +282% after appearing with an annotated graph under the headline "It May Soon Be Time To Go Green" when featured in the January 2009 CANSLIM.net News (read here).
|
|
|
Color Codes Explained :
Y - Better candidates highlighted by our
staff of experts.
G - Previously featured
in past reports as yellow but may no longer be buyable under the
guidelines.
***Last / Change / Volume data in this table is the closing quote data***
Symbol/Exchange
Company Name
Industry Group |
PRICE |
CHANGE
(%Change) |
Day High |
Volume
(% DAV)
(% 50 day avg vol) |
52 Wk Hi
% From Hi |
Featured
Date |
Price
Featured |
Pivot Featured |
|
Max Buy |
AAPL
-
NASDAQ
Apple Inc
COMPUTER HARDWARE - Personal Computers
|
$251.97
|
+4.33
1.75% |
$254.63
|
15,078,965
61.41% of 50 DAV
50 DAV is 24,553,500
|
$279.01
-9.69%
|
6/17/2010
|
$270.95
|
PP = $272.56
|
|
MB = $286.19
|
 Most Recent Note - 8/17/2010 4:35:52 PM
G - Small gain on light volume today. Slumped below its 50 DMA line recently and raised concerns. A rally above its recent high near $266 is needed for its outlook to improve, meanwhile the recent chart low ($239) defines an important support level.
>>> The latest Featured Stock Update with an annotated graph appeared on 8/9/2010. Click here.
View all notes |
Alert me of new notes |
CANSLIM.net Company Profile |
SEC |
Zacks Reports |
StockTalk |
News |
Chart |
Request a new note
C
A N
S L
I M


|
ABV
-
NYSE
Comp De Bebidas Adr
FOOD and BEVERAGE - Beverages - Brewers
|
$109.37
|
+2.19
2.04% |
$110.35
|
870,833
132.57% of 50 DAV
50 DAV is 656,900
|
$112.60
-2.87%
|
6/29/2010
|
$104.74
|
PP = $109.33
|
|
MB = $114.80
|
Most Recent Note - 8/17/2010 4:42:30 PM
G - This Brazil-based beverage firm posted a second consecutive big gain today and volume rose to slightly above average levels while it finished at its second highest close ever. It found support near its 50 DMA line recently. For the quarter ended June 30, 2010 it reported +19% earnings on +16% sales revenues, below the +25% guidelines.
>>> The latest Featured Stock Update with an annotated graph appeared on 7/20/2010. Click here.
View all notes |
Alert me of new notes |
CANSLIM.net Company Profile |
SEC |
Zacks Reports |
StockTalk |
News |
Chart |
Request a new note
C
A N
S L
I M
|
BIDU
-
NASDAQ
Baidu Inc Ads
INTERNET - Internet Information Providers
|
$84.43
|
+0.08
0.09% |
$86.05
|
7,147,765
61.95% of 50 DAV
50 DAV is 11,538,500
|
$88.32
-4.40%
|
7/14/2010
|
$75.03
|
PP = $78.59
|
|
MB = $82.52
|
Most Recent Note - 8/17/2010 4:43:42 PM
G - Volume totals have been cooling while it consolidates above prior highs that define technical support along with its 50 DMA line.
>>> The latest Featured Stock Update with an annotated graph appeared on 8/13/2010. Click here.
View all notes |
Alert me of new notes |
CANSLIM.net Company Profile |
SEC |
Zacks Reports |
StockTalk |
News |
Chart |
Request a new note
C
A N
S L
I M
|
CACC
-
NASDAQ
Credit Acceptance Corp
FINANCIAL SERVICES - Credit Services
|
$60.91
|
+1.60
2.70% |
$61.08
|
63,625
121.89% of 50 DAV
50 DAV is 52,200
|
$59.75
1.94%
|
7/29/2010
|
$52.04
|
PP = $54.07
|
|
MB = $56.77
|
Most Recent Note - 8/17/2010 12:09:02 PM
G - Stubbornly held its ground and hit a new 52-week high today. Extended from its prior base, previous resistance near $54 defines initial chart support to watch.
>>> The latest Featured Stock Update with an annotated graph appeared on 8/2/2010. Click here.
View all notes |
Alert me of new notes |
CANSLIM.net Company Profile |
SEC |
Zacks Reports |
StockTalk |
News |
Chart |
Request a new note
C
A N
S L
I M
|
CRM
-
NYSE
Salesforce.Com Inc
INTERNET - Internet Software and Services
|
$99.33
|
+2.70
2.79% |
$100.64
|
2,276,124
96.36% of 50 DAV
50 DAV is 2,362,100
|
$104.44
-4.89%
|
6/2/2010
|
$88.44
|
PP = $89.60
|
|
MB = $94.08
|
Most Recent Note - 8/17/2010 4:58:32 PM
G - Gapped up today for a solid gain on average volume, rising from support near prior highs in the $97 area after nearly testing its 50 DMA line.
>>> The latest Featured Stock Update with an annotated graph appeared on 8/16/2010. Click here.
View all notes |
Alert me of new notes |
CANSLIM.net Company Profile |
SEC |
Zacks Reports |
StockTalk |
News |
Chart |
Request a new note
C
A N
S L
I M
|
Symbol/Exchange
Company Name
Industry Group |
PRICE |
CHANGE
(%Change) |
Day High |
Volume
(% DAV)
(% 50 day avg vol) |
52 Wk Hi
% From Hi |
Featured
Date |
Price
Featured |
Pivot Featured |
|
Max Buy |
FFIV
-
NASDAQ
F 5 Networks Inc
INTERNET - Internet Software and Services
|
$87.91
|
+4.02
4.79% |
$89.77
|
2,003,538
115.74% of 50 DAV
50 DAV is 1,731,000
|
$92.70
-5.17%
|
6/16/2010
|
$74.50
|
PP = $74.10
|
|
MB = $77.81
|
Most Recent Note - 8/17/2010 10:22:29 AM
G - Rebounding with gains on lighter volume following 2 consecutive damaging gaps down last week. Recently noted as -"extended from any sound base after recent volume-driven gains, it could go on to produce more climactic gains."
>>> The latest Featured Stock Update with an annotated graph appeared on 8/4/2010. Click here.
View all notes |
Alert me of new notes |
CANSLIM.net Company Profile |
SEC |
Zacks Reports |
StockTalk |
News |
Chart |
Request a new note
C
A N
S L
I M
|
FOSL
-
NASDAQ
Fossil Inc
CONSUMER DURABLES - Recreational Goods, Other
|
$44.50
|
+0.67
1.53% |
$45.23
|
759,177
86.94% of 50 DAV
50 DAV is 873,200
|
$46.30
-3.89%
|
8/10/2010
|
$45.54
|
PP = $42.69
|
|
MB = $44.82
|
Most Recent Note - 8/17/2010 10:24:51 AM
Y - Holding its ground above prior chart highs while consolidating quietly following a considerable "breakaway gap" on 8/10/10 for a new 52-week high and all-time high.
>>> The latest Featured Stock Update with an annotated graph appeared on 8/11/2010. Click here.
View all notes |
Alert me of new notes |
CANSLIM.net Company Profile |
SEC |
Zacks Reports |
StockTalk |
News |
Chart |
Request a new note
C
A N
S L
I M
|
GMCR
-
NASDAQ
Green Mtn Coffee Roastrs
FOOD and BEVERAGE - Processed and Packaged Goods
|
$33.31
|
+1.03
3.19% |
$33.98
|
4,042,928
167.90% of 50 DAV
50 DAV is 2,407,900
|
$33.17
0.42%
|
8/17/2010
|
$33.62
|
PP = $33.30
|
|
MB = $34.97
|
Most Recent Note - 8/17/2010 12:17:14 PM
Y - Hit a new 52-week high today, rising from a 19-week cup shaped pattern without forming a handle. It was dropped from the Featured Stocks list on 4/28/10. The number of top-rated funds owning its shares rose to 124 in Jun '10 from 111 in Mar '10. GMCR rallied more than 5-fold from its November '08 low.
>>> The latest Featured Stock Update with an annotated graph appeared on 8/17/2010. Click here.
View all notes |
Alert me of new notes |
CANSLIM.net Company Profile |
SEC |
Zacks Reports |
StockTalk |
News |
Chart |
Request a new note
C
A N
S L
I M
|
MELI
-
NASDAQ
Mercadolibre Inc
INTERNET - Internet Software and; Services
|
$69.23
|
+2.23
3.33% |
$70.32
|
1,712,995
164.11% of 50 DAV
50 DAV is 1,043,800
|
$68.67
0.82%
|
5/13/2010
|
$54.21
|
PP = $55.85
|
|
MB = $58.64
|
Most Recent Note - 8/17/2010 12:28:37 PM
G - Gapped up today and hit another new 52-week high with a considerable gain backed by above average volume. Volume totals had been cooling after getting extended from any sound base. Prior highs in the $62 area define initial chart support.
>>> The latest Featured Stock Update with an annotated graph appeared on 7/23/2010. Click here.
View all notes |
Alert me of new notes |
CANSLIM.net Company Profile |
SEC |
Zacks Reports |
StockTalk |
News |
Chart |
Request a new note
C
A N
S L
I M
|
MRX
-
NYSE
Medicis Pharmaceut Cl A
DRUGS - Biotechnology
|
$27.11
|
+0.35
1.31% |
$27.33
|
1,022,701
91.16% of 50 DAV
50 DAV is 1,121,900
|
$28.15
-3.69%
|
8/12/2010
|
$26.88
|
PP = $26.71
|
|
MB = $28.05
|
Most Recent Note - 8/17/2010 4:45:58 PM
Y - Volume totals have been cooling while consolidating above prior chart highs since its 8/06/10 breakout from a sound base. The high-ranked Medical - Ethical Drugs firm was featured in the mid-day report on 8/12/10 and noted for its strong quarterly and annual earnings history.
>>> The latest Featured Stock Update with an annotated graph appeared on 8/12/2010. Click here.
View all notes |
Alert me of new notes |
CANSLIM.net Company Profile |
SEC |
Zacks Reports |
StockTalk |
News |
Chart |
Request a new note
C
A N
S L
I M
|
Symbol/Exchange
Company Name
Industry Group |
PRICE |
CHANGE
(%Change) |
Day High |
Volume
(% DAV)
(% 50 day avg vol) |
52 Wk Hi
% From Hi |
Featured
Date |
Price
Featured |
Pivot Featured |
|
Max Buy |
MWIV
-
NASDAQ
M W I Veterinary Supply
HEALTH SERVICES - Medical Instruments and; Supplies
|
$50.97
|
+1.77
3.60% |
$51.05
|
126,193
172.63% of 50 DAV
50 DAV is 73,100
|
$54.48
-6.44%
|
7/29/2010
|
$52.05
|
PP = $52.09
|
|
MB = $54.69
|
Most Recent Note - 8/17/2010 4:05:36 PM
Y - Gapped up today and rallied with higher above average volume repairing its 50 DMA line. Color code is changed to yellow based on its technical improvement. Recent lows in the $46 area define important chart support level.
>>> The latest Featured Stock Update with an annotated graph appeared on 7/30/2010. Click here.
View all notes |
Alert me of new notes |
CANSLIM.net Company Profile |
SEC |
Zacks Reports |
StockTalk |
News |
Chart |
Request a new note
C
A N
S L
I M
|
NEM
-
NYSE
Newmont Mining Corp
METALS and MINING - Gold
|
$58.38
|
+0.67
1.16% |
$58.60
|
4,968,470
61.28% of 50 DAV
50 DAV is 8,107,900
|
$63.38
-7.89%
|
6/22/2010
|
$59.60
|
PP = $59.67
|
|
MB = $62.65
|
Most Recent Note - 8/17/2010 4:07:58 PM
G - Small gain on light volume helped it close just above its 50 DMA line today. Distributional action in recent weeks has been followed by no gains with average or higher volume.
>>> The latest Featured Stock Update with an annotated graph appeared on 8/6/2010. Click here.
View all notes |
Alert me of new notes |
CANSLIM.net Company Profile |
SEC |
Zacks Reports |
StockTalk |
News |
Chart |
Request a new note
C
A N
S L
I M
|
NEOG
-
NASDAQ
Neogen Corp
DRUGS - Diagnostic Substances
|
$28.26
|
+0.46
1.65% |
$28.49
|
51,012
57.51% of 50 DAV
50 DAV is 88,700
|
$30.39
-7.01%
|
7/22/2010
|
$27.19
|
PP = $27.87
|
|
MB = $29.26
|
Most Recent Note - 8/17/2010 4:09:31 PM
G - Rising on light volume this week after halting its near its 50 DMA line and prior highs in the $27 area defining important technical support. The slump below its pivot point negated its recent breakout raising concerns, and its color code was changed to green
>>> The latest Featured Stock Update with an annotated graph appeared on 7/22/2010. Click here.
View all notes |
Alert me of new notes |
CANSLIM.net Company Profile |
SEC |
Zacks Reports |
StockTalk |
News |
Chart |
Request a new note
C
A N
S L
I M
|
NFLX
-
NASDAQ
Netflix Inc
SPECIALTY RETAIL - Music and Video Stores
|
$132.97
|
-4.25
-3.10% |
$140.88
|
8,502,331
204.80% of 50 DAV
50 DAV is 4,151,600
|
$137.90
-3.58%
|
8/10/2010
|
$124.05
|
PP = $124.00
|
|
MB = $130.20
|
Most Recent Note - 8/17/2010 4:11:48 PM
G - After gapping up and hitting another new all-time high today it reversed and closed with a loss on nearly 2 times average volume. Recently noted - "It is extended from prior highs that define important chart support now in the $124-127 area."
>>> The latest Featured Stock Update with an annotated graph appeared on 8/10/2010. Click here.
View all notes |
Alert me of new notes |
CANSLIM.net Company Profile |
SEC |
Zacks Reports |
StockTalk |
News |
Chart |
Request a new note
C
A N
S L
I M
|
ROVI
-
NASDAQ
Rovi Corp
COMPUTER SOFTWARE andamp; SERVICES - Security Software andamp; Services
|
$42.62
|
+0.56
1.33% |
$42.90
|
523,401
45.15% of 50 DAV
50 DAV is 1,159,200
|
$44.96
-5.20%
|
6/3/2010
|
$38.70
|
PP = $40.16
|
|
MB = $42.17
|
Most Recent Note - 8/17/2010 4:14:59 PM
G - Wedged back above its "max buy" level with gains on light volume this week. Color code is changed to green again. Time is needed for it to form a sound new base. Prior highs in the $40 area and its 50 DMA line define chart support.
>>> The latest Featured Stock Update with an annotated graph appeared on 7/21/2010. Click here.
View all notes |
Alert me of new notes |
CANSLIM.net Company Profile |
SEC |
Zacks Reports |
StockTalk |
News |
Chart |
Request a new note
C
A N
S L
I M
|
Symbol/Exchange
Company Name
Industry Group |
PRICE |
CHANGE
(%Change) |
Day High |
Volume
(% DAV)
(% 50 day avg vol) |
52 Wk Hi
% From Hi |
Featured
Date |
Price
Featured |
Pivot Featured |
|
Max Buy |
SHOO
-
NASDAQ
Steven Madden Limited
CONSUMER NON-DURABLES - Textile - Apparel Footwear
|
$35.70
|
+0.65
1.85% |
$36.44
|
289,593
66.15% of 50 DAV
50 DAV is 437,800
|
$40.98
-12.88%
|
8/5/2010
|
$39.55
|
PP = $41.08
|
|
MB = $43.13
|
Most Recent Note - 8/17/2010 4:28:53 PM
G - Posted a second gain on light volume after halting its slide near its 50 DMA line. Its color code was changed to green.
>>> The latest Featured Stock Update with an annotated graph appeared on 8/5/2010. Click here.
View all notes |
Alert me of new notes |
CANSLIM.net Company Profile |
SEC |
Zacks Reports |
StockTalk |
News |
Chart |
Request a new note
C
A N
S L
I M
|
VIT
-
NYSE
Vanceinfo Tech Inc Ads
COMPUTER SOFTWARE and SERVICES - Business Software and Services
|
$25.50
|
-0.71
-2.71% |
$26.00
|
2,071,614
415.57% of 50 DAV
50 DAV is 498,500
|
$27.96
-8.80%
|
7/8/2010
|
$25.20
|
PP = $26.58
|
|
MB = $27.91
|
Most Recent Note - 8/17/2010 4:33:28 PM
G - Closed in the upper half of its intra-day range today, finding prompt support after trading under its 7/29/10 low ($24.55) and its 50 DMA line. Its color code was changed to green based on early weakness following its latest earnings news.
>>> The latest Featured Stock Update with an annotated graph appeared on 7/26/2010. Click here.
View all notes |
Alert me of new notes |
CANSLIM.net Company Profile |
SEC |
Zacks Reports |
StockTalk |
News |
Chart |
Request a new note
C
A N
S L
I M
|
|
|
|
THESE ARE NOT BUY RECOMMENDATIONS!
Comments contained in the body of this report are technical
opinions only. The material herein has been obtained
from sources believed to be reliable and accurate, however,
its accuracy and completeness cannot be guaranteed.
This site is not an investment advisor, hence it does
not endorse or recommend any securities or other investments.
Any recommendation contained in this report may not
be suitable for all investors and it is not to be deemed
an offer or solicitation on our part with respect to
the purchase or sale of any securities. All trademarks,
service marks and trade names appearing in this report
are the property of their respective owners, and are
likewise used for identification purposes only.
This report is a service available
only to active Paid Premium Members.
You may opt-out of receiving report notifications
at any time. Questions or comments may be submitted
by writing to Premium Membership Services 665 S.E. 10 Street, Suite 201 Deerfield Beach, FL 33441-5634 or by calling 1-800-965-8307
or 954-785-1121.
|
|
|


