***Last / Change / Volume data in this table is the closing quote data***
Symbol/Exchange
Company Name
Industry Group |
PRICE |
CHANGE
(%Change) |
Day High |
Volume
(% DAV)
(% 50 day avg vol) |
52 Wk Hi
% From Hi |
Featured
Date |
Price
Featured |
Pivot Featured |
|
Max Buy |
ALXN
-
NASDAQ
Alexion Pharmaceuticals
DRUGS - Drug Manufacturers - Other
|
$103.61
|
-1.74
-1.65% |
$105.24
|
838,083
56.54% of 50 DAV
50 DAV is 1,482,200
|
$109.96
-5.77%
|
5/1/2012
|
$91.73
|
PP = $95.11
|
|
MB = $99.87
|
Most Recent Note - 8/15/2012 12:39:42 PM
G - Still holding its ground with volume totals cooling since last noted on 8/03/12 when it gapped up for a gain with above average volume. Chart support is defined by its 50 DMA line (now $99.55).
>>> The latest Featured Stock Update with an annotated graph appeared on 7/25/2012. Click here.
View all notes |
Alert me of new notes |
CANSLIM.net Company Profile |
SEC |
Zacks Reports |
StockTalk |
News |
Chart |
Request a new note
C
A N
S L
I M


|
ASPS
-
NASDAQ
Altisource Ptf Sltns Sa
REAL ESTATE - Property Management/Developmen
|
$89.31
|
+4.62
5.46% |
$89.49
|
263,935
209.81% of 50 DAV
50 DAV is 125,800
|
$84.97
5.11%
|
6/5/2012
|
$60.01
|
PP = $63.00
|
|
MB = $66.15
|
 Most Recent Note - 8/16/2012 12:22:54 PM
G - Hitting another new all-time high today with higher volume behind its gain. It is extended from its prior base, and its 50 DMA line defines near-term support to watch.
>>> The latest Featured Stock Update with an annotated graph appeared on 8/3/2012. Click here.
View all notes |
Alert me of new notes |
CANSLIM.net Company Profile |
SEC |
Zacks Reports |
StockTalk |
News |
Chart |
Request a new note
C
A N
S L
I M
|
CFNL
-
NASDAQ
Cardinal Financial Corp
BANKING - Regional - Southeast Banks
|
$12.57
|
+0.13
1.05% |
$12.59
|
51,642
68.95% of 50 DAV
50 DAV is 74,900
|
$13.21
-4.84%
|
7/20/2012
|
$12.85
|
PP = $12.41
|
|
MB = $13.03
|
Most Recent Note - 8/15/2012 12:47:16 PM
Y - Trading up after early weakness below its 50 DMA line. Volume totals have been cooling in recent weeks.
>>> The latest Featured Stock Update with an annotated graph appeared on 7/26/2012. Click here.
View all notes |
Alert me of new notes |
CANSLIM.net Company Profile |
SEC |
Zacks Reports |
StockTalk |
News |
Chart |
Request a new note
C
A N
S L
I M
|
CMCSA
-
NASDAQ
Comcast Corp Cl A
MEDIA - CATV Systems
|
$34.14
|
-0.05
-0.15% |
$34.39
|
10,193,018
72.90% of 50 DAV
50 DAV is 13,982,300
|
$35.16
-2.90%
|
6/11/2012
|
$29.94
|
PP = $30.98
|
|
MB = $32.53
|
Most Recent Note - 8/15/2012 4:30:37 PM
G - Edged lower with a 3rd consecutive loss on below average volume today, still trading in a tight range near its 52-week high. Recently reported earnings +19% on +6% sales revenues for the Jun '12 quarter, below the fact-based investment system's +25% minimum guideline for the C criteria. See the latest FSU analysis for more details and a new annotated graph.
>>> The latest Featured Stock Update with an annotated graph appeared on 8/15/2012. Click here.
View all notes |
Alert me of new notes |
CANSLIM.net Company Profile |
SEC |
Zacks Reports |
StockTalk |
News |
Chart |
Request a new note
C
A N
S L
I M
|
DG
-
NYSE
Dollar General Corp
RETAIL - Discount, Variety Stores
|
$51.22
|
-0.54
-1.04% |
$51.55
|
3,888,819
107.02% of 50 DAV
50 DAV is 3,633,800
|
$56.04
-8.60%
|
7/16/2012
|
$54.68
|
PP = $56.14
|
|
MB = $58.95
|
Most Recent Note - 8/16/2012 5:28:02 PM
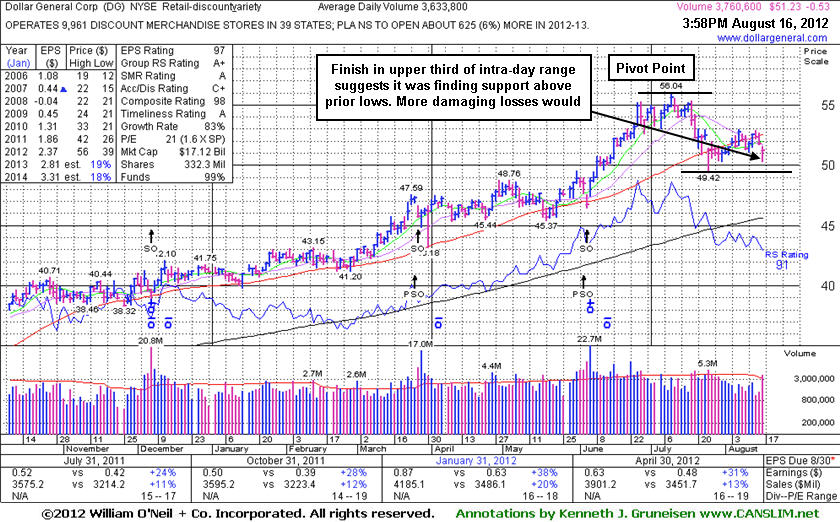
G - Finished in the upper third of its intra-day range but suffered a loss on higher volume and sank further below its 50 DMA line today. See the latest FSU analysis for more details and a new annotated graph.
>>> The latest Featured Stock Update with an annotated graph appeared on 8/16/2012. Click here.
View all notes |
Alert me of new notes |
CANSLIM.net Company Profile |
SEC |
Zacks Reports |
StockTalk |
News |
Chart |
Request a new note
C
A N
S L
I M
|
Symbol/Exchange
Company Name
Industry Group |
PRICE |
CHANGE
(%Change) |
Day High |
Volume
(% DAV)
(% 50 day avg vol) |
52 Wk Hi
% From Hi |
Featured
Date |
Price
Featured |
Pivot Featured |
|
Max Buy |
ECPG
-
NASDAQ
Encore Capital Group Inc
FINANCIAL SERVICES - Credit Services
|
$29.26
|
+1.02
3.61% |
$29.48
|
138,437
88.80% of 50 DAV
50 DAV is 155,900
|
$30.47
-3.97%
|
8/3/2012
|
$29.91
|
PP = $30.45
|
|
MB = $31.97
|
Most Recent Note - 8/16/2012 3:50:02 PM
Y - Color code is changed to yellow after rebounding above its 50 DMA line with today's gain, improving its technical stance. Completed a Secondary Offering on 8/08/12. Subsequent volume-driven gains for a close above its pivot point would trigger a technical buy signal.
>>> The latest Featured Stock Update with an annotated graph appeared on 8/6/2012. Click here.
View all notes |
Alert me of new notes |
CANSLIM.net Company Profile |
SEC |
Zacks Reports |
StockTalk |
News |
Chart |
Request a new note
C
A N
S L
I M
|
EXPE
-
NASDAQ
Expedia Inc
INTERNET - Internet Information Providers
|
$52.22
|
-0.69
-1.30% |
$52.83
|
3,297,762
86.04% of 50 DAV
50 DAV is 3,832,800
|
$59.50
-12.24%
|
4/27/2012
|
$41.80
|
PP = $35.57
|
|
MB = $37.35
|
Most Recent Note - 8/14/2012 5:55:40 PM
G - Down today for a 5th losing session in a row after its 8/08/12 gap down amid weakness in travel-related stocks after Priceline.com Inc (PCLN) and Orbitz Worldwide Inc (OWW) reported disappointing results. See the latest FSU analysis for more details and a new annotated graph.
>>> The latest Featured Stock Update with an annotated graph appeared on 8/14/2012. Click here.
View all notes |
Alert me of new notes |
CANSLIM.net Company Profile |
SEC |
Zacks Reports |
StockTalk |
News |
Chart |
Request a new note
C
A N
S L
I M
|
GNC
-
NYSE
G N C Holdings Inc
RETAIL - Drug Stores
|
$35.78
|
-1.42
-3.82% |
$36.28
|
5,936,121
219.44% of 50 DAV
50 DAV is 2,705,100
|
$42.70
-16.21%
|
6/29/2012
|
$39.20
|
PP = $40.00
|
|
MB = $42.00
|
Most Recent Note - 8/16/2012 3:47:23 PM
Gapped down today, raising more serious concerns and slumping further below its 50 DMA line. Prior lows and 200 DMA line define the next important support level to watch, meanwhile it faces resistance due to overhead supply up through the $42 area now. It will be dropped from the Featured Stocks list tonight. Recently completed a Secondary Offering of ten million shares sold by Ares Corporate Opportunities Fund II, L.P. ("Ares") and Ontario Teachers' Pension Plan Board, underwritten by Goldman, Sachs & Co. Also announced that it completed the repurchase of six million shares of its Class A common stock directly from Ares in a private, non-underwritten transaction.
>>> The latest Featured Stock Update with an annotated graph appeared on 8/8/2012. Click here.
View all notes |
Alert me of new notes |
CANSLIM.net Company Profile |
SEC |
Zacks Reports |
StockTalk |
News |
Chart |
Request a new note
C
A N
S L
I M
|
GPX
-
NYSE
G P Strategies Corp
DIVERSIFIED SERVICES - Education and Training Services
|
$19.51
|
-0.07
-0.36% |
$19.58
|
89,057
129.82% of 50 DAV
50 DAV is 68,600
|
$20.08
-2.84%
|
6/29/2012
|
$18.01
|
PP = $18.15
|
|
MB = $19.06
|
Most Recent Note - 8/13/2012 5:39:34 PM
G - Up today with above average volume, finishing -4.1% off its 52-week high. Color code is changed to green after closing back above its "max buy" level.
>>> The latest Featured Stock Update with an annotated graph appeared on 8/7/2012. Click here.
View all notes |
Alert me of new notes |
CANSLIM.net Company Profile |
SEC |
Zacks Reports |
StockTalk |
News |
Chart |
Request a new note
C
A N
S L
I M
|
HMSY
-
NASDAQ
H M S Holdings Corp
COMPUTER SOFTWARE and SERVICES - Healthcare Information Service
|
$36.21
|
-0.43
-1.16% |
$36.78
|
586,111
67.11% of 50 DAV
50 DAV is 873,400
|
$37.19
-2.65%
|
7/27/2012
|
$33.91
|
PP = $34.83
|
|
MB = $36.57
|
Most Recent Note - 8/13/2012 5:40:27 PM
Y - Hit another new 52-week high today with near average volume behind its gain. Gains above a stock's pivot point must have at least +40% above average volume, preferably greater, to trigger a proper technical buy signal.
>>> The latest Featured Stock Update with an annotated graph appeared on 7/27/2012. Click here.
View all notes |
Alert me of new notes |
CANSLIM.net Company Profile |
SEC |
Zacks Reports |
StockTalk |
News |
Chart |
Request a new note
C
A N
S L
I M
|
Symbol/Exchange
Company Name
Industry Group |
PRICE |
CHANGE
(%Change) |
Day High |
Volume
(% DAV)
(% 50 day avg vol) |
52 Wk Hi
% From Hi |
Featured
Date |
Price
Featured |
Pivot Featured |
|
Max Buy |
LKQ
-
NASDAQ
L K Q Corp
WHOLESALE - Auto Parts
|
$38.20
|
+0.45
1.19% |
$38.54
|
522,828
69.19% of 50 DAV
50 DAV is 755,600
|
$38.78
-1.50%
|
8/9/2012
|
$37.93
|
PP = $37.44
|
|
MB = $39.31
|
Most Recent Note - 8/15/2012 12:09:31 PM
Y - Small gap down today from its 52-week high after a streak of 8 consecutive gains. Prior highs in the $37 area define initial support to watch above its 50 DMA line.
>>> The latest Featured Stock Update with an annotated graph appeared on 8/10/2012. Click here.
View all notes |
Alert me of new notes |
CANSLIM.net Company Profile |
SEC |
Zacks Reports |
StockTalk |
News |
Chart |
Request a new note
C
A N
S L
I M
|
MIDD
-
NASDAQ
Middleby Corp
MANUFACTURING - Diversified Machinery
|
$116.57
|
-0.31
-0.27% |
$117.12
|
99,284
100.80% of 50 DAV
50 DAV is 98,500
|
$119.74
-2.65%
|
8/9/2012
|
$118.60
|
PP = $104.92
|
|
MB = $110.17
|
Most Recent Note - 8/14/2012 12:57:07 PM
G - Holding its ground today, extended after 3 consecutive volume-driven gains into new high territory. Prior highs define initial support to watch on pullbacks. See the latest FSU analysis for more details and a new annotated graph.
>>> The latest Featured Stock Update with an annotated graph appeared on 8/13/2012. Click here.
View all notes |
Alert me of new notes |
CANSLIM.net Company Profile |
SEC |
Zacks Reports |
StockTalk |
News |
Chart |
Request a new note
C
A N
S L
I M
|
N
-
NYSE
Netsuite Inc
DIVERSIFIED SERVICES - Business/Management Services
|
$56.51
|
+0.28
0.50% |
$56.89
|
416,222
55.99% of 50 DAV
50 DAV is 743,400
|
$59.22
-4.58%
|
6/20/2012
|
$51.83
|
PP = $51.88
|
|
MB = $54.47
|
Most Recent Note - 8/15/2012 1:12:12 PM
G - Consolidating -5.3% off its 52-week high today, holding its ground with volume totals cooling. Found support near its 50 DMA line when encountering recent distributional pressure.
>>> The latest Featured Stock Update with an annotated graph appeared on 7/19/2012. Click here.
View all notes |
Alert me of new notes |
CANSLIM.net Company Profile |
SEC |
Zacks Reports |
StockTalk |
News |
Chart |
Request a new note
C
A N
S L
I M
|
NSM
-
NYSE
Nationstar Mtg Hldgs Inc
FINANCIAL SERVICES - Credit Services
|
$28.42
|
+1.11
4.06% |
$28.53
|
621,789
74.67% of 50 DAV
50 DAV is 832,700
|
$28.03
1.39%
|
6/27/2012
|
$20.29
|
PP = $20.46
|
|
MB = $21.48
|
Most Recent Note - 8/16/2012 3:52:14 PM
G - Hitting another new 52-week high with a gain today, getting more extended from any sound base pattern. Prior highs in the $25 area define near-term support to watch on pullbacks.
>>> The latest Featured Stock Update with an annotated graph appeared on 8/1/2012. Click here.
View all notes |
Alert me of new notes |
CANSLIM.net Company Profile |
SEC |
Zacks Reports |
StockTalk |
News |
Chart |
Request a new note
C
A N
S L
I M
|
OSIS
-
NASDAQ
O S I Systems Inc
ELECTRONICS - Semiconductor Equipment and Mate
|
$73.83
|
+0.27
0.37% |
$74.30
|
114,087
97.51% of 50 DAV
50 DAV is 117,000
|
$75.00
-1.56%
|
8/9/2012
|
$67.71
|
PP = $67.48
|
|
MB = $70.85
|
Most Recent Note - 8/15/2012 12:10:30 PM
G - Hitting another new 52-week high today with another volume-driven gain, getting more extended from its prior base. Prior highs in the $67-68 area define initial support to watch on pullbacks.
>>> The latest Featured Stock Update with an annotated graph appeared on 8/9/2012. Click here.
View all notes |
Alert me of new notes |
CANSLIM.net Company Profile |
SEC |
Zacks Reports |
StockTalk |
News |
Chart |
Request a new note
C
A N
S L
I M
|
Symbol/Exchange
Company Name
Industry Group |
PRICE |
CHANGE
(%Change) |
Day High |
Volume
(% DAV)
(% 50 day avg vol) |
52 Wk Hi
% From Hi |
Featured
Date |
Price
Featured |
Pivot Featured |
|
Max Buy |
RNF
-
NYSE
Rentech Nitrogen Ptnr Lp
CHEMICALS - Agricultural Chemicals
|
$33.74
|
+0.02
0.06% |
$34.75
|
474,039
113.27% of 50 DAV
50 DAV is 418,500
|
$34.48
-2.15%
|
7/27/2012
|
$29.58
|
PP = $30.60
|
|
MB = $32.13
|
Most Recent Note - 8/15/2012 1:14:52 PM
G - Color code is changed to green after trading back up above its "max buy" level today. Encountered distributional pressure after its prior breakout, and it found support above prior highs in the $30-31 area noted as initial support to watch.
>>> The latest Featured Stock Update with an annotated graph appeared on 7/31/2012. Click here.
View all notes |
Alert me of new notes |
CANSLIM.net Company Profile |
SEC |
Zacks Reports |
StockTalk |
News |
Chart |
Request a new note
C
A N
S L
I M
|
SWI
-
NYSE
Solarwinds Inc
COMPUTER SOFTWARE and SERVICES - Application Software
|
$56.07
|
+0.31
0.56% |
$56.61
|
565,051
46.08% of 50 DAV
50 DAV is 1,226,200
|
$56.80
-1.29%
|
7/25/2012
|
$47.82
|
PP = $47.89
|
|
MB = $50.28
|
Most Recent Note - 8/15/2012 4:02:37 PM
G - Volume totals have been cooling in recent weeks while holding its ground stubbornly near its all-time high. Prior highs in the $48 area define initial support to watch on pullbacks.
>>> The latest Featured Stock Update with an annotated graph appeared on 7/30/2012. Click here.
View all notes |
Alert me of new notes |
CANSLIM.net Company Profile |
SEC |
Zacks Reports |
StockTalk |
News |
Chart |
Request a new note
C
A N
S L
I M
|
TDG
-
NYSE
Transdigm Group Inc
AEROSPACE/DEFENSE - Aerospace/Defense Products and; Services
|
$132.33
|
+3.86
3.00% |
$132.52
|
454,634
108.79% of 50 DAV
50 DAV is 417,900
|
$136.34
-2.94%
|
8/16/2012
|
$132.23
|
PP = $136.44
|
|
MB = $143.26
|
Most Recent Note - 8/16/2012 3:56:24 PM
Y - Color code is changed to yellow with new pivot point cited based on its 7/02/12 high plus 10 cents. Subsequent volume-driven gains above its point point may trigger a new (or add-on) technical buy signal. Today's 6th consecutive gain has it rallying within close striking distance of its best-ever close.
>>> The latest Featured Stock Update with an annotated graph appeared on 7/18/2012. Click here.
View all notes |
Alert me of new notes |
CANSLIM.net Company Profile |
SEC |
Zacks Reports |
StockTalk |
News |
Chart |
Request a new note
C
A N
S L
I M
|
TNGO
-
NASDAQ
Tangoe Inc
COMPUTER SOFTWARE and SERVICES - Technical and System Software
|
$20.46
|
+0.37
1.84% |
$20.56
|
253,113
59.85% of 50 DAV
50 DAV is 422,900
|
$23.05
-11.24%
|
8/9/2012
|
$21.30
|
PP = $23.10
|
|
MB = $24.26
|
Most Recent Note - 8/16/2012 3:58:12 PM
G - Rebounding near its 50 DMA line with today's gain on light volume. It still faces resistance up to the $23 level which has been a stubborn resistance area in recent months. Volume-driven gains above its pivot point are needed to trigger a proper technical buy signal.
>>> The latest Featured Stock Update with an annotated graph appeared on 7/24/2012. Click here.
View all notes |
Alert me of new notes |
CANSLIM.net Company Profile |
SEC |
Zacks Reports |
StockTalk |
News |
Chart |
Request a new note
C
A N
S L
I M
|
VSI
-
NYSE
Vitamin Shoppe Inc
SPECIALTY RETAIL - Specialty Retail, Other
|
$54.84
|
-0.71
-1.28% |
$55.71
|
699,082
182.77% of 50 DAV
50 DAV is 382,500
|
$61.83
-11.30%
|
6/29/2012
|
$54.93
|
PP = $55.03
|
|
MB = $57.78
|
Most Recent Note - 8/16/2012 3:59:11 PM
G - Down today with higher volume, trading near its 50 DMA line and upward trendline previously noted as defining near-term chart support to watch. More damaging losses would trigger technical sell signals.
>>> The latest Featured Stock Update with an annotated graph appeared on 8/2/2012. Click here.
View all notes |
Alert me of new notes |
CANSLIM.net Company Profile |
SEC |
Zacks Reports |
StockTalk |
News |
Chart |
Request a new note
C
A N
S L
I M
|
Symbol/Exchange
Company Name
Industry Group |
PRICE |
CHANGE
(%Change) |
Day High |
Volume
(% DAV)
(% 50 day avg vol) |
52 Wk Hi
% From Hi |
Featured
Date |
Price
Featured |
Pivot Featured |
|
Max Buy |