You are not logged in.
This means you
CAN ONLY VIEW reports that were published prior to Monday, April 14, 2025.
You
MUST UPGRADE YOUR MEMBERSHIP if you want to see any current reports.
AFTER MARKET UPDATE - WEDNESDAY, AUGUST 15TH, 2012
Previous After Market Report Next After Market Report >>>
|
|
|
|
DOW |
-7.36 |
13,164.78 |
-0.06% |
|
Volume |
497,825,160 |
-12% |
|
Volume |
1,485,542,960 |
-3% |
|
NASDAQ |
+13.95 |
3,030.93 |
+0.46% |
|
Advancers |
1,899 |
61% |
|
Advancers |
1,719 |
67% |
|
S&P 500 |
+1.59 |
1,405.52 |
+0.11% |
|
Decliners |
1,113 |
36% |
|
Decliners |
768 |
30% |
|
Russell 2000 |
+7.38 |
804.26 |
+0.93% |
|
52 Wk Highs |
95 |
|
|
52 Wk Highs |
57 |
|
|
S&P 600 |
+4.27 |
452.75 |
+0.95% |
|
52 Wk Lows |
16 |
|
|
52 Wk Lows |
41 |
|
|
 |
Major Averages End Mixed With Lighter Volume Totals
Kenneth J. Gruneisen - Passed the CAN SLIM® Master's Exam
The major averages traded in a narrow range on Wednesday as investors digested mixed U.S. economic reports, closing with mixed results and little net change once again. The volume totals were lighter on the NYSE and on the Nasdaq exchange versus the prior session totals. Advancing issues led decliners by a 3-2 margin on NYSE and advancers led decliners by more than a 2-1 ratio on the Nasdaq exchange. The total number of new 52-week highs led new 52-week lows on the NYSE on the Nasdaq exchange. There were 28 high-ranked companies from the CANSLIM.net Leaders List made new 52-week highs and appeared on the CANSLIM.net BreakOuts Page, down from the prior session total of 42 stocks. There were gains for 11 of the 20 high-ranked companies currently included on the Featured Stocks Page.
Looking at the latest data, homebuilder sentiment and industrial output topped expectations, while manufacturing activity in the New York region unexpectedly showed a contraction. Seven of the 10 sectors on the S&P ended higher, led by gains in consumer stocks.
Shares of Target Corp (TGT +1.77%) rallied after the company increased their full-year earnings guidance. Abercrombie & Fitch Co (ANF +8.97%) rallied for a considerable gain following their better-than-expected profit tally. On the downside, Deere & Co (DE -6.28%) and Staples Inc (SPLS -14.60%) sank after both companies fell short of analysts' expectations in the quarter.
Turning to fixed income, Treasuries continued to move lower along the curve. The benchmark 10-year note was down 5/8 of a point to yield 1.81% and the 30-year bond fell over a point and a half to yield 2.91%.
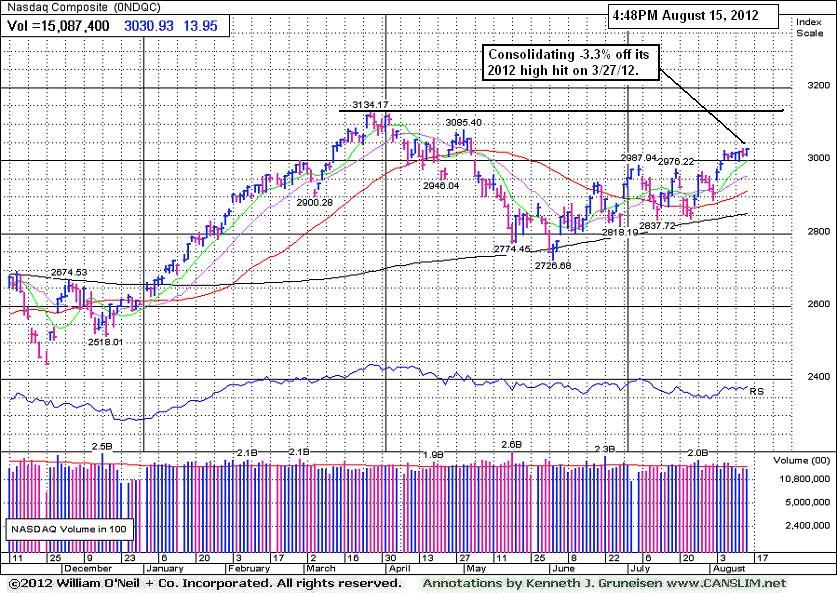
The major averages are perched within close striking distance their 2012 high. In terms of the M criteria, the major indices recently have been in a confirmed rally coupled with an expansion in leadership (stocks hitting new 52-week highs).
Watch for an announcement soon via email concerning new monthly webcasts starting in August and a new "Market's Leading Groups" archives tab to be added on the Premium Member Homepage. These changes are aimed at satisfying member requests and improving the service. If you have questions, comments or suggestions please let us know via the inquiry form here. The most recent WEBCAST (Q2 2012) is available "ON DEMAND" - CLICK HERE.
PICTURED: The Nasdaq Composite Index finished -3.3% off its 2012 high hit March 27, 2012.
|
 Kenneth J. Gruneisen started out as a licensed stockbroker in August 1987, a couple of months prior to the historic stock market crash that took the Dow Jones Industrial Average down -22.6% in a single day. He has published daily fact-based fundamental and technical analysis on high-ranked stocks online for two decades. Through FACTBASEDINVESTING.COM, Kenneth provides educational articles, news, market commentary, and other information regarding proven investment systems that work in good times and bad.
Comments contained in the body of this report are technical opinions only and are not necessarily those of Gruneisen Growth Corp. The material herein has been obtained from sources believed to be reliable and accurate, however, its accuracy and completeness cannot be guaranteed. Our firm, employees, and customers may effect transactions, including transactions contrary to any recommendation herein, or have positions in the securities mentioned herein or options with respect thereto. Any recommendation contained in this report may not be suitable for all investors and it is not to be deemed an offer or solicitation on our part with respect to the purchase or sale of any securities. |
|
 |
Retail, Bank, Healthcare, and Tech Groups Led Gainers
Kenneth J. Gruneisen - Passed the CAN SLIM® Master's Exam
Energy-related shares edged lower and the Integrated Oil Index ($XOI -0.22%) and Oil Services Index ($OSX -0.18%) ended with small losses. Modest gains from the Bank Index ($BKX +0.41%) and Retail Index ($RLX +0.72%) were a positive influence on the major averages while the Broker/Dealer Index ($XBD -0.06%) finished flat. The Healthcare Index ($HMO +1.81%) was a standout gainer, and the Gold & Silver Index ($XAU +0.41%) also posted a modest gain. The Semiconductor Index ($SOX +0.59%) ended the session with a small gain while the tech sector saw larger gains from the Internet Index ($IIX +0.98%), Networking Index ($NWX +1.25%), and the Biotechnology Index ($BTK +1.35%).
Charts courtesy www.stockcharts.com

PICTURED: The Retail Index ($RLX +0.72%) is consolidating above its 50-day moving average (DMA) line. Healthy action in the retail index bodes well for high-ranked individual leaders in the retail group.
| Oil Services |
$OSX |
225.13 |
-0.41 |
-0.18% |
+4.09% |
| Healthcare |
$HMO |
2,306.92 |
+40.93 |
+1.81% |
+1.11% |
| Integrated Oil |
$XOI |
1,234.27 |
-2.74 |
-0.22% |
+0.42% |
| Semiconductor |
$SOX |
401.48 |
+2.36 |
+0.59% |
+10.16% |
| Networking |
$NWX |
207.30 |
+2.55 |
+1.25% |
-3.65% |
| Internet |
$IIX |
311.75 |
+3.03 |
+0.98% |
+10.65% |
| Broker/Dealer |
$XBD |
80.10 |
-0.04 |
-0.06% |
-3.81% |
| Retail |
$RLX |
632.19 |
+4.53 |
+0.72% |
+20.83% |
| Gold & Silver |
$XAU |
155.62 |
+0.63 |
+0.41% |
-13.85% |
| Bank |
$BKX |
46.73 |
+0.19 |
+0.41% |
+18.66% |
| Biotech |
$BTK |
1,462.76 |
+19.42 |
+1.35% |
+34.02% |
|
|
|
 |
Decelerating Sales and Earnings Growth a Concern Following Sub Par Quarter
Kenneth J. Gruneisen - Passed the CAN SLIM® Master's Exam
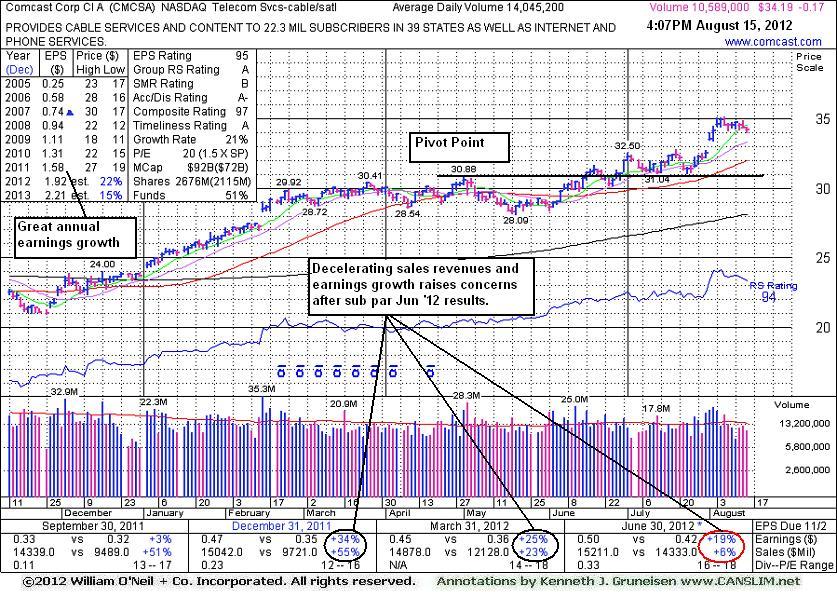
Comcast Corp Cl A (CMCSA -$0.17 or -0.48% to $34.19) is hovering in a tight range near its 52-week high. It recently reported earnings +19% on +6% sales revenues for the Jun '12 quarter, below the fact-based investment system's +25% minimum guideline for the C criteria. Buy candidates' earnings increases should be above the +25% guideline (C criteria) in 3 of the past 4 comparisons and, most ideally, they show signs of recent acceleration. In this case, decelerating sales revenues and earnings increases in the recent sequential quarters is cause for concern, fundamentally. However, its annual earnings (A criteria) history has been strong and leadership from other firms in the Telecom Services - Cable/Satellite industry group is a reassuring sign concerning the L criteria.
Its last appearance in this FSU section with an annotated daily graph was on 7/11/12 under the headline, "Healthy Action Following Latest Breakout". It went on consolidating above prior highs and stayed well above its 50-day moving average (DMA) line in the weeks that followed, then it surged to new highs with volume-driven gains including a gap up on 8/01/12. The number of top-rated funds owning its shares rose from 1,916 in Jun '11 to 2,093 in Jun '12, a reassuring sign concerning the I criteria. Its huge supply of 2.093 billion shares in the float could make it less likely to be a great sprinter, meanwhile, the S criteria calls for investors to usually look at small-cap or mid-cap companies.
|
|
|
Color Codes Explained :
Y - Better candidates highlighted by our
staff of experts.
G - Previously featured
in past reports as yellow but may no longer be buyable under the
guidelines.
***Last / Change / Volume data in this table is the closing quote data***
Symbol/Exchange
Company Name
Industry Group |
PRICE |
CHANGE
(%Change) |
Day High |
Volume
(% DAV)
(% 50 day avg vol) |
52 Wk Hi
% From Hi |
Featured
Date |
Price
Featured |
Pivot Featured |
|
Max Buy |
ALXN
-
NASDAQ
Alexion Pharmaceuticals
DRUGS - Drug Manufacturers - Other
|
$105.35
|
+1.32
1.27% |
$105.59
|
681,799
45.67% of 50 DAV
50 DAV is 1,492,800
|
$109.96
-4.19%
|
5/1/2012
|
$91.73
|
PP = $95.11
|
|
MB = $99.87
|
 Most Recent Note - 8/15/2012 12:39:42 PM
G - Still holding its ground with volume totals cooling since last noted on 8/03/12 when it gapped up for a gain with above average volume. Chart support is defined by its 50 DMA line (now $99.55).
>>> The latest Featured Stock Update with an annotated graph appeared on 7/25/2012. Click here.
View all notes |
Alert me of new notes |
CANSLIM.net Company Profile |
SEC |
Zacks Reports |
StockTalk |
News |
Chart |
Request a new note
C
A N
S L
I M


|
ASPS
-
NASDAQ
Altisource Ptf Sltns Sa
REAL ESTATE - Property Management/Developmen
|
$84.69
|
+0.25
0.30% |
$84.97
|
119,218
91.64% of 50 DAV
50 DAV is 130,100
|
$84.93
-0.28%
|
6/5/2012
|
$60.01
|
PP = $63.00
|
|
MB = $66.15
|
Most Recent Note - 8/15/2012 12:44:54 PM
G - Perched at its all-time high with quiet volume totals suggesting that only few are exiting. It is extended from its prior base, and its 50 DMA line defines near-term support to watch.
>>> The latest Featured Stock Update with an annotated graph appeared on 8/3/2012. Click here.
View all notes |
Alert me of new notes |
CANSLIM.net Company Profile |
SEC |
Zacks Reports |
StockTalk |
News |
Chart |
Request a new note
C
A N
S L
I M
|
CFNL
-
NASDAQ
Cardinal Financial Corp
BANKING - Regional - Southeast Banks
|
$12.44
|
+0.10
0.81% |
$12.46
|
35,211
46.21% of 50 DAV
50 DAV is 76,200
|
$13.21
-5.83%
|
7/20/2012
|
$12.85
|
PP = $12.41
|
|
MB = $13.03
|
Most Recent Note - 8/15/2012 12:47:16 PM
Y - Trading up after early weakness below its 50 DMA line. Volume totals have been cooling in recent weeks.
>>> The latest Featured Stock Update with an annotated graph appeared on 7/26/2012. Click here.
View all notes |
Alert me of new notes |
CANSLIM.net Company Profile |
SEC |
Zacks Reports |
StockTalk |
News |
Chart |
Request a new note
C
A N
S L
I M
|
CMCSA
-
NASDAQ
Comcast Corp Cl A
MEDIA - CATV Systems
|
$34.19
|
-0.17
-0.48% |
$34.42
|
10,610,141
75.54% of 50 DAV
50 DAV is 14,045,200
|
$35.16
-2.76%
|
6/11/2012
|
$29.94
|
PP = $30.98
|
|
MB = $32.53
|
Most Recent Note - 8/15/2012 4:30:37 PM
G - Edged lower with a 3rd consecutive loss on below average volume today, still trading in a tight range near its 52-week high. Recently reported earnings +19% on +6% sales revenues for the Jun '12 quarter, below the fact-based investment system's +25% minimum guideline for the C criteria. See the latest FSU analysis for more details and a new annotated graph.
>>> The latest Featured Stock Update with an annotated graph appeared on 8/15/2012. Click here.
View all notes |
Alert me of new notes |
CANSLIM.net Company Profile |
SEC |
Zacks Reports |
StockTalk |
News |
Chart |
Request a new note
C
A N
S L
I M
|
DG
-
NYSE
Dollar General Corp
RETAIL - Discount, Variety Stores
|
$51.76
|
-0.55
-1.05% |
$52.65
|
1,335,705
35.35% of 50 DAV
50 DAV is 3,778,500
|
$56.04
-7.64%
|
7/16/2012
|
$54.68
|
PP = $56.14
|
|
MB = $58.95
|
Most Recent Note - 8/14/2012 6:01:47 PM
G - Still consolidating near its 50 DMA line with volume totals cooling in recent weeks after encountering distributional pressure. Prior lows near $49 define important near-term support to watch while it may be forming a new base.
>>> The latest Featured Stock Update with an annotated graph appeared on 7/12/2012. Click here.
View all notes |
Alert me of new notes |
CANSLIM.net Company Profile |
SEC |
Zacks Reports |
StockTalk |
News |
Chart |
Request a new note
C
A N
S L
I M
|
Symbol/Exchange
Company Name
Industry Group |
PRICE |
CHANGE
(%Change) |
Day High |
Volume
(% DAV)
(% 50 day avg vol) |
52 Wk Hi
% From Hi |
Featured
Date |
Price
Featured |
Pivot Featured |
|
Max Buy |
ECPG
-
NASDAQ
Encore Capital Group Inc
FINANCIAL SERVICES - Credit Services
|
$28.24
|
-0.10
-0.35% |
$28.49
|
93,338
59.99% of 50 DAV
50 DAV is 155,600
|
$30.47
-7.32%
|
8/3/2012
|
$29.91
|
PP = $30.45
|
|
MB = $31.97
|
Most Recent Note - 8/15/2012 12:52:55 PM
G - Color code is changed to green. Completed a Secondary Offering on 8/08/12 and it is consolidating just below its 50 DMA line. A rebound above its 50 DMA line would help its technical stance and outlook improve, and a volume-driven gain and close above its pivot point would trigger a technical buy signal.
>>> The latest Featured Stock Update with an annotated graph appeared on 8/6/2012. Click here.
View all notes |
Alert me of new notes |
CANSLIM.net Company Profile |
SEC |
Zacks Reports |
StockTalk |
News |
Chart |
Request a new note
C
A N
S L
I M
|
EXPE
-
NASDAQ
Expedia Inc
INTERNET - Internet Information Providers
|
$52.91
|
+0.60
1.15% |
$53.36
|
2,329,808
60.65% of 50 DAV
50 DAV is 3,841,300
|
$59.50
-11.08%
|
4/27/2012
|
$41.80
|
PP = $35.57
|
|
MB = $37.35
|
Most Recent Note - 8/14/2012 5:55:40 PM
G - Down today for a 5th losing session in a row after its 8/08/12 gap down amid weakness in travel-related stocks after Priceline.com Inc (PCLN) and Orbitz Worldwide Inc (OWW) reported disappointing results. See the latest FSU analysis for more details and a new annotated graph.
>>> The latest Featured Stock Update with an annotated graph appeared on 8/14/2012. Click here.
View all notes |
Alert me of new notes |
CANSLIM.net Company Profile |
SEC |
Zacks Reports |
StockTalk |
News |
Chart |
Request a new note
C
A N
S L
I M
|
GNC
-
NYSE
G N C Holdings Inc
RETAIL - Drug Stores
|
$37.20
|
-1.38
-3.58% |
$38.95
|
4,075,356
153.78% of 50 DAV
50 DAV is 2,650,100
|
$42.70
-12.88%
|
6/29/2012
|
$39.20
|
PP = $40.00
|
|
MB = $42.00
|
Most Recent Note - 8/15/2012 1:10:40 PM
G - Down today and slumping below its 50 DMA line again. Prior lows and its 200 DMA line define the next chart support level. Completed a Secondary Offering of ten million shares sold by Ares Corporate Opportunities Fund II, L.P. ("Ares") and Ontario Teachers' Pension Plan Board, underwritten by Goldman, Sachs & Co. Also announced that it completed the repurchase of six million shares of its Class A common stock directly from Ares in a private, non-underwritten transaction.
>>> The latest Featured Stock Update with an annotated graph appeared on 8/8/2012. Click here.
View all notes |
Alert me of new notes |
CANSLIM.net Company Profile |
SEC |
Zacks Reports |
StockTalk |
News |
Chart |
Request a new note
C
A N
S L
I M
|
GPX
-
NYSE
G P Strategies Corp
DIVERSIFIED SERVICES - Education and Training Services
|
$19.58
|
+0.09
0.46% |
$19.73
|
65,309
96.18% of 50 DAV
50 DAV is 67,900
|
$20.08
-2.49%
|
6/29/2012
|
$18.01
|
PP = $18.15
|
|
MB = $19.06
|
Most Recent Note - 8/13/2012 5:39:34 PM
G - Up today with above average volume, finishing -4.1% off its 52-week high. Color code is changed to green after closing back above its "max buy" level.
>>> The latest Featured Stock Update with an annotated graph appeared on 8/7/2012. Click here.
View all notes |
Alert me of new notes |
CANSLIM.net Company Profile |
SEC |
Zacks Reports |
StockTalk |
News |
Chart |
Request a new note
C
A N
S L
I M
|
HMSY
-
NASDAQ
H M S Holdings Corp
COMPUTER SOFTWARE and SERVICES - Healthcare Information Service
|
$36.63
|
-0.08
-0.22% |
$37.19
|
478,242
53.95% of 50 DAV
50 DAV is 886,500
|
$37.10
-1.27%
|
7/27/2012
|
$33.91
|
PP = $34.83
|
|
MB = $36.57
|
Most Recent Note - 8/13/2012 5:40:27 PM
Y - Hit another new 52-week high today with near average volume behind its gain. Gains above a stock's pivot point must have at least +40% above average volume, preferably greater, to trigger a proper technical buy signal.
>>> The latest Featured Stock Update with an annotated graph appeared on 7/27/2012. Click here.
View all notes |
Alert me of new notes |
CANSLIM.net Company Profile |
SEC |
Zacks Reports |
StockTalk |
News |
Chart |
Request a new note
C
A N
S L
I M
|
Symbol/Exchange
Company Name
Industry Group |
PRICE |
CHANGE
(%Change) |
Day High |
Volume
(% DAV)
(% 50 day avg vol) |
52 Wk Hi
% From Hi |
Featured
Date |
Price
Featured |
Pivot Featured |
|
Max Buy |
LKQ
-
NASDAQ
L K Q Corp
WHOLESALE - Auto Parts
|
$37.75
|
-0.86
-2.23% |
$37.97
|
999,679
133.93% of 50 DAV
50 DAV is 746,400
|
$38.78
-2.66%
|
8/9/2012
|
$37.93
|
PP = $37.44
|
|
MB = $39.31
|
Most Recent Note - 8/15/2012 12:09:31 PM
Y - Small gap down today from its 52-week high after a streak of 8 consecutive gains. Prior highs in the $37 area define initial support to watch above its 50 DMA line.
>>> The latest Featured Stock Update with an annotated graph appeared on 8/10/2012. Click here.
View all notes |
Alert me of new notes |
CANSLIM.net Company Profile |
SEC |
Zacks Reports |
StockTalk |
News |
Chart |
Request a new note
C
A N
S L
I M
|
MIDD
-
NASDAQ
Middleby Corp
MANUFACTURING - Diversified Machinery
|
$116.88
|
+1.97
1.71% |
$116.98
|
72,399
72.98% of 50 DAV
50 DAV is 99,200
|
$119.74
-2.39%
|
8/9/2012
|
$118.60
|
PP = $104.92
|
|
MB = $110.17
|
Most Recent Note - 8/14/2012 12:57:07 PM
G - Holding its ground today, extended after 3 consecutive volume-driven gains into new high territory. Prior highs define initial support to watch on pullbacks. See the latest FSU analysis for more details and a new annotated graph.
>>> The latest Featured Stock Update with an annotated graph appeared on 8/13/2012. Click here.
View all notes |
Alert me of new notes |
CANSLIM.net Company Profile |
SEC |
Zacks Reports |
StockTalk |
News |
Chart |
Request a new note
C
A N
S L
I M
|
N
-
NYSE
Netsuite Inc
DIVERSIFIED SERVICES - Business/Management Services
|
$56.23
|
+0.18
0.32% |
$56.72
|
332,014
44.67% of 50 DAV
50 DAV is 743,300
|
$59.22
-5.05%
|
6/20/2012
|
$51.83
|
PP = $51.88
|
|
MB = $54.47
|
Most Recent Note - 8/15/2012 1:12:12 PM
G - Consolidating -5.3% off its 52-week high today, holding its ground with volume totals cooling. Found support near its 50 DMA line when encountering recent distributional pressure.
>>> The latest Featured Stock Update with an annotated graph appeared on 7/19/2012. Click here.
View all notes |
Alert me of new notes |
CANSLIM.net Company Profile |
SEC |
Zacks Reports |
StockTalk |
News |
Chart |
Request a new note
C
A N
S L
I M
|
NSM
-
NYSE
Nationstar Mtg Hldgs Inc
FINANCIAL SERVICES - Credit Services
|
$27.31
|
-0.29
-1.05% |
$27.63
|
439,907
52.30% of 50 DAV
50 DAV is 841,200
|
$28.03
-2.57%
|
6/27/2012
|
$20.29
|
PP = $20.46
|
|
MB = $21.48
|
Most Recent Note - 8/14/2012 1:00:03 PM
G - Hit a new 52-week high today with a considerable volume-driven gain, getting more extended from any sound base pattern. Reported earnings of 41 cents per share versus 2 cents per share on +143% sales revenues for the Jun '12 quarter versus the year ago period.
>>> The latest Featured Stock Update with an annotated graph appeared on 8/1/2012. Click here.
View all notes |
Alert me of new notes |
CANSLIM.net Company Profile |
SEC |
Zacks Reports |
StockTalk |
News |
Chart |
Request a new note
C
A N
S L
I M
|
OSIS
-
NASDAQ
O S I Systems Inc
ELECTRONICS - Semiconductor Equipment and Mate
|
$73.56
|
+1.49
2.07% |
$75.00
|
294,420
256.91% of 50 DAV
50 DAV is 114,600
|
$74.28
-0.97%
|
8/9/2012
|
$67.71
|
PP = $67.48
|
|
MB = $70.85
|
Most Recent Note - 8/15/2012 12:10:30 PM
G - Hitting another new 52-week high today with another volume-driven gain, getting more extended from its prior base. Prior highs in the $67-68 area define initial support to watch on pullbacks.
>>> The latest Featured Stock Update with an annotated graph appeared on 8/9/2012. Click here.
View all notes |
Alert me of new notes |
CANSLIM.net Company Profile |
SEC |
Zacks Reports |
StockTalk |
News |
Chart |
Request a new note
C
A N
S L
I M
|
Symbol/Exchange
Company Name
Industry Group |
PRICE |
CHANGE
(%Change) |
Day High |
Volume
(% DAV)
(% 50 day avg vol) |
52 Wk Hi
% From Hi |
Featured
Date |
Price
Featured |
Pivot Featured |
|
Max Buy |
RNF
-
NYSE
Rentech Nitrogen Ptnr Lp
CHEMICALS - Agricultural Chemicals
|
$33.72
|
+1.91
6.00% |
$33.93
|
550,396
132.31% of 50 DAV
50 DAV is 416,000
|
$34.48
-2.20%
|
7/27/2012
|
$29.58
|
PP = $30.60
|
|
MB = $32.13
|
Most Recent Note - 8/15/2012 1:14:52 PM
G - Color code is changed to green after trading back up above its "max buy" level today. Encountered distributional pressure after its prior breakout, and it found support above prior highs in the $30-31 area noted as initial support to watch.
>>> The latest Featured Stock Update with an annotated graph appeared on 7/31/2012. Click here.
View all notes |
Alert me of new notes |
CANSLIM.net Company Profile |
SEC |
Zacks Reports |
StockTalk |
News |
Chart |
Request a new note
C
A N
S L
I M
|
SWI
-
NYSE
Solarwinds Inc
COMPUTER SOFTWARE and SERVICES - Application Software
|
$55.76
|
+1.22
2.24% |
$55.91
|
543,637
44.03% of 50 DAV
50 DAV is 1,234,700
|
$56.80
-1.83%
|
7/25/2012
|
$47.82
|
PP = $47.89
|
|
MB = $50.28
|
Most Recent Note - 8/15/2012 4:02:37 PM
G - Volume totals have been cooling in recent weeks while holding its ground stubbornly near its all-time high. Prior highs in the $48 area define initial support to watch on pullbacks.
>>> The latest Featured Stock Update with an annotated graph appeared on 7/30/2012. Click here.
View all notes |
Alert me of new notes |
CANSLIM.net Company Profile |
SEC |
Zacks Reports |
StockTalk |
News |
Chart |
Request a new note
C
A N
S L
I M
|
TDG
-
NYSE
Transdigm Group Inc
AEROSPACE/DEFENSE - Aerospace/Defense Products and; Services
|
$128.47
|
+0.62
0.48% |
$128.58
|
253,807
60.06% of 50 DAV
50 DAV is 422,600
|
$136.34
-5.77%
|
6/18/2012
|
$127.00
|
PP = $132.79
|
|
MB = $139.43
|
Most Recent Note - 8/14/2012 6:03:36 PM
G - Inching above its 50 DMA line with light volume behind today's 4th consecutive gain. Recent lows in the $117-118 are define near-term support above its 200 DMA line.
>>> The latest Featured Stock Update with an annotated graph appeared on 7/18/2012. Click here.
View all notes |
Alert me of new notes |
CANSLIM.net Company Profile |
SEC |
Zacks Reports |
StockTalk |
News |
Chart |
Request a new note
C
A N
S L
I M
|
TNGO
-
NASDAQ
Tangoe Inc
COMPUTER SOFTWARE and SERVICES - Technical and System Software
|
$20.09
|
-0.95
-4.52% |
$20.95
|
216,908
50.26% of 50 DAV
50 DAV is 431,600
|
$23.05
-12.84%
|
8/9/2012
|
$21.30
|
PP = $23.10
|
|
MB = $24.26
|
Most Recent Note - 8/15/2012 12:57:20 PM
G - Loss today has it slumping under its 50 DMA line hurting its technical stance and its color code is changed to green. Reported earnings +67% on +39% sales revenues for the Jun '12 quarter. Pivot point cited is based on its 6/26/12 high plus 10 cents, and it still faces resistance up to the $23 level which has been a stubborn resistance area in recent months. Volume-driven gains above its pivot point are needed to trigger a proper technical buy signal.
>>> The latest Featured Stock Update with an annotated graph appeared on 7/24/2012. Click here.
View all notes |
Alert me of new notes |
CANSLIM.net Company Profile |
SEC |
Zacks Reports |
StockTalk |
News |
Chart |
Request a new note
C
A N
S L
I M
|
VSI
-
NYSE
Vitamin Shoppe Inc
SPECIALTY RETAIL - Specialty Retail, Other
|
$55.55
|
-0.94
-1.66% |
$56.46
|
457,854
119.54% of 50 DAV
50 DAV is 383,000
|
$61.83
-10.15%
|
6/29/2012
|
$54.93
|
PP = $55.03
|
|
MB = $57.78
|
Most Recent Note - 8/15/2012 1:01:30 PM
G - Down today trading near its 50 DMA line and upward trendline previously noted as defining near-term chart support to watch. More damaging losses would trigger technical sell signals.
>>> The latest Featured Stock Update with an annotated graph appeared on 8/2/2012. Click here.
View all notes |
Alert me of new notes |
CANSLIM.net Company Profile |
SEC |
Zacks Reports |
StockTalk |
News |
Chart |
Request a new note
C
A N
S L
I M
|
Symbol/Exchange
Company Name
Industry Group |
PRICE |
CHANGE
(%Change) |
Day High |
Volume
(% DAV)
(% 50 day avg vol) |
52 Wk Hi
% From Hi |
Featured
Date |
Price
Featured |
Pivot Featured |
|
Max Buy |
|
|
|
THESE ARE NOT BUY RECOMMENDATIONS!
Comments contained in the body of this report are technical
opinions only. The material herein has been obtained
from sources believed to be reliable and accurate, however,
its accuracy and completeness cannot be guaranteed.
This site is not an investment advisor, hence it does
not endorse or recommend any securities or other investments.
Any recommendation contained in this report may not
be suitable for all investors and it is not to be deemed
an offer or solicitation on our part with respect to
the purchase or sale of any securities. All trademarks,
service marks and trade names appearing in this report
are the property of their respective owners, and are
likewise used for identification purposes only.
This report is a service available
only to active Paid Premium Members.
You may opt-out of receiving report notifications
at any time. Questions or comments may be submitted
by writing to Premium Membership Services 665 S.E. 10 Street, Suite 201 Deerfield Beach, FL 33441-5634 or by calling 1-800-965-8307
or 954-785-1121.
|
|
|

