You are not logged in.
This means you
CAN ONLY VIEW reports that were published prior to Monday, April 14, 2025.
You
MUST UPGRADE YOUR MEMBERSHIP if you want to see any current reports.
AFTER MARKET UPDATE - THURSDAY, AUGUST 14TH, 2014
Previous After Market Report Next After Market Report >>>
|
|
|
|
DOW |
+61.78 |
16,713.58 |
+0.37% |
|
Volume |
505,812,940 |
-8% |
|
Volume |
1,433,756,930 |
-4% |
|
NASDAQ |
+18.87 |
4,453.00 |
+0.43% |
|
Advancers |
2,056 |
65% |
|
Advancers |
1,561 |
55% |
|
S&P 500 |
+8.46 |
1,955.18 |
+0.43% |
|
Decliners |
985 |
31% |
|
Decliners |
1,167 |
41% |
|
Russell 2000 |
+1.56 |
1,143.34 |
+0.14% |
|
52 Wk Highs |
87 |
|
|
52 Wk Highs |
42 |
|
|
S&P 600 |
+0.71 |
657.89 |
+0.11% |
|
52 Wk Lows |
23 |
|
|
52 Wk Lows |
46 |
|
|
 |
Major Averages Rose With Lighter Volume Totals
Kenneth J. Gruneisen - Passed the CAN SLIM® Master's Exam
The major averages gained on Thursday's session. The Dow added 61 points to 16,713. The S&P 500 rose 8 points to 1,955. The NASDAQ was 18 points higher at 4,453. Volume totals were lighter on both major exchanges, a sign of lackluster institutional buying demand. Breadth was positive as advancing issues beat decliners by 3-2 on the NYSE and 5-4 on the NASDAQ exchange. There were 34 high-ranked companies from the CANSLIM.net Leaders List that made new 52-week highs and appeared on the CANSLIM.net BreakOuts Page, up from the prior session total of 26 stocks. New 52-week highs outnumbered new 52-week lows on the NYSE but new lows outnumbered new highs on the Nasdaq exchange. There were gains for 9 of the 10 of the high-ranked companies currently included on the Featured Stocks Page. The market (M criteria) deterioration recently earned the label of a "correction" as the technical damage became significant to chart readers and leadership (stocks hitting new 52-week highs) waned. Disciplined investors limit losses and reduce market exposure during rough market periods by selling any stocks which fall more than -7% from their purchase price.
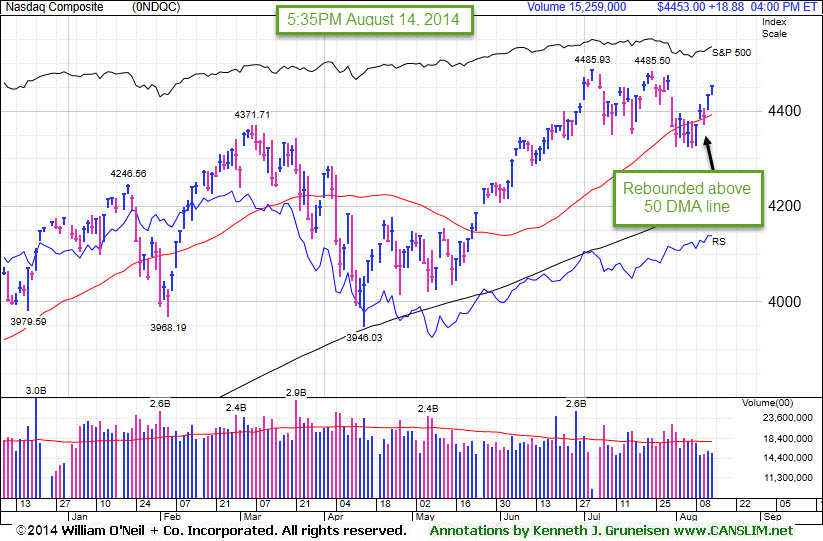
PICTURED: The tech-heavy Nasdaq Composite index is rebounding above its 50-day moving average (DMA) line within striking distance of its 2014 high.
The major averages advanced for a second straight day as geopolitical concerns eased after President Vladimir Putin said Russia would do all it can to end the conflict in Ukraine. Investors also appeared to overlook an unexpected increase in weekly jobless claims to 311,000 as the four-week average figure suggested the labor market continues to improve.
On the earnings front, Kohl's (KSS +3.2%) as profits topped projections. Wal-Mart (WMT +0.5%) edged higher despite lowering its full-year forecast. Cisco (CSCO -2.6%) following its reduced forecast and said it plans to cut 6,000 jobs.
Health care was the best performing sector in the S&P 500. Biotech helped paced the group's gain with Amgen (AMGN +3.6%) rose to a record high. Over-the-counter drug maker Perrigo (PGRO +7.3%) as quarterly results beat consensus estimates. Energy was down the most on the session. Halliburton fell (HAL -3.2%) as the price of oil declined more than -2%.
Treasuries rose on the session. The 10-year note gained 8/32 to yield 2.40%. 30-year bonds climbed 30/32 to yield 3.19% after today's $16 billion auction of the maturity experienced strong demand.
|
 Kenneth J. Gruneisen started out as a licensed stockbroker in August 1987, a couple of months prior to the historic stock market crash that took the Dow Jones Industrial Average down -22.6% in a single day. He has published daily fact-based fundamental and technical analysis on high-ranked stocks online for two decades. Through FACTBASEDINVESTING.COM, Kenneth provides educational articles, news, market commentary, and other information regarding proven investment systems that work in good times and bad.
Comments contained in the body of this report are technical opinions only and are not necessarily those of Gruneisen Growth Corp. The material herein has been obtained from sources believed to be reliable and accurate, however, its accuracy and completeness cannot be guaranteed. Our firm, employees, and customers may effect transactions, including transactions contrary to any recommendation herein, or have positions in the securities mentioned herein or options with respect thereto. Any recommendation contained in this report may not be suitable for all investors and it is not to be deemed an offer or solicitation on our part with respect to the purchase or sale of any securities. |
|
 |
Retail, Financial and Biotech Indexes Rose
Kenneth J. Gruneisen - Passed the CAN SLIM® Master's Exam
The Retail Index ($RLX +1.02%) underpinned the major indices' rally effort on Thursday while the Broker/Dealer Index ($XBD +0.19%) and the Bank Index ($BKX +0.32%) also had a positive bias. Commodity-linked groups led decliners as the Oil Services Index ($OSX -1.83%) and Gold & Silver Index ($XAU -1.18%) fell. The tech sector was mixed as the Networking Index ($NWX -0.73%) fell while the Biotechnology Index ($BTK +1.26%) outpaced the Semiconductor Index ($SOX +0.21%) with gains. The Integrated Oil Index ($XOI -0.11%) finished flat.
Charts courtesy www.stockcharts.com
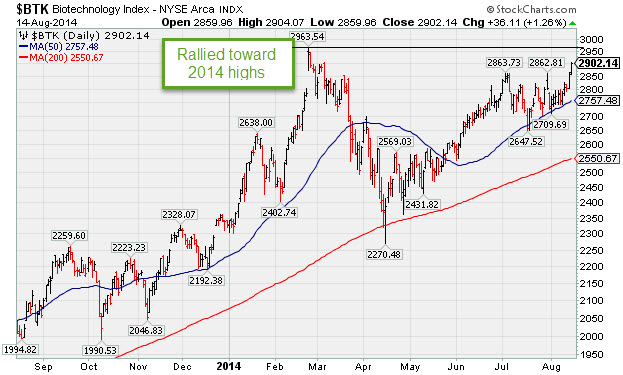
PICTURED: The Biotechnology Index ($BTK +1.26%) is rallying near its 2014 highs.
| Oil Services |
$OSX |
282.23 |
-5.25 |
-1.83% |
+0.43% |
| Integrated Oil |
$XOI |
1,634.05 |
-1.85 |
-0.11% |
+8.71% |
| Semiconductor |
$SOX |
618.26 |
+1.31 |
+0.21% |
+15.56% |
| Networking |
$NWX |
321.71 |
-2.37 |
-0.73% |
-0.69% |
| Broker/Dealer |
$XBD |
163.23 |
+0.32 |
+0.19% |
+1.66% |
| Retail |
$RLX |
913.69 |
+9.23 |
+1.02% |
-2.78% |
| Gold & Silver |
$XAU |
102.60 |
-1.23 |
-1.18% |
+21.93% |
| Bank |
$BKX |
69.35 |
+0.22 |
+0.32% |
+0.13% |
| Biotech |
$BTK |
2,902.14 |
+36.11 |
+1.26% |
+24.53% |
|
|
|
 |
Submit Your Request for a Featured Stock Update
Kenneth J. Gruneisen - Passed the CAN SLIM® Master's Exam
Market conditions (the M criteria) are challenging at times. There are few stocks included on the Featured Stocks list and none of the companies need additional review in detail with annotated graphs. At times like these we have an opportunity to look back and review previously featured stocks which were dropped, which can serve as an educational review of the investment system's tactics and a reminder that high-ranked leaders eventually fall out of favor. If you wish to request for a specific stock to receive more detailed coverage in this section please use the inquiry form to submit your request. Thank you! |
|
|
Color Codes Explained :
Y - Better candidates highlighted by our
staff of experts.
G - Previously featured
in past reports as yellow but may no longer be buyable under the
guidelines.
***Last / Change / Volume data in this table is the closing quote data***
Symbol/Exchange
Company Name
Industry Group |
PRICE |
CHANGE
(%Change) |
Day High |
Volume
(% DAV)
(% 50 day avg vol) |
52 Wk Hi
% From Hi |
Featured
Date |
Price
Featured |
Pivot Featured |
|
Max Buy |
ACT
-
NYSE
Actavis plc
Medical-Generic Drugs
|
$212.64
|
+5.67
2.74% |
$213.41
|
2,402,385
93.81% of 50 DAV
50 DAV is 2,561,000
|
$230.77
-7.86%
|
6/20/2014
|
$216.53
|
PP = $230.87
|
|
MB = $242.41
|
Most Recent Note - 8/6/2014 12:03:39 PM
G - Small gap down today and its color code is changed to green while slumping below its 50 DMA line and enduring distributional pressure. A rebound above the 50 DMA line is needed for its outlook to improve. Reported earnings +70% on +34% sales revenues for the Jun '14 quarter. See the latest FSU analysis for more details and new annotated graphs.
>>> FEATURED STOCK ARTICLE : Enduring Distributional Pressure While Sputtering Near 50-Day Average - 8/5/2014
View all notes |
Set NEW NOTE alert |
CANSLIM.net Company Profile |
SEC
News |
Chart |
Request a new note
C
A N
S L
I M


|
AFSI
-
NASDAQ
Amtrust Financial Svcs
INSURANCE - Property and; Casualty Insurance
|
$45.17
|
+0.58
1.30% |
$45.36
|
376,046
86.65% of 50 DAV
50 DAV is 434,000
|
$47.10
-4.10%
|
5/21/2014
|
$44.85
|
PP = $44.85
|
|
MB = $47.09
|
Most Recent Note - 8/7/2014 11:55:47 AM
G - Reversed into the red after gapping up today following Jun '14 earnings news. Previously noted with caution - "Consolidating just above its 50 DMA line, facing resistance due to overhead supply up through the $47 level."
>>> FEATURED STOCK ARTICLE : 50-Day Moving Average Line Acted as Recent Resistance - 7/23/2014
View all notes |
Set NEW NOTE alert |
CANSLIM.net Company Profile |
SEC
News |
Chart |
Request a new note
C
A N
S L
I M
|
BITA
-
NYSE
Bitauto Hldgs Ltd Ads
Internet-Content
|
$75.30
|
+1.29
1.74% |
$75.50
|
1,141,189
119.37% of 50 DAV
50 DAV is 956,000
|
$74.88
0.56%
|
6/26/2014
|
$46.20
|
PP = $47.03
|
|
MB = $49.38
|
Most Recent Note - 8/13/2014 12:08:03 PM
G - Powering to yet another new 52-week high with today's 6th consecutive gain, getting more extended from its prior base. Its 50 DMA line ($51.19) defines important near-term support to watch on pullbacks.
>>> FEATURED STOCK ARTICLE : Perched at High After 3 Consecutive Volume-Driven Gains - 8/8/2014
View all notes |
Set NEW NOTE alert |
CANSLIM.net Company Profile |
SEC
News |
Chart |
Request a new note
C
A N
S L
I M
|
EQM
-
NYSE
E Q T Midstream Partners
ENERGY - Oil and Gas Pipelines
|
$91.20
|
+0.51
0.56% |
$92.41
|
154,501
43.89% of 50 DAV
50 DAV is 352,000
|
$102.51
-11.03%
|
12/12/2013
|
$53.17
|
PP = $56.51
|
|
MB = $59.34
|
Most Recent Note - 8/11/2014 6:22:06 PM
G - Rebounded toward its 50 DMA line with today's solid gain. That short-term average may now act as a resistance level. Reported earnings +37% on +21% sales revenues for the Jun '14 quarter, an improvement after 2 sub par quarterly earnings comparisons.
>>> FEATURED STOCK ARTICLE : Following 50-Day Moving Average Violation Gains Lacked Volume - 8/7/2014
View all notes |
Set NEW NOTE alert |
CANSLIM.net Company Profile |
SEC
News |
Chart |
Request a new note
C
A N
S L
I M
|
FB
-
NASDAQ
Facebook Inc Cl A
INTERNET
|
$74.30
|
+0.53
0.71% |
$74.38
|
22,153,803
52.48% of 50 DAV
50 DAV is 42,213,000
|
$76.74
-3.18%
|
7/24/2014
|
$76.00
|
PP = $72.69
|
|
MB = $76.32
|
Most Recent Note - 8/8/2014 4:06:39 PM
Y - Volume totals have been cooling while consolidating near its pivot point, stubbornly holding its ground after gapping up on 7/24/14. Prior highs in the $72 area define initial support above its 50 DMA line.
>>> FEATURED STOCK ARTICLE : Breakaway Gap May Signal Beginning of Meaningful Rally - 7/24/2014
View all notes |
Set NEW NOTE alert |
CANSLIM.net Company Profile |
SEC
News |
Chart |
Request a new note
C
A N
S L
I M
|
Symbol/Exchange
Company Name
Industry Group |
PRICE |
CHANGE
(%Change) |
Day High |
Volume
(% DAV)
(% 50 day avg vol) |
52 Wk Hi
% From Hi |
Featured
Date |
Price
Featured |
Pivot Featured |
|
Max Buy |
PANW
-
NYSE
Palo Alto Networks
Computer Sftwr-Security
|
$85.49
|
+0.70
0.83% |
$87.79
|
1,941,739
130.84% of 50 DAV
50 DAV is 1,484,000
|
$86.51
-1.18%
|
7/30/2014
|
$84.21
|
PP = $85.88
|
|
MB = $90.17
|
 Most Recent Note - 8/14/2014 12:54:43 PM
Y - Hit another new 52-week high with today's volume-driven gain. Volume should be at least +40% above average behind gains above a stock's pivot point during a market rally (M criteria) to trigger a proper technical buy signal. Prior session's gain on +89% above average volume approached and briefly exceeded its pivot point but it did not close above that threshold. Its 50 DMA line defines important near-term support.
>>> FEATURED STOCK ARTICLE : Building on New Base Pattern Above 50-Day Average - 8/11/2014
View all notes |
Set NEW NOTE alert |
CANSLIM.net Company Profile |
SEC
News |
Chart |
Request a new note
C
A N
S L
I M
|
TARO
-
NYSE
Taro Pharmaceutical Inds
DRUGS - Drug Manufacturers - Other
|
$153.65
|
+0.68
0.44% |
$157.00
|
96,632
125.50% of 50 DAV
50 DAV is 77,000
|
$154.17
-0.34%
|
7/30/2014
|
$144.24
|
PP = $149.99
|
|
MB = $157.49
|
Most Recent Note - 8/14/2014 12:58:21 PM
G - Hitting yet another new 52-week high with today's 6th consecutive gain. Found support at its 50 DMA line while building on its latest base pattern. Reported earnings -18% on -15% sales revenues for the Jun '14 quarter, below the +25% minimum earnings guideline (C criteria) raising fundamental concerns and its color code was changed to green.
>>> FEATURED STOCK ARTICLE : Still Building on an Advanced Base Pattern - 8/6/2014
View all notes |
Set NEW NOTE alert |
CANSLIM.net Company Profile |
SEC
News |
Chart |
Request a new note
C
A N
S L
I M
|
TRN
-
NYSE
Trinity Industries Inc
TRANSPORTATION - Railroads
|
$44.16
|
+0.43
0.98% |
$44.24
|
2,064,328
70.84% of 50 DAV
50 DAV is 2,914,000
|
$47.83
-7.67%
|
4/30/2014
|
$37.79
|
PP = $38.03
|
|
MB = $39.93
|
Most Recent Note - 8/13/2014 6:15:36 PM
Y - Rebounded above its 50 DMA line helping its technical outlook improve and its color code is changed to yellow. Reported earnings +91% on +39% sales for the Jun '14 quarter.
>>> FEATURED STOCK ARTICLE : Earnings News Due Following Tuesday's Close - 7/28/2014
View all notes |
Set NEW NOTE alert |
CANSLIM.net Company Profile |
SEC
News |
Chart |
Request a new note
C
A N
S L
I M
|
UA
-
NYSE
Under Armour Inc Cl A
CONSUMER NON-DURABLES - Textile - Apparel Clothing
|
$68.80
|
-0.29
-0.42% |
$69.45
|
1,434,981
54.50% of 50 DAV
50 DAV is 2,633,000
|
$70.94
-3.02%
|
7/10/2014
|
$58.50
|
PP = $60.79
|
|
MB = $63.83
|
Most Recent Note - 8/6/2014 6:48:24 PM
G - Recently reported earnings +0% on +34% sales revenues for the Jun '14 quarter, below the +25% minimum earnings guideline (C criteria), yet the company raised its guidance. Hold its ground stubbornly near all-time highs with no resistance remaining due to overhead supply.
>>> FEATURED STOCK ARTICLE : Bullish Action Despite Latest Earnings Below +25% Minimum Guideline - 7/30/2014
View all notes |
Set NEW NOTE alert |
CANSLIM.net Company Profile |
SEC
News |
Chart |
Request a new note
C
A N
S L
I M
|
WLK
-
NYSE
Westlake Chemical Corp
CHEMICALS - Specialty Chemicals
|
$89.04
|
+0.12
0.13% |
$89.48
|
311,391
58.64% of 50 DAV
50 DAV is 531,000
|
$91.97
-3.19%
|
4/29/2014
|
$72.79
|
PP = $69.31
|
|
MB = $72.78
|
Most Recent Note - 8/8/2014 4:08:52 PM
G - Reported earnings +11% on +6% sales revenues for the Jun '14 quarter, below the +25% minimum earnings guideline (C criteria), raising fundamental concerns. Found support this week at its 50 DMA line ($85.05) where a subsequent violation would raise greater concerns and trigger a technical sell signal.
>>> FEATURED STOCK ARTICLE : Extended From Prior Base After Streak of 8 Consecutive Gains - 7/25/2014
View all notes |
Set NEW NOTE alert |
CANSLIM.net Company Profile |
SEC
News |
Chart |
Request a new note
C
A N
S L
I M
|
Symbol/Exchange
Company Name
Industry Group |
PRICE |
CHANGE
(%Change) |
Day High |
Volume
(% DAV)
(% 50 day avg vol) |
52 Wk Hi
% From Hi |
Featured
Date |
Price
Featured |
Pivot Featured |
|
Max Buy |
|
|
|
THESE ARE NOT BUY RECOMMENDATIONS!
Comments contained in the body of this report are technical
opinions only. The material herein has been obtained
from sources believed to be reliable and accurate, however,
its accuracy and completeness cannot be guaranteed.
This site is not an investment advisor, hence it does
not endorse or recommend any securities or other investments.
Any recommendation contained in this report may not
be suitable for all investors and it is not to be deemed
an offer or solicitation on our part with respect to
the purchase or sale of any securities. All trademarks,
service marks and trade names appearing in this report
are the property of their respective owners, and are
likewise used for identification purposes only.
This report is a service available
only to active Paid Premium Members.
You may opt-out of receiving report notifications
at any time. Questions or comments may be submitted
by writing to Premium Membership Services 665 S.E. 10 Street, Suite 201 Deerfield Beach, FL 33441-5634 or by calling 1-800-965-8307
or 954-785-1121.
|
|
|

