***Last / Change / Volume data in this table is the closing quote data***
Symbol/Exchange
Company Name
Industry Group |
PRICE |
CHANGE
(%Change) |
Day High |
Volume
(% DAV)
(% 50 day avg vol) |
52 Wk Hi
% From Hi |
Featured
Date |
Price
Featured |
Pivot Featured |
|
Max Buy |
ALXN
-
NASDAQ
Alexion Pharmaceuticals
DRUGS - Drug Manufacturers - Other
|
$103.68
|
+0.26
0.25% |
$104.03
|
500,116
32.13% of 50 DAV
50 DAV is 1,556,300
|
$109.96
-5.71%
|
5/1/2012
|
$91.73
|
PP = $95.11
|
|
MB = $99.87
|
Most Recent Note - 8/8/2012 4:05:52 PM
G - Holding its ground with volume totals cooling since last noted on 8/03/12 when it gapped up for a gain with above average volume. Chart support is defined by its 50 DMA line (now $98.11).
>>> The latest Featured Stock Update with an annotated graph appeared on 7/25/2012. Click here.
View all notes |
Alert me of new notes |
CANSLIM.net Company Profile |
SEC |
Zacks Reports |
StockTalk |
News |
Chart |
Request a new note
C
A N
S L
I M


|
ASPS
-
NASDAQ
Altisource Ptf Sltns Sa
REAL ESTATE - Property Management/Developmen
|
$84.67
|
+1.07
1.28% |
$84.82
|
137,879
103.59% of 50 DAV
50 DAV is 133,100
|
$84.74
-0.08%
|
6/5/2012
|
$60.01
|
PP = $63.00
|
|
MB = $66.15
|
Most Recent Note - 8/8/2012 4:06:45 PM
G - Tallied a 9th consecutive gain today and hit another new high, getting more extended from its prior base. Recent low and its 50 DMA line define near-term support to watch.
>>> The latest Featured Stock Update with an annotated graph appeared on 8/3/2012. Click here.
View all notes |
Alert me of new notes |
CANSLIM.net Company Profile |
SEC |
Zacks Reports |
StockTalk |
News |
Chart |
Request a new note
C
A N
S L
I M
|
CFNL
-
NASDAQ
Cardinal Financial Corp
BANKING - Regional - Southeast Banks
|
$12.44
|
+0.01
0.08% |
$12.50
|
49,047
63.95% of 50 DAV
50 DAV is 76,700
|
$13.21
-5.83%
|
7/20/2012
|
$12.85
|
PP = $12.41
|
|
MB = $13.03
|
Most Recent Note - 8/7/2012 4:24:18 PM
Y - Rebounded further above its pivot point with today's gain on +20% above average volume. Its 50 DMA line and prior chart highs define important near-term support to watch.
>>> The latest Featured Stock Update with an annotated graph appeared on 7/26/2012. Click here.
View all notes |
Alert me of new notes |
CANSLIM.net Company Profile |
SEC |
Zacks Reports |
StockTalk |
News |
Chart |
Request a new note
C
A N
S L
I M
|
CMCSA
-
NASDAQ
Comcast Corp Cl A
MEDIA - CATV Systems
|
$34.55
|
-0.18
-0.52% |
$34.64
|
11,566,878
80.31% of 50 DAV
50 DAV is 14,402,700
|
$35.16
-1.73%
|
6/11/2012
|
$29.94
|
PP = $30.98
|
|
MB = $32.53
|
Most Recent Note - 8/7/2012 11:03:32 AM
G - Hit another new 52-week high today, getting more extended from its prior base with a streak of recent gains backed by above average volume. Gapped up on 8/01/12 after reporting earnings +19% on +6% sales revenues for the Jun '12 quarter, below the fact-based investment system's +25% minimum guideline for the C criteria, but better than Street expectations.
>>> The latest Featured Stock Update with an annotated graph appeared on 7/11/2012. Click here.
View all notes |
Alert me of new notes |
CANSLIM.net Company Profile |
SEC |
Zacks Reports |
StockTalk |
News |
Chart |
Request a new note
C
A N
S L
I M
|
DG
-
NYSE
Dollar General Corp
RETAIL - Discount, Variety Stores
|
$52.54
|
+0.77
1.49% |
$52.59
|
2,458,332
62.78% of 50 DAV
50 DAV is 3,916,100
|
$56.04
-6.25%
|
7/16/2012
|
$54.68
|
PP = $56.14
|
|
MB = $58.95
|
Most Recent Note - 8/7/2012 11:00:14 AM
G - Consolidating near its 50 DMA line with volume totals cooling in recent weeks after encountering distributional pressure.
>>> The latest Featured Stock Update with an annotated graph appeared on 7/12/2012. Click here.
View all notes |
Alert me of new notes |
CANSLIM.net Company Profile |
SEC |
Zacks Reports |
StockTalk |
News |
Chart |
Request a new note
C
A N
S L
I M
|
Symbol/Exchange
Company Name
Industry Group |
PRICE |
CHANGE
(%Change) |
Day High |
Volume
(% DAV)
(% 50 day avg vol) |
52 Wk Hi
% From Hi |
Featured
Date |
Price
Featured |
Pivot Featured |
|
Max Buy |
ECPG
-
NASDAQ
Encore Capital Group Inc
FINANCIAL SERVICES - Credit Services
|
$28.50
|
+0.18
0.64% |
$28.50
|
60,040
38.56% of 50 DAV
50 DAV is 155,700
|
$30.47
-6.47%
|
8/3/2012
|
$29.91
|
PP = $30.45
|
|
MB = $31.97
|
Most Recent Note - 8/8/2012 12:04:47 PM
Y - Gapped down today, retreating to its 50 DMA line with a large loss on above average volume. A volume-driven gain and close above its pivot point may trigger a technical buy signal, meanwhile, subsequent deterioration below its 50 DMA line and recent lows would raise more serious concerns. See the latest FSU analysis for more details and a new annotated graph.
>>> The latest Featured Stock Update with an annotated graph appeared on 8/6/2012. Click here.
View all notes |
Alert me of new notes |
CANSLIM.net Company Profile |
SEC |
Zacks Reports |
StockTalk |
News |
Chart |
Request a new note
C
A N
S L
I M
|
EXPE
-
NASDAQ
Expedia Inc
INTERNET - Internet Information Providers
|
$53.83
|
-0.61
-1.12% |
$55.03
|
3,130,247
80.54% of 50 DAV
50 DAV is 3,886,700
|
$59.50
-9.53%
|
4/27/2012
|
$41.80
|
PP = $35.57
|
|
MB = $37.35
|
Most Recent Note - 8/10/2012 1:00:58 PM
G - Down today for a 3rd losing session in a row after its 8/08/12 gap down amid weakness in travel-related stocks after Priceline.com Inc (PCLN) and Orbitz Worldwide Inc (OWW) reported disappointing results. EXPE recently reported earnings +24% on +14% sales revenues for the quarter ending June 30, 2012 versus the year ago period, just below the +25% minimum earnings guideline for buy candidates.
>>> The latest Featured Stock Update with an annotated graph appeared on 7/10/2012. Click here.
View all notes |
Alert me of new notes |
CANSLIM.net Company Profile |
SEC |
Zacks Reports |
StockTalk |
News |
Chart |
Request a new note
C
A N
S L
I M
|
GNC
-
NYSE
G N C Holdings Inc
RETAIL - Drug Stores
|
$38.87
|
+0.95
2.51% |
$39.00
|
3,487,603
132.33% of 50 DAV
50 DAV is 2,635,600
|
$42.70
-8.97%
|
6/29/2012
|
$39.20
|
PP = $40.00
|
|
MB = $42.00
|
Most Recent Note - 8/10/2012 12:59:22 PM
G - Down today with above average volume while slumping below its 50 DMA line raising concerns, and its color code is changed to green. Reported earnings +59% on +19% sales revenues for the quarter ended June 30, 2012 versus the year ago period, beating expectations, and it also raised guidance for FY '12.
>>> The latest Featured Stock Update with an annotated graph appeared on 8/8/2012. Click here.
View all notes |
Alert me of new notes |
CANSLIM.net Company Profile |
SEC |
Zacks Reports |
StockTalk |
News |
Chart |
Request a new note
C
A N
S L
I M
|
GPX
-
NYSE
G P Strategies Corp
DIVERSIFIED SERVICES - Education and Training Services
|
$19.25
|
+0.59
3.16% |
$19.28
|
158,954
245.30% of 50 DAV
50 DAV is 64,800
|
$20.08
-4.13%
|
6/29/2012
|
$18.01
|
PP = $18.15
|
|
MB = $19.06
|
 Most Recent Note - 8/13/2012 5:39:34 PM
G - Up today with above average volume, finishing -4.1% off its 52-week high. Color code is changed to green after closing back above its "max buy" level.
>>> The latest Featured Stock Update with an annotated graph appeared on 8/7/2012. Click here.
View all notes |
Alert me of new notes |
CANSLIM.net Company Profile |
SEC |
Zacks Reports |
StockTalk |
News |
Chart |
Request a new note
C
A N
S L
I M
|
HMSY
-
NASDAQ
H M S Holdings Corp
COMPUTER SOFTWARE and SERVICES - Healthcare Information Service
|
$36.17
|
+0.27
0.75% |
$36.97
|
995,072
112.07% of 50 DAV
50 DAV is 887,900
|
$36.35
-0.50%
|
7/27/2012
|
$33.91
|
PP = $34.83
|
|
MB = $36.57
|
Most Recent Note - 8/13/2012 5:40:27 PM
Y - Hit another new 52-week high today with near average volume behind its gain. Gains above a stock's pivot point must have at least +40% above average volume, preferably greater, to trigger a proper technical buy signal.
>>> The latest Featured Stock Update with an annotated graph appeared on 7/27/2012. Click here.
View all notes |
Alert me of new notes |
CANSLIM.net Company Profile |
SEC |
Zacks Reports |
StockTalk |
News |
Chart |
Request a new note
C
A N
S L
I M
|
Symbol/Exchange
Company Name
Industry Group |
PRICE |
CHANGE
(%Change) |
Day High |
Volume
(% DAV)
(% 50 day avg vol) |
52 Wk Hi
% From Hi |
Featured
Date |
Price
Featured |
Pivot Featured |
|
Max Buy |
LKQ
-
NASDAQ
L K Q Corp
WHOLESALE - Auto Parts
|
$38.56
|
+0.24
0.63% |
$38.62
|
720,675
95.64% of 50 DAV
50 DAV is 753,500
|
$38.42
0.36%
|
8/9/2012
|
$37.93
|
PP = $37.44
|
|
MB = $39.31
|
Most Recent Note - 8/10/2012 6:01:47 PM
Y - Hit a new 52-week high today with its 6th consecutive gain. Its prior gain with +55% above average volume while rising above its pivot point triggered a technical buy signal. See the latest FSU analysis for more details and an annotated graph.
>>> The latest Featured Stock Update with an annotated graph appeared on 8/10/2012. Click here.
View all notes |
Alert me of new notes |
CANSLIM.net Company Profile |
SEC |
Zacks Reports |
StockTalk |
News |
Chart |
Request a new note
C
A N
S L
I M
|
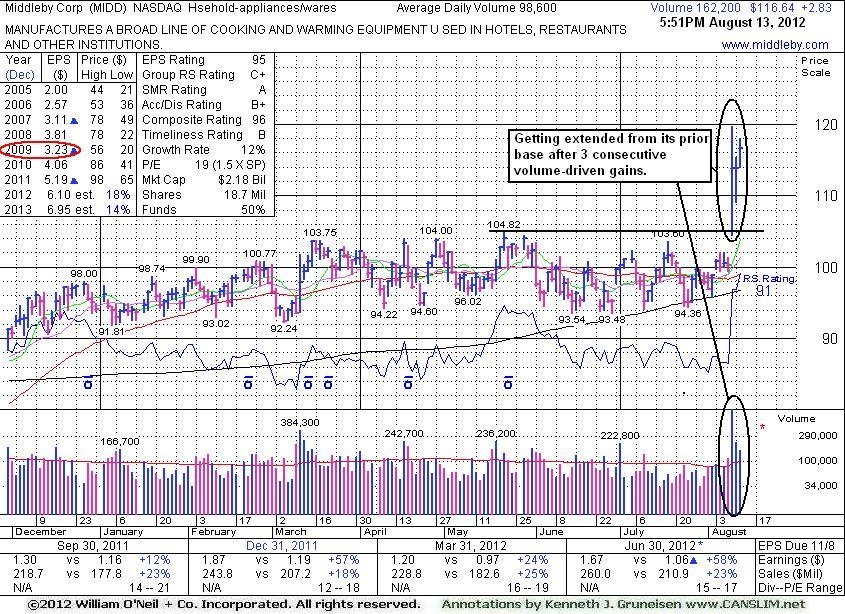
MIDD
-
NASDAQ
Middleby Corp
MANUFACTURING - Diversified Machinery
|
$116.64
|
+2.83
2.48% |
$117.98
|
162,619
164.93% of 50 DAV
50 DAV is 98,600
|
$119.74
-2.59%
|
8/9/2012
|
$118.60
|
PP = $104.92
|
|
MB = $110.17
|
Most Recent Note - 8/13/2012 4:03:48 PM
G - Getting more extended with today's 3rd consecutive volume-driven gain into new high territory, and its color code is changed to green. Last week it broke out from a long flat base with 9 times average volume. Reported earnings +58% on +23% sales revenues for the Jun '12 quarter. Recent quarterly comparisons show strong sales and earnings reasonably meeting the C criteria. Its annual earnings (A criteria) had a downturn in FY '09, yet they have otherwise been good and steady.

>>> The latest Featured Stock Update with an annotated graph appeared on 8/13/2012. Click here.
View all notes |
Alert me of new notes |
CANSLIM.net Company Profile |
SEC |
Zacks Reports |
StockTalk |
News |
Chart |
Request a new note
C
A N
S L
I M
|
N
-
NYSE
Netsuite Inc
DIVERSIFIED SERVICES - Business/Management Services
|
$56.63
|
-0.62
-1.08% |
$57.35
|
320,014
42.83% of 50 DAV
50 DAV is 747,200
|
$59.22
-4.37%
|
6/20/2012
|
$51.83
|
PP = $51.88
|
|
MB = $54.47
|
Most Recent Note - 8/8/2012 4:10:23 PM
G - Perched near its 52-week high, holding its ground with volume totals cooling. Found support near its 50 DMA line when encountering recent distributional pressure.
>>> The latest Featured Stock Update with an annotated graph appeared on 7/19/2012. Click here.
View all notes |
Alert me of new notes |
CANSLIM.net Company Profile |
SEC |
Zacks Reports |
StockTalk |
News |
Chart |
Request a new note
C
A N
S L
I M
|
NSM
-
NYSE
Nationstar Mtg Hldgs Inc
FINANCIAL SERVICES - Credit Services
|
$25.31
|
-0.32
-1.25% |
$26.20
|
679,174
85.81% of 50 DAV
50 DAV is 791,500
|
$25.71
-1.56%
|
6/27/2012
|
$20.29
|
PP = $20.46
|
|
MB = $21.48
|
Most Recent Note - 8/8/2012 4:00:48 PM
G - Today's gain on light volume led to its best-ever close. It is not near a sound base. Recently found support above prior highs and its 50 DMA line in the $20 area.
>>> The latest Featured Stock Update with an annotated graph appeared on 8/1/2012. Click here.
View all notes |
Alert me of new notes |
CANSLIM.net Company Profile |
SEC |
Zacks Reports |
StockTalk |
News |
Chart |
Request a new note
C
A N
S L
I M
|
OSIS
-
NASDAQ
O S I Systems Inc
ELECTRONICS - Semiconductor Equipment and Mate
|
$73.49
|
+1.99
2.78% |
$73.61
|
184,102
165.56% of 50 DAV
50 DAV is 111,200
|
$72.47
1.41%
|
8/9/2012
|
$67.71
|
PP = $67.48
|
|
MB = $70.85
|
Most Recent Note - 8/13/2012 12:24:40 PM
G - Color code is changed to green while rallying above its "max buy" level and getting extended from its prior base. Prior highs in the $67-68 area define initial support to watch on pullbacks. See the latest FSU analysis for more details and a new annotated graph.
>>> The latest Featured Stock Update with an annotated graph appeared on 8/9/2012. Click here.
View all notes |
Alert me of new notes |
CANSLIM.net Company Profile |
SEC |
Zacks Reports |
StockTalk |
News |
Chart |
Request a new note
C
A N
S L
I M
|
Symbol/Exchange
Company Name
Industry Group |
PRICE |
CHANGE
(%Change) |
Day High |
Volume
(% DAV)
(% 50 day avg vol) |
52 Wk Hi
% From Hi |
Featured
Date |
Price
Featured |
Pivot Featured |
|
Max Buy |
RNF
-
NYSE
Rentech Nitrogen Ptnr Lp
CHEMICALS - Agricultural Chemicals
|
$31.36
|
-0.80
-2.49% |
$33.01
|
616,443
146.91% of 50 DAV
50 DAV is 419,600
|
$34.48
-9.05%
|
7/27/2012
|
$29.58
|
PP = $30.60
|
|
MB = $32.13
|
Most Recent Note - 8/13/2012 4:58:03 PM
Y - Color code is changed to yellow after slumping below its "max buy" level with a 3rd consecutive loss today with above average volume. Encountering distributional pressure after triggering a technical buy signal with its considerable 8/07/12 gain, prior highs in the $30-31 area define initial support to watch.
>>> The latest Featured Stock Update with an annotated graph appeared on 7/31/2012. Click here.
View all notes |
Alert me of new notes |
CANSLIM.net Company Profile |
SEC |
Zacks Reports |
StockTalk |
News |
Chart |
Request a new note
C
A N
S L
I M
|
SWI
-
NYSE
Solarwinds Inc
COMPUTER SOFTWARE and SERVICES - Application Software
|
$55.42
|
+0.40
0.73% |
$55.44
|
738,808
59.04% of 50 DAV
50 DAV is 1,251,300
|
$56.80
-2.43%
|
7/25/2012
|
$47.82
|
PP = $47.89
|
|
MB = $50.28
|
Most Recent Note - 8/10/2012 4:35:28 PM
G - Pulling back from its all-time high today with a 3rd consecutive loss on light volume. Prior highs in the $48 area define initial support to watch on pullbacks.
>>> The latest Featured Stock Update with an annotated graph appeared on 7/30/2012. Click here.
View all notes |
Alert me of new notes |
CANSLIM.net Company Profile |
SEC |
Zacks Reports |
StockTalk |
News |
Chart |
Request a new note
C
A N
S L
I M
|
TDG
-
NYSE
Transdigm Group Inc
AEROSPACE/DEFENSE - Aerospace/Defense Products and; Services
|
$127.64
|
+0.14
0.11% |
$128.46
|
231,791
52.51% of 50 DAV
50 DAV is 441,400
|
$136.34
-6.38%
|
6/18/2012
|
$127.00
|
PP = $132.79
|
|
MB = $139.43
|
Most Recent Note - 8/7/2012 10:56:59 AM
G - Reported earnings +55% on +42% sales revenues for the quarter ended June 30, 2012 versus the year ago period. Gapped up today and traded above its 50 DMA line. Recent lows in the $117-118 are define near-term support above its 200 DMA line.
>>> The latest Featured Stock Update with an annotated graph appeared on 7/18/2012. Click here.
View all notes |
Alert me of new notes |
CANSLIM.net Company Profile |
SEC |
Zacks Reports |
StockTalk |
News |
Chart |
Request a new note
C
A N
S L
I M
|
TNGO
-
NASDAQ
Tangoe Inc
COMPUTER SOFTWARE and SERVICES - Technical and System Software
|
$20.83
|
-0.60
-2.80% |
$21.50
|
323,878
72.26% of 50 DAV
50 DAV is 448,200
|
$23.05
-9.63%
|
8/9/2012
|
$21.30
|
PP = $23.10
|
|
MB = $24.26
|
Most Recent Note - 8/13/2012 3:55:20 PM
Y - Pulling back today with below average volume. Last week's gap up and rally above its 50 DMA line improved its technical stance. Reported earnings +67% on +39% sales revenues for the Jun '12 quarter. Pivot point cited is based on its 6/26/12 high plus 10 cents, and it still faces resistance up to the $23 level which has been a stubborn resistance area in recent months. Volume-driven gains above its pivot point are needed to trigger a proper technical buy signal.
>>> The latest Featured Stock Update with an annotated graph appeared on 7/24/2012. Click here.
View all notes |
Alert me of new notes |
CANSLIM.net Company Profile |
SEC |
Zacks Reports |
StockTalk |
News |
Chart |
Request a new note
C
A N
S L
I M
|
VSI
-
NYSE
Vitamin Shoppe Inc
SPECIALTY RETAIL - Specialty Retail, Other
|
$56.47
|
-1.20
-2.08% |
$57.69
|
538,791
142.88% of 50 DAV
50 DAV is 377,100
|
$61.83
-8.66%
|
6/29/2012
|
$54.93
|
PP = $55.03
|
|
MB = $57.78
|
Most Recent Note - 8/13/2012 3:58:16 PM
G - Down today with higher volume indicative of distributional pressure after getting extended from a sound base. Its 50 DMA line and upward trendline define near-term chart support to watch.
>>> The latest Featured Stock Update with an annotated graph appeared on 8/2/2012. Click here.
View all notes |
Alert me of new notes |
CANSLIM.net Company Profile |
SEC |
Zacks Reports |
StockTalk |
News |
Chart |
Request a new note
C
A N
S L
I M
|
Symbol/Exchange
Company Name
Industry Group |
PRICE |
CHANGE
(%Change) |
Day High |
Volume
(% DAV)
(% 50 day avg vol) |
52 Wk Hi
% From Hi |
Featured
Date |
Price
Featured |
Pivot Featured |
|
Max Buy |