You are not logged in.
This means you
CAN ONLY VIEW reports that were published prior to Tuesday, April 15, 2025.
You
MUST UPGRADE YOUR MEMBERSHIP if you want to see any current reports.
AFTER MARKET UPDATE - FRIDAY, AUGUST 10TH, 2012
Previous After Market Report Next After Market Report >>>
|
|
|
|
DOW |
+42.76 |
13,207.95 |
+0.32% |
|
Volume |
566,080,330 |
-2% |
|
Volume |
1,524,347,320 |
-7% |
|
NASDAQ |
+2.22 |
3,020.86 |
+0.07% |
|
Advancers |
1,620 |
52% |
|
Advancers |
1,093 |
42% |
|
S&P 500 |
+3.07 |
1,405.87 |
+0.22% |
|
Decliners |
1,377 |
44% |
|
Decliners |
1,371 |
53% |
|
Russell 2000 |
-1.35 |
801.55 |
-0.17% |
|
52 Wk Highs |
113 |
|
|
52 Wk Highs |
40 |
|
|
S&P 600 |
-0.49 |
451.65 |
-0.11% |
|
52 Wk Lows |
8 |
|
|
52 Wk Lows |
35 |
|
|
 |
Major Averages Close the Week With Quiet Gains
Kenneth J. Gruneisen - Passed the CAN SLIM® Master's Exam
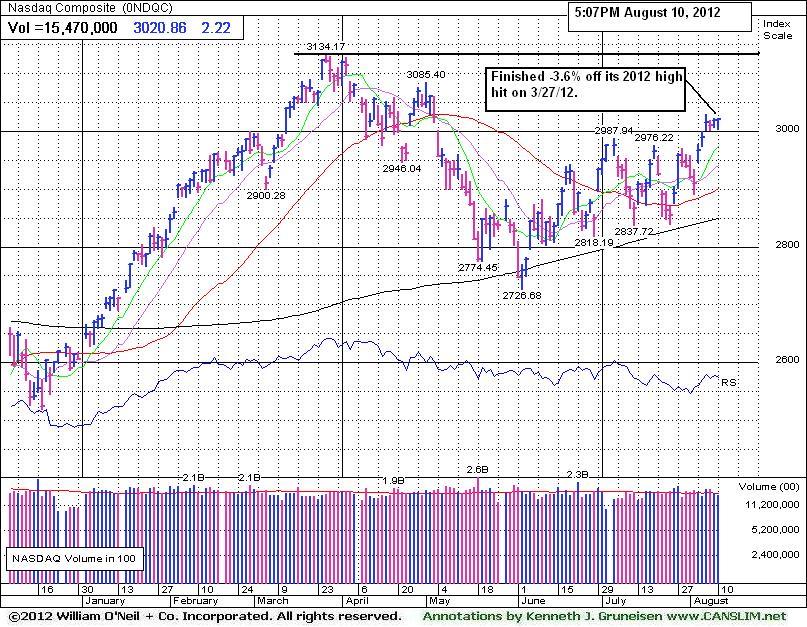
For the week, the Dow Jones Industrial Average rose +0.9%, the S&P 500 Index gained +1.1%, and the tech-heavy Nasdaq Composite Index posted a +1.8% gain. The major averages ended with small gains on Friday while the volume totals were lighter on the NYSE and on the Nasdaq exchange versus the prior session totals. Advancing issues led decliners by an 8-7 margin on the NYSE, but decliners led advancers by about a 7-5 margin on the Nasdaq exchange. The total number of new 52-week highs led new 52-week lows on the NYSE on the Nasdaq exchange, and the new lows total on the NYSE was in the single digits again. There were 23 high-ranked companies from the CANSLIM.net Leaders List made new 52-week highs and appeared on the CANSLIM.net BreakOuts Page, down from the prior session total of 34 stocks. There were gains for 9 of the 20 high-ranked companies currently included on the Featured Stocks Page.
Stocks were under pressure at Friday's opening bell after disappointing Chinese export data renewed concerns over global growth, however the major averages ended the session higher following a rally in the closing hour of trading.
Eight of the 10 sectors on the S&P finished higher. On the earnings front, Nordstrom (JWN +1.91%) rose after the company met expectations in their earnings and raised its full year sales forecast. Chip maker Nvidia Corp (NVDA -0.61%) ended with a small loss even after the company posted a better-than-expected profit tally and topped projections in their current quarter earnings guidance.
In other news, shares of Facebook Inc (FB +3.79%) rose after the company reported that time spent on the social website increased by 10% in July. Friday's gain helped Facebook avoid tallying a 5th consecutive weekly loss, however its shares finished -51.5% off their high hit on the date of its 5/18/12 IPO. English soccer team Manchester United Ltd (MANU) was little changed in its market debut. Research in Motion Ltd (RIMM +6.28%) rallied on a report IBM may be interested in the Blackberry maker's enterprise services unit. Monster Beverage Corp (MNST -11.32%) extended Thursday's losses after the company said it received a subpoena from a state attorney general regarding a probe into the advertising, marketing, and ingredients in its energy drinks.
Turning to fixed income, Treasuries were higher along the curve with the benchmark 10-year note higher by 9/32 to yield 1.66%.
The S&P 500 Index finished only -1.2% off its April 2, 2012 high and the Dow Jones Industrial Average ended -0.98% off its 5/01/12 high. In terms of the M criteria, the major indices recently have been in a confirmed rally coupled with an expansion in leadership (stocks hitting new 52-week highs).
Watch for an announcement soon via email concerning new monthly webcasts starting in August and a new "Market's Leading Groups" archives tab to be added on the Premium Member Homepage. These changes are aimed at satisfying member requests and improving the service. If you have questions, comments or suggestions please let us know via the inquiry form here. The most recent WEBCAST (Q2 2012) is available "ON DEMAND" - CLICK HERE.
PICTURED: The Nasdaq Composite Index ended -3.7% off its March 27, 2012 high hit 3/27/12.
|
 Kenneth J. Gruneisen started out as a licensed stockbroker in August 1987, a couple of months prior to the historic stock market crash that took the Dow Jones Industrial Average down -22.6% in a single day. He has published daily fact-based fundamental and technical analysis on high-ranked stocks online for two decades. Through FACTBASEDINVESTING.COM, Kenneth provides educational articles, news, market commentary, and other information regarding proven investment systems that work in good times and bad.
Comments contained in the body of this report are technical opinions only and are not necessarily those of Gruneisen Growth Corp. The material herein has been obtained from sources believed to be reliable and accurate, however, its accuracy and completeness cannot be guaranteed. Our firm, employees, and customers may effect transactions, including transactions contrary to any recommendation herein, or have positions in the securities mentioned herein or options with respect thereto. Any recommendation contained in this report may not be suitable for all investors and it is not to be deemed an offer or solicitation on our part with respect to the purchase or sale of any securities. |
|
 |
No Decisiveness Among Industry Groups
Kenneth J. Gruneisen - Passed the CAN SLIM® Master's Exam
There was no decisiveness on Friday for any of the industry groups regularly covered in this commentary. The Broker/Dealer Index ($XBD -0.79%) lost ground while the Bank Index ($BKX +0.06%) and the Healthcare Index ($HMO -0.01%) finished flat. The Retail Index ($RLX -0.39%) edged lower and the Networking Index ($NWX -0.30%) and Internet Index ($IIX -0.12%) had a slightly negative slant. Meanwhile, the Biotechnology Index ($BTK +0.48%) and the Semiconductor Index ($SOX +0.49%) led the tech sector gainers. Commodity-linked groups has a slightly positive bias as the Gold & Silver Index ($XAU +0.59%), Oil Services Index ($OSX +0.33%), and the Integrated Oil Index ($XOI +0.43%) posted modest gains.
Charts courtesy www.stockcharts.com
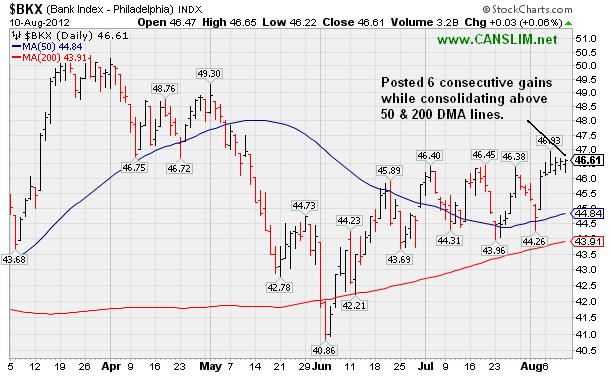
PICTURED 1: The Bank Index ($BKX +0.06%) inched higher for its 6th consecutive gain while consolidating above its 50-day and 200-day moving average (DMA) lines. Financial stocks are considered "leading indicators" so it will be important for the broader market outlook for the Bank Index to remain on an upward track above its long-term and short-term averages.
Charts courtesy www.stockcharts.com
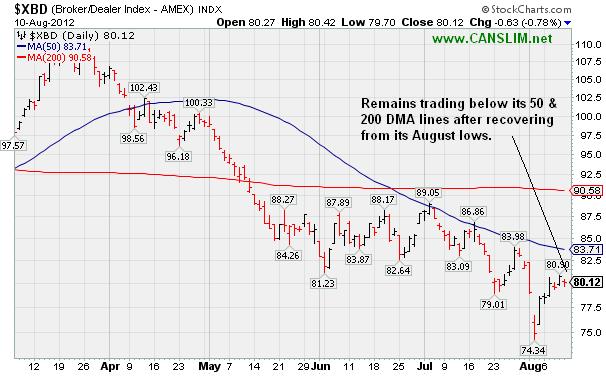
PICTURED 2: The Broker/Dealer Index ($XBD -0.79%) remains trading below its 50 & 200 DMA lines after recovering from its August lows. Its negative action has been an ongoing concern since slumping below its 50 DMA line in April.
| Oil Services |
$OSX |
228.88 |
+0.75 |
+0.33% |
+5.83% |
| Healthcare |
$HMO |
2,300.83 |
-0.21 |
-0.01% |
+0.84% |
| Integrated Oil |
$XOI |
1,244.56 |
+5.33 |
+0.43% |
+1.26% |
| Semiconductor |
$SOX |
405.96 |
+1.98 |
+0.49% |
+11.39% |
| Networking |
$NWX |
211.55 |
-0.63 |
-0.30% |
-1.68% |
| Internet |
$IIX |
312.05 |
-0.38 |
-0.12% |
+10.76% |
| Broker/Dealer |
$XBD |
80.12 |
-0.64 |
-0.79% |
-3.78% |
| Retail |
$RLX |
623.77 |
-2.47 |
-0.39% |
+19.22% |
| Gold & Silver |
$XAU |
158.37 |
+0.93 |
+0.59% |
-12.33% |
| Bank |
$BKX |
46.61 |
+0.03 |
+0.06% |
+18.36% |
| Biotech |
$BTK |
1,442.54 |
+6.95 |
+0.48% |
+32.17% |
|
|
|
 |
New 52-Week High Territory After Six Straight Gains
Kenneth J. Gruneisen - Passed the CAN SLIM® Master's Exam
Often, when a leading stock is setting up to breakout of a solid base it is highlighted in CANSLIM.net's Mid-Day Breakouts Report. The most relevant factors are noted in the report which alerts prudent CANSLIM oriented investors to place the issue in their watch list. After doing any necessary backup research, the investor is prepared to act after the stock triggers a technical buy signal (breaks above its pivot point on more than +50% average turnover) but before it gets too extended from a sound base. In the event the stock fails to trigger a technical buy signal and its price declines then it will simply be removed from the watch list. Disciplined investors know to buy as near as possible to the pivot point and avoid chasing stocks after they have rallied more than +5% above their pivot point. It is crucial to always limit losses whenever any stock heads the wrong direction, and disciplined investors sell if a struggling stock ever falls more than -7% from their purchase price.
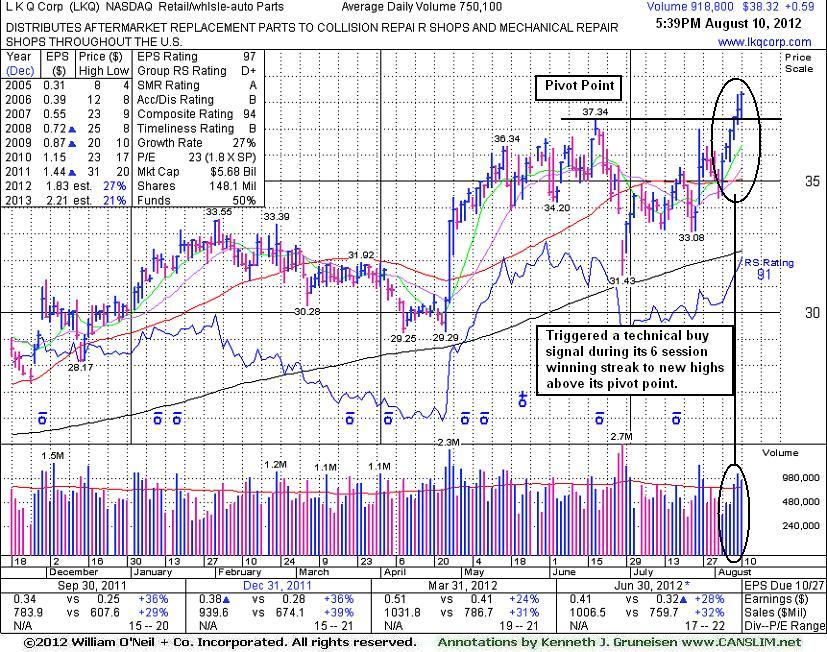
L K Q Corp (LKQ +$0.59 or +1.56% to $38.32) hit another new 52-week high today and finished near the session high with its 6th consecutive gain. The Retail/Wholesale - AutoParts firm was highlighted in yellow with pivot point based on its 6/19/12 high plus 10 cents when featured in the 8/09/12 mid-day report (read here). It finished that session with a gain backed by +55% above average volume while rising above its pivot point and triggering a technical buy signal.
It reported earnings +28% on +32% sales revenues for the Jun '12 quarter. Three of the past 4 quarters showed earnings increases above the +25% minimum guideline (C criteria). The company also has maintained a strong annual earnings (A criteria) growth history. It changed its ticker symbol (from LKQX) and found support above its 200 DMA line in recent months. It survived but failed to impress since dropped from the Featured Stocks list on 4/09/08.
One concern is the group's below average Group Relative Strength Rating (D+) while other leaders in the group have struggled in recent months. However, ownership by top-rated funds rose from 458 in Sep '11 to 547 in Jun '12, a reassuring sign concerning the I criteria.
|
|
|
Color Codes Explained :
Y - Better candidates highlighted by our
staff of experts.
G - Previously featured
in past reports as yellow but may no longer be buyable under the
guidelines.
***Last / Change / Volume data in this table is the closing quote data***
Symbol/Exchange
Company Name
Industry Group |
PRICE |
CHANGE
(%Change) |
Day High |
Volume
(% DAV)
(% 50 day avg vol) |
52 Wk Hi
% From Hi |
Featured
Date |
Price
Featured |
Pivot Featured |
|
Max Buy |
ALXN
-
NASDAQ
Alexion Pharmaceuticals
DRUGS - Drug Manufacturers - Other
|
$103.42
|
-0.21
-0.20% |
$104.31
|
622,981
37.97% of 50 DAV
50 DAV is 1,640,900
|
$109.96
-5.95%
|
5/1/2012
|
$91.73
|
PP = $95.11
|
|
MB = $99.87
|
Most Recent Note - 8/8/2012 4:05:52 PM
G - Holding its ground with volume totals cooling since last noted on 8/03/12 when it gapped up for a gain with above average volume. Chart support is defined by its 50 DMA line (now $98.11).
>>> The latest Featured Stock Update with an annotated graph appeared on 7/25/2012. Click here.
View all notes |
Alert me of new notes |
CANSLIM.net Company Profile |
SEC |
Zacks Reports |
StockTalk |
News |
Chart |
Request a new note
C
A N
S L
I M


|
ASPS
-
NASDAQ
Altisource Ptf Sltns Sa
REAL ESTATE - Property Management/Developmen
|
$83.60
|
-0.01
-0.01% |
$83.97
|
101,690
73.90% of 50 DAV
50 DAV is 137,600
|
$84.74
-1.35%
|
6/5/2012
|
$60.01
|
PP = $63.00
|
|
MB = $66.15
|
Most Recent Note - 8/8/2012 4:06:45 PM
G - Tallied a 9th consecutive gain today and hit another new high, getting more extended from its prior base. Recent low and its 50 DMA line define near-term support to watch.
>>> The latest Featured Stock Update with an annotated graph appeared on 8/3/2012. Click here.
View all notes |
Alert me of new notes |
CANSLIM.net Company Profile |
SEC |
Zacks Reports |
StockTalk |
News |
Chart |
Request a new note
C
A N
S L
I M
|
CFNL
-
NASDAQ
Cardinal Financial Corp
BANKING - Regional - Southeast Banks
|
$12.43
|
-0.09
-0.72% |
$12.53
|
72,663
94.12% of 50 DAV
50 DAV is 77,200
|
$13.21
-5.90%
|
7/20/2012
|
$12.85
|
PP = $12.41
|
|
MB = $13.03
|
Most Recent Note - 8/7/2012 4:24:18 PM
Y - Rebounded further above its pivot point with today's gain on +20% above average volume. Its 50 DMA line and prior chart highs define important near-term support to watch.
>>> The latest Featured Stock Update with an annotated graph appeared on 7/26/2012. Click here.
View all notes |
Alert me of new notes |
CANSLIM.net Company Profile |
SEC |
Zacks Reports |
StockTalk |
News |
Chart |
Request a new note
C
A N
S L
I M
|
CMCSA
-
NASDAQ
Comcast Corp Cl A
MEDIA - CATV Systems
|
$34.73
|
+0.18
0.52% |
$34.75
|
7,897,138
54.43% of 50 DAV
50 DAV is 14,508,900
|
$35.16
-1.22%
|
6/11/2012
|
$29.94
|
PP = $30.98
|
|
MB = $32.53
|
Most Recent Note - 8/7/2012 11:03:32 AM
G - Hit another new 52-week high today, getting more extended from its prior base with a streak of recent gains backed by above average volume. Gapped up on 8/01/12 after reporting earnings +19% on +6% sales revenues for the Jun '12 quarter, below the fact-based investment system's +25% minimum guideline for the C criteria, but better than Street expectations.
>>> The latest Featured Stock Update with an annotated graph appeared on 7/11/2012. Click here.
View all notes |
Alert me of new notes |
CANSLIM.net Company Profile |
SEC |
Zacks Reports |
StockTalk |
News |
Chart |
Request a new note
C
A N
S L
I M
|
DG
-
NYSE
Dollar General Corp
RETAIL - Discount, Variety Stores
|
$51.77
|
+0.42
0.82% |
$51.96
|
1,971,865
49.68% of 50 DAV
50 DAV is 3,969,200
|
$56.04
-7.62%
|
7/16/2012
|
$54.68
|
PP = $56.14
|
|
MB = $58.95
|
Most Recent Note - 8/7/2012 11:00:14 AM
G - Consolidating near its 50 DMA line with volume totals cooling in recent weeks after encountering distributional pressure.
>>> The latest Featured Stock Update with an annotated graph appeared on 7/12/2012. Click here.
View all notes |
Alert me of new notes |
CANSLIM.net Company Profile |
SEC |
Zacks Reports |
StockTalk |
News |
Chart |
Request a new note
C
A N
S L
I M
|
Symbol/Exchange
Company Name
Industry Group |
PRICE |
CHANGE
(%Change) |
Day High |
Volume
(% DAV)
(% 50 day avg vol) |
52 Wk Hi
% From Hi |
Featured
Date |
Price
Featured |
Pivot Featured |
|
Max Buy |
ECPG
-
NASDAQ
Encore Capital Group Inc
FINANCIAL SERVICES - Credit Services
|
$28.32
|
-0.18
-0.63% |
$28.59
|
70,907
44.40% of 50 DAV
50 DAV is 159,700
|
$30.47
-7.06%
|
8/3/2012
|
$29.91
|
PP = $30.45
|
|
MB = $31.97
|
Most Recent Note - 8/8/2012 12:04:47 PM
Y - Gapped down today, retreating to its 50 DMA line with a large loss on above average volume. A volume-driven gain and close above its pivot point may trigger a technical buy signal, meanwhile, subsequent deterioration below its 50 DMA line and recent lows would raise more serious concerns. See the latest FSU analysis for more details and a new annotated graph.
>>> The latest Featured Stock Update with an annotated graph appeared on 8/6/2012. Click here.
View all notes |
Alert me of new notes |
CANSLIM.net Company Profile |
SEC |
Zacks Reports |
StockTalk |
News |
Chart |
Request a new note
C
A N
S L
I M
|
EXPE
-
NASDAQ
Expedia Inc
INTERNET - Internet Information Providers
|
$54.44
|
-1.52
-2.72% |
$55.99
|
3,323,284
84.38% of 50 DAV
50 DAV is 3,938,700
|
$59.50
-8.50%
|
4/27/2012
|
$41.80
|
PP = $35.57
|
|
MB = $37.35
|
 Most Recent Note - 8/10/2012 1:00:58 PM
G - Down today for a 3rd losing session in a row after its 8/08/12 gap down amid weakness in travel-related stocks after Priceline.com Inc (PCLN) and Orbitz Worldwide Inc (OWW) reported disappointing results. EXPE recently reported earnings +24% on +14% sales revenues for the quarter ending June 30, 2012 versus the year ago period, just below the +25% minimum earnings guideline for buy candidates.
>>> The latest Featured Stock Update with an annotated graph appeared on 7/10/2012. Click here.
View all notes |
Alert me of new notes |
CANSLIM.net Company Profile |
SEC |
Zacks Reports |
StockTalk |
News |
Chart |
Request a new note
C
A N
S L
I M
|
GNC
-
NYSE
G N C Holdings Inc
RETAIL - Drug Stores
|
$37.92
|
-1.26
-3.22% |
$39.61
|
8,059,041
322.00% of 50 DAV
50 DAV is 2,502,800
|
$42.70
-11.19%
|
6/29/2012
|
$39.20
|
PP = $40.00
|
|
MB = $42.00
|
Most Recent Note - 8/10/2012 12:59:22 PM
G - Down today with above average volume while slumping below its 50 DMA line raising concerns, and its color code is changed to green. Reported earnings +59% on +19% sales revenues for the quarter ended June 30, 2012 versus the year ago period, beating expectations, and it also raised guidance for FY '12.
>>> The latest Featured Stock Update with an annotated graph appeared on 8/8/2012. Click here.
View all notes |
Alert me of new notes |
CANSLIM.net Company Profile |
SEC |
Zacks Reports |
StockTalk |
News |
Chart |
Request a new note
C
A N
S L
I M
|
GPX
-
NYSE
G P Strategies Corp
DIVERSIFIED SERVICES - Education and Training Services
|
$18.66
|
-0.09
-0.48% |
$18.80
|
33,211
51.09% of 50 DAV
50 DAV is 65,000
|
$20.08
-7.07%
|
6/29/2012
|
$18.01
|
PP = $18.15
|
|
MB = $19.06
|
Most Recent Note - 8/7/2012 6:01:07 PM
G - Perched at its 52-week high after 4 consecutive volume-driven gains. See the latest FSU analysis for more details and a new annotated graph.
>>> The latest Featured Stock Update with an annotated graph appeared on 8/7/2012. Click here.
View all notes |
Alert me of new notes |
CANSLIM.net Company Profile |
SEC |
Zacks Reports |
StockTalk |
News |
Chart |
Request a new note
C
A N
S L
I M
|
HMSY
-
NASDAQ
H M S Holdings Corp
COMPUTER SOFTWARE and SERVICES - Healthcare Information Service
|
$35.90
|
+0.27
0.76% |
$36.06
|
584,004
64.83% of 50 DAV
50 DAV is 900,800
|
$36.35
-1.24%
|
7/27/2012
|
$33.91
|
PP = $34.83
|
|
MB = $36.57
|
Most Recent Note - 8/8/2012 4:09:28 PM
Y - Touched a new 52-week high today with below average volume behind its 5th consecutive gain. Gains above a stock's pivot point must have at least +40% above average volume, preferably greater, to trigger a proper technical buy signal.
>>> The latest Featured Stock Update with an annotated graph appeared on 7/27/2012. Click here.
View all notes |
Alert me of new notes |
CANSLIM.net Company Profile |
SEC |
Zacks Reports |
StockTalk |
News |
Chart |
Request a new note
C
A N
S L
I M
|
Symbol/Exchange
Company Name
Industry Group |
PRICE |
CHANGE
(%Change) |
Day High |
Volume
(% DAV)
(% 50 day avg vol) |
52 Wk Hi
% From Hi |
Featured
Date |
Price
Featured |
Pivot Featured |
|
Max Buy |
LKQ
-
NASDAQ
L K Q Corp
WHOLESALE - Auto Parts
|
$38.32
|
+0.59
1.56% |
$38.42
|
918,853
122.50% of 50 DAV
50 DAV is 750,100
|
$38.31
0.03%
|
8/9/2012
|
$37.93
|
PP = $37.44
|
|
MB = $39.31
|
Most Recent Note - 8/10/2012 6:01:47 PM
Y - Hit a new 52-week high today with its 6th consecutive gain. Its prior gain with +55% above average volume while rising above its pivot point triggered a technical buy signal. See the latest FSU analysis for more details and an annotated graph.
>>> The latest Featured Stock Update with an annotated graph appeared on 8/10/2012. Click here.
View all notes |
Alert me of new notes |
CANSLIM.net Company Profile |
SEC |
Zacks Reports |
StockTalk |
News |
Chart |
Request a new note
C
A N
S L
I M
|
MIDD
-
NASDAQ
Middleby Corp
MANUFACTURING - Diversified Machinery
|
$113.81
|
+0.04
0.04% |
$115.42
|
225,873
231.19% of 50 DAV
50 DAV is 97,700
|
$119.74
-4.95%
|
8/9/2012
|
$118.60
|
PP = $104.92
|
|
MB = $110.17
|
Most Recent Note - 8/10/2012 12:31:17 PM
Y - Holding its ground today. On the prior session it was highlighted in yellow with pivot point cited based on its 5/22/12 high plus 10 cents as it gapped up for a new 52-week and all-time high, breaking out from a long flat base with 9 times average volume. Reported earnings +58% on +23% sales revenues for the Jun '12 quarter. A "breakaway gap" is one noted exception when buying more than +5% above prior highs is permitted under the fact-based system, however risk increases the further one chases a stock above its pivot point. Recent quarterly comparisons show strong sales and earnings reasonably meeting the C criteria. Its annual earnings (A criteria) had a downturn in FY '09, yet they have otherwise been good and steady.

>>> The latest Featured Stock Update with an annotated graph appeared on 1/19/2006. Click here.
View all notes |
Alert me of new notes |
CANSLIM.net Company Profile |
SEC |
Zacks Reports |
StockTalk |
News |
Chart |
Request a new note
C
A N
S L
I M
|
N
-
NYSE
Netsuite Inc
DIVERSIFIED SERVICES - Business/Management Services
|
$57.25
|
-0.24
-0.42% |
$57.80
|
446,378
59.67% of 50 DAV
50 DAV is 748,100
|
$59.22
-3.33%
|
6/20/2012
|
$51.83
|
PP = $51.88
|
|
MB = $54.47
|
Most Recent Note - 8/8/2012 4:10:23 PM
G - Perched near its 52-week high, holding its ground with volume totals cooling. Found support near its 50 DMA line when encountering recent distributional pressure.
>>> The latest Featured Stock Update with an annotated graph appeared on 7/19/2012. Click here.
View all notes |
Alert me of new notes |
CANSLIM.net Company Profile |
SEC |
Zacks Reports |
StockTalk |
News |
Chart |
Request a new note
C
A N
S L
I M
|
NSM
-
NYSE
Nationstar Mtg Hldgs Inc
FINANCIAL SERVICES - Credit Services
|
$25.63
|
+0.53
2.11% |
$25.71
|
505,238
63.65% of 50 DAV
50 DAV is 793,800
|
$25.43
0.79%
|
6/27/2012
|
$20.29
|
PP = $20.46
|
|
MB = $21.48
|
Most Recent Note - 8/8/2012 4:00:48 PM
G - Today's gain on light volume led to its best-ever close. It is not near a sound base. Recently found support above prior highs and its 50 DMA line in the $20 area.
>>> The latest Featured Stock Update with an annotated graph appeared on 8/1/2012. Click here.
View all notes |
Alert me of new notes |
CANSLIM.net Company Profile |
SEC |
Zacks Reports |
StockTalk |
News |
Chart |
Request a new note
C
A N
S L
I M
|
OSIS
-
NASDAQ
O S I Systems Inc
ELECTRONICS - Semiconductor Equipment and Mate
|
$71.50
|
+0.24
0.34% |
$72.47
|
176,067
160.35% of 50 DAV
50 DAV is 109,800
|
$71.44
0.08%
|
8/9/2012
|
$67.71
|
PP = $67.48
|
|
MB = $70.85
|
Most Recent Note - 8/10/2012 12:38:31 PM
Y - Holding its ground today, trading near and above its "max buy" level. Finished strong after it was highlighted in yellow in the 8/09/12 mid-day report (read here). Reported earnings +44% on +28% sales revenues for the quarter ended June 30, 2012 versus the year ago period. Its considerable gain was backed by nearly 6 times average volume as it triggered a technical buy signal. See the latest FSU analysis for more details and a new annotated graph.
>>> The latest Featured Stock Update with an annotated graph appeared on 8/9/2012. Click here.
View all notes |
Alert me of new notes |
CANSLIM.net Company Profile |
SEC |
Zacks Reports |
StockTalk |
News |
Chart |
Request a new note
C
A N
S L
I M
|
Symbol/Exchange
Company Name
Industry Group |
PRICE |
CHANGE
(%Change) |
Day High |
Volume
(% DAV)
(% 50 day avg vol) |
52 Wk Hi
% From Hi |
Featured
Date |
Price
Featured |
Pivot Featured |
|
Max Buy |
RNF
-
NYSE
Rentech Nitrogen Ptnr Lp
CHEMICALS - Agricultural Chemicals
|
$32.16
|
-0.28
-0.86% |
$34.48
|
1,175,136
293.05% of 50 DAV
50 DAV is 401,000
|
$33.35
-3.57%
|
7/27/2012
|
$29.58
|
PP = $30.60
|
|
MB = $32.13
|
Most Recent Note - 8/10/2012 12:50:40 PM
G - Up today for another new 52-week high, getting more extended from its prior base. Triggered a technical buy signal with its considerable 8/07/12 gain backed by +266% above average volume as it rallied above its pivot point into new high territory.
>>> The latest Featured Stock Update with an annotated graph appeared on 7/31/2012. Click here.
View all notes |
Alert me of new notes |
CANSLIM.net Company Profile |
SEC |
Zacks Reports |
StockTalk |
News |
Chart |
Request a new note
C
A N
S L
I M
|
SWI
-
NYSE
Solarwinds Inc
COMPUTER SOFTWARE and SERVICES - Application Software
|
$55.02
|
-0.47
-0.85% |
$55.34
|
702,764
55.77% of 50 DAV
50 DAV is 1,260,100
|
$56.80
-3.13%
|
7/25/2012
|
$47.82
|
PP = $47.89
|
|
MB = $50.28
|
Most Recent Note - 8/10/2012 4:35:28 PM
G - Pulling back from its all-time high today with a 3rd consecutive loss on light volume. Prior highs in the $48 area define initial support to watch on pullbacks.
>>> The latest Featured Stock Update with an annotated graph appeared on 7/30/2012. Click here.
View all notes |
Alert me of new notes |
CANSLIM.net Company Profile |
SEC |
Zacks Reports |
StockTalk |
News |
Chart |
Request a new note
C
A N
S L
I M
|
TDG
-
NYSE
Transdigm Group Inc
AEROSPACE/DEFENSE - Aerospace/Defense Products and; Services
|
$127.50
|
+0.50
0.39% |
$128.00
|
356,168
75.25% of 50 DAV
50 DAV is 473,300
|
$136.34
-6.48%
|
6/18/2012
|
$127.00
|
PP = $132.79
|
|
MB = $139.43
|
Most Recent Note - 8/7/2012 10:56:59 AM
G - Reported earnings +55% on +42% sales revenues for the quarter ended June 30, 2012 versus the year ago period. Gapped up today and traded above its 50 DMA line. Recent lows in the $117-118 are define near-term support above its 200 DMA line.
>>> The latest Featured Stock Update with an annotated graph appeared on 7/18/2012. Click here.
View all notes |
Alert me of new notes |
CANSLIM.net Company Profile |
SEC |
Zacks Reports |
StockTalk |
News |
Chart |
Request a new note
C
A N
S L
I M
|
TNGO
-
NASDAQ
Tangoe Inc
COMPUTER SOFTWARE and SERVICES - Technical and System Software
|
$21.43
|
+0.03
0.14% |
$21.66
|
328,124
67.67% of 50 DAV
50 DAV is 484,900
|
$23.05
-7.03%
|
8/9/2012
|
$21.30
|
PP = $23.10
|
|
MB = $24.26
|
Most Recent Note - 8/9/2012 1:37:21 PM
Y - Gapped up above its 50 DMA line today, improving its technical stance with a volume-driven gain. Reported earnings +67% on +39% sales revenues for the Jun '12 quarter. Color code is changed to yellow again as it returns to the Featured Stocks list with a new pivot point cited based on its 6/26/12 high plus 10 cents. It still faces resistance up to the $23 level which has been a stubborn resistance area in recent months. Volume-driven gains above its pivot point are needed to trigger a proper technical buy signal.
>>> The latest Featured Stock Update with an annotated graph appeared on 7/24/2012. Click here.
View all notes |
Alert me of new notes |
CANSLIM.net Company Profile |
SEC |
Zacks Reports |
StockTalk |
News |
Chart |
Request a new note
C
A N
S L
I M
|
VSI
-
NYSE
Vitamin Shoppe Inc
SPECIALTY RETAIL - Specialty Retail, Other
|
$57.67
|
-2.18
-3.64% |
$59.68
|
276,047
73.65% of 50 DAV
50 DAV is 374,800
|
$61.83
-6.72%
|
6/29/2012
|
$54.93
|
PP = $55.03
|
|
MB = $57.78
|
Most Recent Note - 8/10/2012 1:03:26 PM
G - Retreating from all-time highs yet still trading just above its "max buy" level. Its 50 DMA line and upward trendline define near-term chart support to watch.
>>> The latest Featured Stock Update with an annotated graph appeared on 8/2/2012. Click here.
View all notes |
Alert me of new notes |
CANSLIM.net Company Profile |
SEC |
Zacks Reports |
StockTalk |
News |
Chart |
Request a new note
C
A N
S L
I M
|
Symbol/Exchange
Company Name
Industry Group |
PRICE |
CHANGE
(%Change) |
Day High |
Volume
(% DAV)
(% 50 day avg vol) |
52 Wk Hi
% From Hi |
Featured
Date |
Price
Featured |
Pivot Featured |
|
Max Buy |
|
|
|
THESE ARE NOT BUY RECOMMENDATIONS!
Comments contained in the body of this report are technical
opinions only. The material herein has been obtained
from sources believed to be reliable and accurate, however,
its accuracy and completeness cannot be guaranteed.
This site is not an investment advisor, hence it does
not endorse or recommend any securities or other investments.
Any recommendation contained in this report may not
be suitable for all investors and it is not to be deemed
an offer or solicitation on our part with respect to
the purchase or sale of any securities. All trademarks,
service marks and trade names appearing in this report
are the property of their respective owners, and are
likewise used for identification purposes only.
This report is a service available
only to active Paid Premium Members.
You may opt-out of receiving report notifications
at any time. Questions or comments may be submitted
by writing to Premium Membership Services 665 S.E. 10 Street, Suite 201 Deerfield Beach, FL 33441-5634 or by calling 1-800-965-8307
or 954-785-1121.
|
|
|

