You are not logged in.
This means you
CAN ONLY VIEW reports that were published prior to Monday, April 14, 2025.
You
MUST UPGRADE YOUR MEMBERSHIP if you want to see any current reports.
AFTER MARKET UPDATE - FRIDAY, AUGUST 12TH, 2011
Previous After Market Report Next After Market Report >>>
|
|
|
|
DOW |
+126.16 |
11,269.47 |
+1.13% |
|
Volume |
1,256,147,150 |
-33% |
|
Volume |
2,189,175,550 |
-29% |
|
NASDAQ |
+15.30 |
2,507.98 |
+0.61% |
|
Advancers |
1,938 |
62% |
|
Advancers |
1,342 |
50% |
|
S&P 500 |
+6.17 |
1,178.81 |
+0.53% |
|
Decliners |
1,118 |
36% |
|
Decliners |
1,247 |
46% |
|
Russell 2000 |
+1.62 |
697.51 |
+0.23% |
|
52 Wk Highs |
7 |
|
|
52 Wk Highs |
4 |
|
|
S&P 600 |
+1.41 |
380.86 |
+0.37% |
|
52 Wk Lows |
19 |
|
|
52 Wk Lows |
44 |
|
|
 |
Major Averages Post Smaller, Quieter Gains After Volatile Week
Kenneth J. Gruneisen - Passed the CAN SLIM® Master's Exam
All of the indices finished near the high end of wide trading ranges while for the week the Dow lost -1.5%, the S&P 500 was down -1.7%, and the Nasdaq Composite fell -1%. The volume totals on Friday were much lighter on the NYSE and on the Nasdaq exchange versus the prior session while the major averages closed with tame gains compared to the wild intra-day volatility recently endured. Advancing issues led decliners by 3-2 on the NYSE but by a narrow 13-12 ratio on the Nasdaq exchange. The new 52-week lows totals have steadily contracted from Tuesday's inflated total of 1,282 on the NYSE and 725 on the Nasdaq exchange. However, on Friday new 52-week lows still outnumbered new 52-week highs on the NYSE and on the Nasdaq exchange while the new 52-week highs totals remained in the single digits on both exchanges for a 6th consecutive session. Only 6 high-ranked companies from the CANSLIM.net Leaders List made new 52-week highs and appeared on the CANSLIM.net BreakOuts Page, up from the prior session's total of 3 stocks. Gains were posted by 6 of the 7 high-ranked leaders currently included on the Featured Stocks Page.
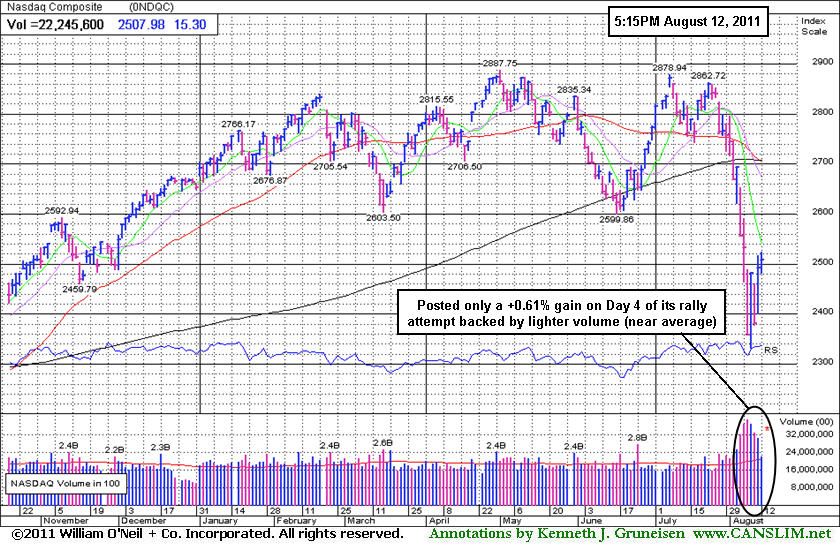
The quiet session completed Day 4 of a new rally effort after the Dow and S&P 500 hit 11-month lows on Tuesday (not Wednesday). An encouraging report on retail sales offset a gloomy survey on consumer confidence. July retail sales rose 0.5%, the biggest gain in four months. The August consumer sentiment index from the University of Michigan was the lowest reading in thirty years. The mood improved in Europe, soothing nerves in New York. European markets advanced after France, Italy, Spain and Belgium announced they will impose or extend bans on short-selling in response to high volatility.
Caterpillar Inc (CAT +2.9%) was one of the leaders in the Dow Industrials after its chief executive said he expects a record year. Department store stocks suffered different fates. Nordstrom Inc (JWN +4.6%) rose after earnings beat estimates, but results at Dillard's Inc (DDS -18.21%) were poorly received.
Disciplined investors are maintaining a watchlist and waiting for a new rally confirmed by a solid follow-through day (FTD) before any new buying efforts are considered. A considerable higher-volume gain between Day 4 and Day 7 from at least one of the major averages is the ideal FTD confirmation that institutional buying demand has returned in a meaningful way. Meanwhile, the market environment (M criteria) argues for investors to remain cautious and preserve cash on the safe sidelines, staying away from potential harm!
The August 2011 issue of CANSLIM.net News will be published soon! Links to all prior reports are available on the Premium Member Homepage.
PICTURED: The Nasdaq Composite Index posted only a +0.61% gain on Day 4 of its rally attempt backed by lighter volume (near average).
|
 Kenneth J. Gruneisen started out as a licensed stockbroker in August 1987, a couple of months prior to the historic stock market crash that took the Dow Jones Industrial Average down -22.6% in a single day. He has published daily fact-based fundamental and technical analysis on high-ranked stocks online for two decades. Through FACTBASEDINVESTING.COM, Kenneth provides educational articles, news, market commentary, and other information regarding proven investment systems that work in good times and bad.
Comments contained in the body of this report are technical opinions only and are not necessarily those of Gruneisen Growth Corp. The material herein has been obtained from sources believed to be reliable and accurate, however, its accuracy and completeness cannot be guaranteed. Our firm, employees, and customers may effect transactions, including transactions contrary to any recommendation herein, or have positions in the securities mentioned herein or options with respect thereto. Any recommendation contained in this report may not be suitable for all investors and it is not to be deemed an offer or solicitation on our part with respect to the purchase or sale of any securities. |
|
 |
Retail Index Fell -18% From 2011 High
Kenneth J. Gruneisen - Passed the CAN SLIM® Master's Exam
Financial shares were Friday's laggards while the Bank Index ($BKX -2.13%) and Broker/Dealer Index ($XBD -1.32%) each gave back a portion of their Thursday gains. The Gold & Silver Index ($XAU -1.01%) also ended lower. The Biotechnology Index ($BTK +2.37%), Internet Index ($IIX +1.19%), and Networking Index ($NWX +0.73%) posted gains while the Semiconductor Index ($SOX -0.42%) lost ground. The Retail Index ($RLX +1.48%) and Healthcare Index ($HMO +1.72%) posted gains. Strength in energy-related shares boosted the Oil Services Index ($OSX +1.31%) and Integrated Oil Index ($XOI +0.85%) up from 10-month and 11-month lows.
Charts courtesy www.stockcharts.com
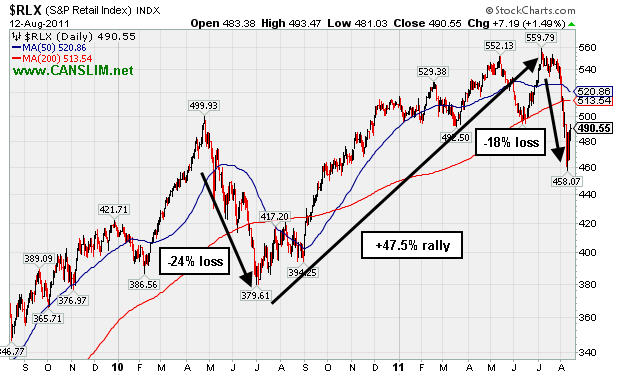
PICTURED: The Retail Index ($RLX +1.48%) lost -24% during the April - July 2010 correction, then rallied +47.5% higher. Since it peaked in July it fell as much as -18%, almost putting the Retail Index in "Bear Market" territory, however it ended Friday's session well above the past week's low.
| Oil Services |
$OSX |
233.99 |
+3.02 |
+1.31% |
-4.54% |
| Healthcare |
$HMO |
1,949.50 |
+33.05 |
+1.72% |
+15.22% |
| Integrated Oil |
$XOI |
1,129.01 |
+9.50 |
+0.85% |
-6.94% |
| Semiconductor |
$SOX |
355.62 |
-1.50 |
-0.42% |
-13.65% |
| Networking |
$NWX |
241.77 |
+1.76 |
+0.73% |
-13.83% |
| Internet |
$IIX |
282.01 |
+3.32 |
+1.19% |
-8.36% |
| Broker/Dealer |
$XBD |
89.73 |
-1.20 |
-1.32% |
-26.16% |
| Retail |
$RLX |
489.62 |
+6.26 |
+1.30% |
-3.69% |
| Gold & Silver |
$XAU |
206.55 |
-2.10 |
-1.01% |
-8.84% |
| Bank |
$BKX |
37.68 |
-0.88 |
-2.28% |
-27.83% |
| Biotech |
$BTK |
1,129.36 |
+26.13 |
+2.37% |
-12.97% |
|
|
|
 |
Overhead Supply May Act As Resistance
Kenneth J. Gruneisen - Passed the CAN SLIM® Master's Exam
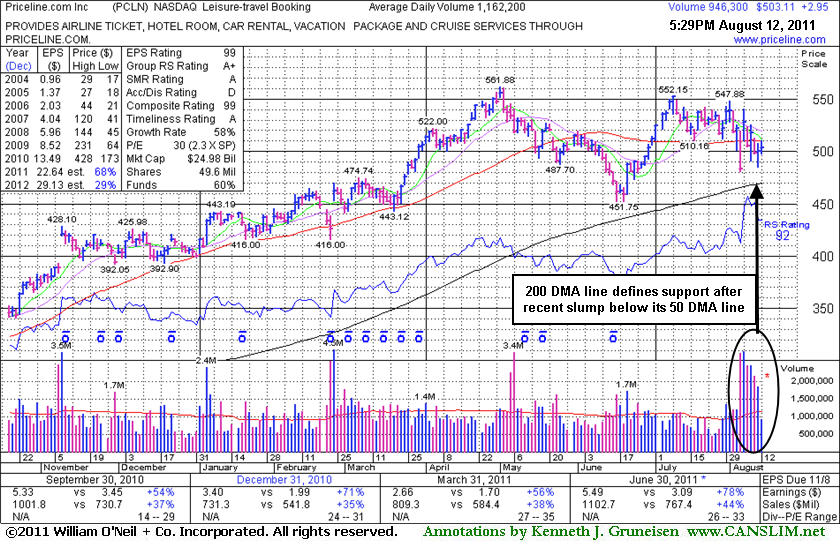
Priceline.com Inc. (PCLN +$2.95 or +0.59% to $503.11) remains under its 50-day moving average (DMA) line and has been unable to make headway above that important short-term average this week. In the 7/29/11 mid-day report its color code was changed to yellow with pivot point cited based on its 7/08/11 high ($552.15). Now it is consolidating -10.5% off its 52-week high, and yet it remains a worthy candidate for investors' watchlists. Meanwhile, the 200 DMA line and recent chart lows define the next important support to watch. Following its last appearance in this FSU section on 8/01/11 under the headline, "Strong Leisure - Travel Booking Firm Due to Report Earnings", it announced earnings +78% on +44% sales revenues (an impressive sequential acceleration) for the latest quarter ended June 30, 2011 versus the year ago period. That marked a
The company has maintained a stellar earnings history that satisfies the C and A criteria. Keep in mind, the investment system's biggest winning models were typically held by at least a few mutual funds and attracting many others. However, once a stock is very heavily owned by a long list of mutual funds, as is now the case with PCLN, investors should be especially cautious and alert for any technical sell signals or fundamental disappointments which could prompt a rush for the exits. The number of top-rated funds owning its shares rose from 1,351 in Sep '10 to 1,596 in June '11, and increasing interest is an encouraging sign concerning the I criteria.
Eventually a convincing volume-driven breakout could trigger a fresh new (or add-on) technical buy signal, but for now it needs to work its way up through overhead supply into the $550 area. Also, the M criteria may override all other promising criteria, since 3 out of 4 stocks follow the direction of the major averages.
|
|
|
Color Codes Explained :
Y - Better candidates highlighted by our
staff of experts.
G - Previously featured
in past reports as yellow but may no longer be buyable under the
guidelines.
***Last / Change / Volume data in this table is the closing quote data***
Symbol/Exchange
Company Name
Industry Group |
PRICE |
CHANGE
(%Change) |
Day High |
Volume
(% DAV)
(% 50 day avg vol) |
52 Wk Hi
% From Hi |
Featured
Date |
Price
Featured |
Pivot Featured |
|
Max Buy |
EXLS
-
NASDAQ
Exlservice Holdings Inc
DIVERSIFIED SERVICES - Business/Management Services
|
$24.43
|
+0.12
0.49% |
$24.74
|
98,880
124.22% of 50 DAV
50 DAV is 79,600
|
$26.46
-7.67%
|
8/2/2011
|
$24.85
|
PP = $24.85
|
|
MB = $26.09
|
Most Recent Note - 8/11/2011 4:15:01 PM
Y - Down for its 4th loss with above average volume in the span of 5 sessions. Its retreat below its pivot point since its 8/03/11 breakout raises some concerns. Its 50 DMA line (now $23.22) defines important support to watch.
>>> The latest Featured Stock Update with an annotated graph appeared on 8/2/2011. Click here.
View all notes |
Alert me of new notes |
CANSLIM.net Company Profile |
SEC |
Zacks Reports |
StockTalk |
News |
Chart |
Request a new note
C
A N
S L
I M


|
FCFS
-
NASDAQ
First Cash Financial Svs
SPECIALTY RETAIL - Specialty Retail, Other
|
$46.79
|
+1.82
4.05% |
$47.13
|
622,421
226.01% of 50 DAV
50 DAV is 275,400
|
$46.42
0.80%
|
5/31/2011
|
$42.00
|
PP = $40.23
|
|
MB = $42.24
|
 Most Recent Note - 8/12/2011 12:32:58 PM
G - Up today for a 4th consecutive volume-driven gain, hitting a new 52-week high. Prior chart lows near $37-38 define support to watch above its 200 DMA line.
>>> The latest Featured Stock Update with an annotated graph appeared on 8/9/2011. Click here.
View all notes |
Alert me of new notes |
CANSLIM.net Company Profile |
SEC |
Zacks Reports |
StockTalk |
News |
Chart |
Request a new note
C
A N
S L
I M
|
JCOM
-
NASDAQ
J 2 Global Communication
INTERNET - Internet Software and Services
|
$28.89
|
+0.21
0.73% |
$29.20
|
218,385
68.29% of 50 DAV
50 DAV is 319,800
|
$31.72
-8.92%
|
8/8/2011
|
$30.38
|
PP = $29.31
|
|
MB = $30.78
|
Most Recent Note - 8/11/2011 4:19:21 PM
G - Consolidating near its 50 and 200 DMA lines, churning a lot of volume without making progress since its 8/03/11 gap up.
>>> The latest Featured Stock Update with an annotated graph appeared on 8/8/2011. Click here.
View all notes |
Alert me of new notes |
CANSLIM.net Company Profile |
SEC |
Zacks Reports |
StockTalk |
News |
Chart |
Request a new note
C
A N
S L
I M
|
MA
-
NYSE
Mastercard Inc Cl A
DIVERSIFIED SERVICES - Business/Management Services
|
$328.07
|
+0.68
0.21% |
$332.72
|
1,299,766
89.83% of 50 DAV
50 DAV is 1,446,900
|
$340.42
-3.63%
|
8/3/2011
|
$324.82
|
PP = $322.38
|
|
MB = $338.50
|
Most Recent Note - 8/11/2011 4:24:02 PM
G - Considerable gain today with above average volume, rallying back above the previously cited pivot point to its second-best close. Color code was changed to green after it negated a powerful 8/03/11 technical breakout. Wider than usual intra-day price swings indicate uncertainty, plus the M criteria remains a concern until a new confirmed rally is noted.
>>> The latest Featured Stock Update with an annotated graph appeared on 8/3/2011. Click here.
View all notes |
Alert me of new notes |
CANSLIM.net Company Profile |
SEC |
Zacks Reports |
StockTalk |
News |
Chart |
Request a new note
C
A N
S L
I M
|
MG
-
NYSE
Mistras Group Inc
DIVERSIFIED SERVICES - Bulding and Faci;ity Management Services
|
$18.99
|
+1.24
6.99% |
$19.42
|
460,353
383.63% of 50 DAV
50 DAV is 120,000
|
$18.46
2.87%
|
8/10/2011
|
$17.89
|
PP = $17.58
|
|
MB = $18.46
|
Most Recent Note - 8/12/2011 12:38:26 PM
G - Gapped up today and hit a new 52-week high with a 4th consecutive gain backed by above average volume. Trading above its "max buy" level, its color code was changed to green after getting extended more than +5% above its pivot point. See the latest FSU analysis for more details and a new annotated weekly graph.
>>> The latest Featured Stock Update with an annotated graph appeared on 8/11/2011. Click here.
View all notes |
Alert me of new notes |
CANSLIM.net Company Profile |
SEC |
Zacks Reports |
StockTalk |
News |
Chart |
Request a new note
C
A N
S L
I M
|
Symbol/Exchange
Company Name
Industry Group |
PRICE |
CHANGE
(%Change) |
Day High |
Volume
(% DAV)
(% 50 day avg vol) |
52 Wk Hi
% From Hi |
Featured
Date |
Price
Featured |
Pivot Featured |
|
Max Buy |
MKTX
-
NASDAQ
Marketaxess Holdings Inc
FINANCIAL SERVICES - Investment Brokerage - Nationa
|
$24.16
|
-0.50
-2.03% |
$24.86
|
177,535
112.51% of 50 DAV
50 DAV is 157,800
|
$27.21
-11.21%
|
7/29/2011
|
$25.87
|
PP = $26.35
|
|
MB = $27.67
|
Most Recent Note - 8/12/2011 10:58:19 AM
G - Slumping below its 50 DMA line again today. It would be most encouraging for it to find support above that short-term average. Recent lows and its 200 DMA define the next support to watch.
>>> The latest Featured Stock Update with an annotated graph appeared on 8/10/2011. Click here.
View all notes |
Alert me of new notes |
CANSLIM.net Company Profile |
SEC |
Zacks Reports |
StockTalk |
News |
Chart |
Request a new note
C
A N
S L
I M
|
PCLN
-
NASDAQ
Priceline.Com Inc
INTERNET - Internet Software and Services
|
$503.11
|
+2.95
0.59% |
$509.99
|
947,731
81.55% of 50 DAV
50 DAV is 1,162,200
|
$561.88
-10.46%
|
7/29/2011
|
$539.46
|
PP = $552.15
|
|
MB = $579.76
|
Most Recent Note - 8/12/2011 6:03:31 PM
G - It remains below its 50 DMA line while making little headway. The 200 DMA line and recent chart lows define the next important support to watch. See the latest FSU analysis for more details and a new annotated graph.
>>> The latest Featured Stock Update with an annotated graph appeared on 8/12/2011. Click here.
View all notes |
Alert me of new notes |
CANSLIM.net Company Profile |
SEC |
Zacks Reports |
StockTalk |
News |
Chart |
Request a new note
C
A N
S L
I M
|
|
|
|
THESE ARE NOT BUY RECOMMENDATIONS!
Comments contained in the body of this report are technical
opinions only. The material herein has been obtained
from sources believed to be reliable and accurate, however,
its accuracy and completeness cannot be guaranteed.
This site is not an investment advisor, hence it does
not endorse or recommend any securities or other investments.
Any recommendation contained in this report may not
be suitable for all investors and it is not to be deemed
an offer or solicitation on our part with respect to
the purchase or sale of any securities. All trademarks,
service marks and trade names appearing in this report
are the property of their respective owners, and are
likewise used for identification purposes only.
This report is a service available
only to active Paid Premium Members.
You may opt-out of receiving report notifications
at any time. Questions or comments may be submitted
by writing to Premium Membership Services 665 S.E. 10 Street, Suite 201 Deerfield Beach, FL 33441-5634 or by calling 1-800-965-8307
or 954-785-1121.
|
|
|

