***Last / Change / Volume data in this table is the closing quote data***
Symbol/Exchange
Company Name
Industry Group |
PRICE |
CHANGE
(%Change) |
Day High |
Volume
(% DAV)
(% 50 day avg vol) |
52 Wk Hi
% From Hi |
Featured
Date |
Price
Featured |
Pivot Featured |
|
Max Buy |
AAPL
-
NASDAQ
Apple Inc
COMPUTER HARDWARE - Personal Computers
|
$251.79
|
+1.60
0.64% |
$253.10
|
19,081,450
76.15% of 50 DAV
50 DAV is 25,057,300
|
$279.01
-9.76%
|
6/17/2010
|
$270.95
|
PP = $272.56
|
|
MB = $286.19
|
Most Recent Note - 8/11/2010 5:05:12 PM
G - Gapped down today amid broad-based market weakness, slumping below its 50 DMA line and raising concerns. Color code is changed to green based on the deterioration, and it would need to rally above its recent high near $266 for its outlook to improve. Recent chart low ($239) defines an important support level.
>>> The latest Featured Stock Update with an annotated graph appeared on 8/9/2010. Click here.
View all notes |
Alert me of new notes |
CANSLIM.net Company Profile |
SEC |
Zacks Reports |
StockTalk |
News |
Chart |
Request a new note
C
A N
S L
I M


|
ABV
-
NYSE
Comp De Bebidas Adr
FOOD and BEVERAGE - Beverages - Brewers
|
$104.45
|
+0.63
0.61% |
$104.83
|
316,073
47.01% of 50 DAV
50 DAV is 672,300
|
$112.60
-7.24%
|
6/29/2010
|
$104.74
|
PP = $109.33
|
|
MB = $114.80
|
Most Recent Note - 8/11/2010 5:09:25 PM
G - This Brazil-based beverage firm closed under its 50 DMA line with a loss today on light volume. Color code is changed to green. It churned a lot of volume last week without making progress above prior chart highs.
>>> The latest Featured Stock Update with an annotated graph appeared on 7/20/2010. Click here.
View all notes |
Alert me of new notes |
CANSLIM.net Company Profile |
SEC |
Zacks Reports |
StockTalk |
News |
Chart |
Request a new note
C
A N
S L
I M
|
BIDU
-
NASDAQ
Baidu Inc Ads
INTERNET - Internet Information Providers
|
$82.65
|
-1.58
-1.88% |
$84.10
|
12,279,929
105.53% of 50 DAV
50 DAV is 11,636,700
|
$88.32
-6.42%
|
7/14/2010
|
$75.03
|
PP = $78.59
|
|
MB = $82.52
|
 Most Recent Note - 8/12/2010 4:33:24 PM
G - Closed in the upper third of its intra-day range, a sign of support arriving after gapping down again today. Prior highs define technical support along with its 50 DMA line.
>>> The latest Featured Stock Update with an annotated graph appeared on 7/14/2010. Click here.
View all notes |
Alert me of new notes |
CANSLIM.net Company Profile |
SEC |
Zacks Reports |
StockTalk |
News |
Chart |
Request a new note
C
A N
S L
I M
|
CACC
-
NASDAQ
Credit Acceptance Corp
FINANCIAL SERVICES - Credit Services
|
$58.09
|
-0.05
-0.09% |
$58.27
|
33,738
64.63% of 50 DAV
50 DAV is 52,200
|
$59.75
-2.78%
|
7/29/2010
|
$52.04
|
PP = $54.07
|
|
MB = $56.77
|
Most Recent Note - 8/11/2010 5:12:42 PM
G - Stubbornly holding its ground today near its 52-week high after getting extended from its base with recent gains on above average volume. Prior highs in the $54 area define initial chart support to watch.
>>> The latest Featured Stock Update with an annotated graph appeared on 8/2/2010. Click here.
View all notes |
Alert me of new notes |
CANSLIM.net Company Profile |
SEC |
Zacks Reports |
StockTalk |
News |
Chart |
Request a new note
C
A N
S L
I M
|
CRM
-
NYSE
Salesforce.Com Inc
INTERNET - Internet Software and Services
|
$96.95
|
-0.96
-0.98% |
$97.79
|
2,638,475
108.42% of 50 DAV
50 DAV is 2,433,600
|
$104.44
-7.17%
|
6/2/2010
|
$88.44
|
PP = $89.60
|
|
MB = $94.08
|
Most Recent Note - 8/11/2010 11:57:11 AM
G - Gapped down today from an all-time high amid broad-based market weakness after recently wedging above prior highs near $97 with gains lacking volume conviction.
>>> The latest Featured Stock Update with an annotated graph appeared on 7/15/2010. Click here.
View all notes |
Alert me of new notes |
CANSLIM.net Company Profile |
SEC |
Zacks Reports |
StockTalk |
News |
Chart |
Request a new note
C
A N
S L
I M
|
Symbol/Exchange
Company Name
Industry Group |
PRICE |
CHANGE
(%Change) |
Day High |
Volume
(% DAV)
(% 50 day avg vol) |
52 Wk Hi
% From Hi |
Featured
Date |
Price
Featured |
Pivot Featured |
|
Max Buy |
DTSI
-
NASDAQ
D T S Inc
CONSUMER DURABLES - Electronic Equipment
|
$34.63
|
-0.12
-0.35% |
$34.91
|
108,131
110.68% of 50 DAV
50 DAV is 97,700
|
$37.60
-7.90%
|
7/27/2010
|
$37.00
|
PP = $36.28
|
|
MB = $38.09
|
Most Recent Note - 8/11/2010 5:15:51 PM
G - Second consecutive loss today with above average volume, completely negating its recent breakout and sinking near its 50 DMA line. The high-ranked Consumer Products - Electronic firm's latest quarter ended June 30, 2010 showed earnings -67% on -28% sales revenues versus the year ago period. The fundamental flaw in its earnings history is very disappointing with respect to the C criteria now, and its color code was changed to green.
>>> The latest Featured Stock Update with an annotated graph appeared on 7/27/2010. Click here.
View all notes |
Alert me of new notes |
CANSLIM.net Company Profile |
SEC |
Zacks Reports |
StockTalk |
News |
Chart |
Request a new note
C
A N
S L
I M
|
FFIV
-
NASDAQ
F 5 Networks Inc
INTERNET - Internet Software and Services
|
$82.77
|
-4.05
-4.66% |
$84.68
|
3,857,357
229.50% of 50 DAV
50 DAV is 1,680,800
|
$92.70
-10.71%
|
6/16/2010
|
$74.50
|
PP = $74.10
|
|
MB = $77.81
|
Most Recent Note - 8/12/2010 11:53:32 AM
G - Up from today's early lows after a second consecutive gap down. Recently noted as -"extended from any sound base after recent volume-driven gains, it could go on to produce more climactic gains."
>>> The latest Featured Stock Update with an annotated graph appeared on 8/4/2010. Click here.
View all notes |
Alert me of new notes |
CANSLIM.net Company Profile |
SEC |
Zacks Reports |
StockTalk |
News |
Chart |
Request a new note
C
A N
S L
I M
|
FOSL
-
NASDAQ
Fossil Inc
CONSUMER DURABLES - Recreational Goods, Other
|
$44.18
|
+0.00
0.00% |
$44.34
|
916,229
105.27% of 50 DAV
50 DAV is 870,400
|
$46.30
-4.58%
|
8/10/2010
|
$45.54
|
PP = $42.69
|
|
MB = $44.82
|
Most Recent Note - 8/11/2010 12:01:46 PM
Y - Down today, pulling back below its "max buy" level amid broad-based market weakness following a considerable "breakaway gap" for a new 52-week high and all-time high. It faces no resistance due to overhead supply after triggering a technical buy signal. FOSL was featured in yellow in the 8/10/10 mid-day report (read here). Sales revenues and earnings increases showed impressive acceleration in the 3 latest quarters (Dec '09, Mar and Jun '10) following a streak of 4 negative comparisons versus the year ago period. The lack of leadership in the Retail/Wholesale - Jewelry group (L criteria) is a concern.
>>> The latest Featured Stock Update with an annotated graph appeared on 8/11/2010. Click here.
View all notes |
Alert me of new notes |
CANSLIM.net Company Profile |
SEC |
Zacks Reports |
StockTalk |
News |
Chart |
Request a new note
C
A N
S L
I M
|
MELI
-
NASDAQ
Mercadolibre Inc
INTERNET - Internet Software and; Services
|
$66.42
|
+0.80
1.22% |
$67.40
|
683,141
65.35% of 50 DAV
50 DAV is 1,045,400
|
$68.67
-3.28%
|
5/13/2010
|
$54.21
|
PP = $55.85
|
|
MB = $58.64
|
Most Recent Note - 8/12/2010 4:35:04 PM
G - Consolidating after getting extended from any sound base, prior highs in the $62 area define initial chart support.
>>> The latest Featured Stock Update with an annotated graph appeared on 7/23/2010. Click here.
View all notes |
Alert me of new notes |
CANSLIM.net Company Profile |
SEC |
Zacks Reports |
StockTalk |
News |
Chart |
Request a new note
C
A N
S L
I M
|
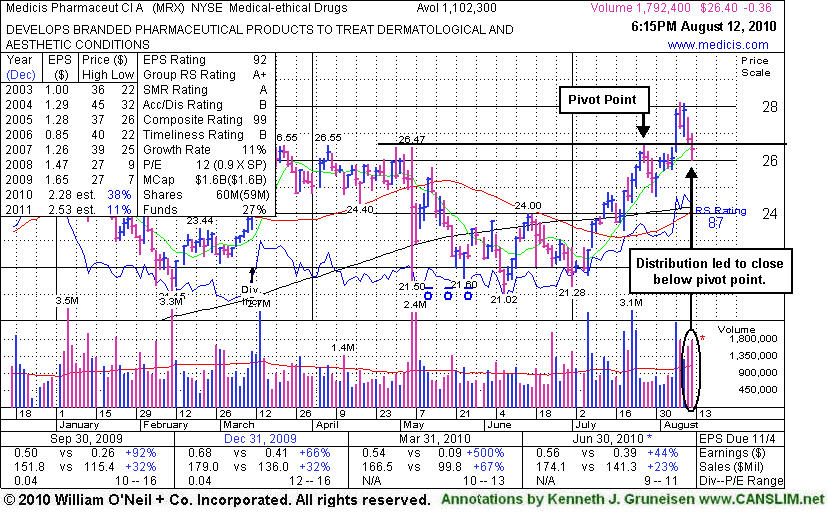
MRX
-
NYSE
Medicis Pharmaceut Cl A
DRUGS - Biotechnology
|
$26.40
|
-0.36
-1.35% |
$27.00
|
1,793,979
165.73% of 50 DAV
50 DAV is 1,082,500
|
$28.15
-6.22%
|
8/12/2010
|
$26.88
|
PP = $26.71
|
|
MB = $28.05
|
Most Recent Note - 8/12/2010 4:45:11 PM
Y - Its early resilience faded and it closed below its pivot point as a loss on higher volume amounted to another distribution day. Pulling back from its 52-week high after its 8/06/10 breakout from a sound base, the high-ranked Medical - Ethical Drugs firm was featured in the mid-day report today (read here) and noted for its strong quarterly and annual earnings history.
>>> The latest Featured Stock Update with an annotated graph appeared on 8/12/2010. Click here.
View all notes |
Alert me of new notes |
CANSLIM.net Company Profile |
SEC |
Zacks Reports |
StockTalk |
News |
Chart |
Request a new note
C
A N
S L
I M
|
Symbol/Exchange
Company Name
Industry Group |
PRICE |
CHANGE
(%Change) |
Day High |
Volume
(% DAV)
(% 50 day avg vol) |
52 Wk Hi
% From Hi |
Featured
Date |
Price
Featured |
Pivot Featured |
|
Max Buy |
MWIV
-
NASDAQ
M W I Veterinary Supply
HEALTH SERVICES - Medical Instruments and; Supplies
|
$49.18
|
+1.01
2.10% |
$49.59
|
35,122
47.33% of 50 DAV
50 DAV is 74,200
|
$54.48
-9.73%
|
7/29/2010
|
$52.05
|
PP = $52.09
|
|
MB = $54.69
|
Most Recent Note - 8/12/2010 4:48:02 PM
G - Today's gain on very light volume followed a damaging violation of its 50 DMA line and 2 considerable losses on heavier volume. Color code was changed to green and recent lows in the $46 area define the next chart support level below its short-term average.
>>> The latest Featured Stock Update with an annotated graph appeared on 7/30/2010. Click here.
View all notes |
Alert me of new notes |
CANSLIM.net Company Profile |
SEC |
Zacks Reports |
StockTalk |
News |
Chart |
Request a new note
C
A N
S L
I M
|
NEM
-
NYSE
Newmont Mining Corp
METALS and MINING - Gold
|
$57.75
|
+1.71
3.05% |
$58.16
|
6,788,432
82.12% of 50 DAV
50 DAV is 8,266,300
|
$63.38
-8.88%
|
6/22/2010
|
$59.60
|
PP = $59.67
|
|
MB = $62.65
|
Most Recent Note - 8/12/2010 4:55:29 PM
G - Gain on light volume today, still closing below its 50 DMA line. Distributional action in recent weeks has been followed by no gains with average or higher volume.
>>> The latest Featured Stock Update with an annotated graph appeared on 8/6/2010. Click here.
View all notes |
Alert me of new notes |
CANSLIM.net Company Profile |
SEC |
Zacks Reports |
StockTalk |
News |
Chart |
Request a new note
C
A N
S L
I M
|
NEOG
-
NASDAQ
Neogen Corp
DRUGS - Diagnostic Substances
|
$27.54
|
+0.04
0.15% |
$27.95
|
62,964
67.41% of 50 DAV
50 DAV is 93,400
|
$30.39
-9.38%
|
7/22/2010
|
$27.19
|
PP = $27.87
|
|
MB = $29.26
|
Most Recent Note - 8/12/2010 5:03:07 PM
Y - Halted its slide today with a small gain on light volume after distributional pressure led to trading near its 50 DMA line and prior highs in the $27 area defining important technical support. The prior session's loss on higher volume led to a close below its pivot point that negated its recent breakout, raising concerns.
>>> The latest Featured Stock Update with an annotated graph appeared on 7/22/2010. Click here.
View all notes |
Alert me of new notes |
CANSLIM.net Company Profile |
SEC |
Zacks Reports |
StockTalk |
News |
Chart |
Request a new note
C
A N
S L
I M
|
NFLX
-
NASDAQ
Netflix Inc
SPECIALTY RETAIL - Music and Video Stores
|
$133.05
|
+6.58
5.20% |
$133.79
|
10,279,237
273.57% of 50 DAV
50 DAV is 3,757,500
|
$128.42
3.61%
|
8/10/2010
|
$124.05
|
PP = $124.00
|
|
MB = $130.20
|
Most Recent Note - 8/12/2010 5:26:18 PM
G - Gain today and strong close with more than twice average volume for a new all-time high. Rallied above its "max buy" level, its color code was changed to green. Its 8/10/10 gain with more than 3 times average volume lifted it above the pivot point after an 8-week "double bottom" base, and it may be considered a late-stage technical breakout.
>>> The latest Featured Stock Update with an annotated graph appeared on 8/10/2010. Click here.
View all notes |
Alert me of new notes |
CANSLIM.net Company Profile |
SEC |
Zacks Reports |
StockTalk |
News |
Chart |
Request a new note
C
A N
S L
I M
|
ROVI
-
NASDAQ
Rovi Corp
COMPUTER SOFTWARE andamp; SERVICES - Security Software andamp; Services
|
$42.06
|
-0.13
-0.31% |
$42.07
|
1,359,349
113.83% of 50 DAV
50 DAV is 1,194,200
|
$44.96
-6.45%
|
6/3/2010
|
$38.70
|
PP = $40.16
|
|
MB = $42.17
|
Most Recent Note - 8/11/2010 12:12:18 PM
Y - Gapped down today amid broad-based market weakness, dipping under its "max buy" level toward recent chart lows. Color code is changed to yellow. Prior highs in the $40 area and its 50 DMA line define chart support.
>>> The latest Featured Stock Update with an annotated graph appeared on 7/21/2010. Click here.
View all notes |
Alert me of new notes |
CANSLIM.net Company Profile |
SEC |
Zacks Reports |
StockTalk |
News |
Chart |
Request a new note
C
A N
S L
I M
|
Symbol/Exchange
Company Name
Industry Group |
PRICE |
CHANGE
(%Change) |
Day High |
Volume
(% DAV)
(% 50 day avg vol) |
52 Wk Hi
% From Hi |
Featured
Date |
Price
Featured |
Pivot Featured |
|
Max Buy |
SHOO
-
NASDAQ
Steven Madden Limited
CONSUMER NON-DURABLES - Textile - Apparel Footwear
|
$35.88
|
-0.12
-0.33% |
$36.05
|
338,111
79.22% of 50 DAV
50 DAV is 426,800
|
$40.98
-12.45%
|
8/5/2010
|
$39.55
|
PP = $41.08
|
|
MB = $43.13
|
Most Recent Note - 8/11/2010 11:40:28 AM
Y - Gapped down today amid broad-based market weakness, forming a handle after a 16-week cup shaped pattern. A technical breakout above the $40 threshold would trigger a buy signal, meanwhile it is ideal for disciplined investors' watchlists.
>>> The latest Featured Stock Update with an annotated graph appeared on 8/5/2010. Click here.
View all notes |
Alert me of new notes |
CANSLIM.net Company Profile |
SEC |
Zacks Reports |
StockTalk |
News |
Chart |
Request a new note
C
A N
S L
I M
|
ULTA
-
NASDAQ
Ulta Salon Cosm & Frag
SPECIALTY RETAIL - Specialty Retail, Other
|
$22.97
|
+0.02
0.09% |
$23.25
|
265,798
37.18% of 50 DAV
50 DAV is 714,900
|
$26.75
-14.13%
|
8/4/2010
|
$24.90
|
PP = $26.85
|
|
MB = $28.19
|
Most Recent Note - 8/11/2010 11:43:11 AM
G - Today's 7th consecutive loss has led to a 50 DMA line violation and its color code is changed to green. It would need to rally above the new pivot point cited with volume conviction to trigger a proper technical buy signal.
>>> The latest Featured Stock Update with an annotated graph appeared on 7/19/2010. Click here.
View all notes |
Alert me of new notes |
CANSLIM.net Company Profile |
SEC |
Zacks Reports |
StockTalk |
News |
Chart |
Request a new note
C
A N
S L
I M
|
VIT
-
NYSE
Vanceinfo Tech Inc Ads
COMPUTER SOFTWARE and SERVICES - Business Software and Services
|
$26.17
|
-0.13
-0.49% |
$26.46
|
353,760
72.52% of 50 DAV
50 DAV is 487,800
|
$27.96
-6.40%
|
7/8/2010
|
$25.20
|
PP = $26.58
|
|
MB = $27.91
|
Most Recent Note - 8/11/2010 11:45:46 AM
Y - Pulling back considerably today amid broad-based market weakness after recently wedging to new all-time highs with gains on lighter than average volume. It has not triggered a confirming buy signal with volume yet since featured in the 7/08/10 mid-day report. Its 7/29/10 low ($24.55) defines initial support above its 50 DMA line.
>>> The latest Featured Stock Update with an annotated graph appeared on 7/26/2010. Click here.
View all notes |
Alert me of new notes |
CANSLIM.net Company Profile |
SEC |
Zacks Reports |
StockTalk |
News |
Chart |
Request a new note
C
A N
S L
I M
|