***Last / Change / Volume data in this table is the closing quote data***
Symbol/Exchange
Company Name
Industry Group |
PRICE |
CHANGE
(%Change) |
Day High |
Volume
(% DAV)
(% 50 day avg vol) |
52 Wk Hi
% From Hi |
Featured
Date |
Price
Featured |
Pivot Featured |
|
Max Buy |
AAPL
-
NASDAQ
Apple Inc
COMPUTER HARDWARE - Personal Computers
|
$259.41
|
-2.34
-0.89% |
$260.43
|
16,125,563
63.05% of 50 DAV
50 DAV is 25,576,500
|
$279.01
-7.02%
|
6/17/2010
|
$270.95
|
PP = $272.56
|
|
MB = $286.19
|
Most Recent Note - 8/6/2010 5:46:29 PM
Y - Still quietly consolidating in a tight range just above its 50 DMA line. It has been 7 weeks since its negative reversal on 6/21/10 at its all-time high. Recent chart low ($239) defines an important support level.
>>> The latest Featured Stock Update with an annotated graph appeared on 8/9/2010. Click here.
View all notes |
Alert me of new notes |
CANSLIM.net Company Profile |
SEC |
Zacks Reports |
StockTalk |
News |
Chart |
Request a new note
C
A N
S L
I M


|
ABV
-
NYSE
Comp De Bebidas Adr
FOOD and BEVERAGE - Beverages - Brewers
|
$105.77
|
-0.28
-0.26% |
$106.06
|
369,420
53.52% of 50 DAV
50 DAV is 690,200
|
$112.60
-6.07%
|
6/29/2010
|
$104.74
|
PP = $109.33
|
|
MB = $114.80
|
Most Recent Note - 8/9/2010 4:36:24 PM
Y - This Brazil-based beverage firm is consolidating just above its 50 DMA line. It churned a lot of volume last week without making progress above prior chart highs.
>>> The latest Featured Stock Update with an annotated graph appeared on 7/20/2010. Click here.
View all notes |
Alert me of new notes |
CANSLIM.net Company Profile |
SEC |
Zacks Reports |
StockTalk |
News |
Chart |
Request a new note
C
A N
S L
I M
|
BIDU
-
NASDAQ
Baidu Inc Ads
INTERNET - Internet Information Providers
|
$87.87
|
+0.31
0.35% |
$88.32
|
9,234,419
78.49% of 50 DAV
50 DAV is 11,765,000
|
$88.00
-0.15%
|
7/14/2010
|
$75.03
|
PP = $78.59
|
|
MB = $82.52
|
Most Recent Note - 8/9/2010 4:37:50 PM
G - Small gain today with light volume for a new all-time high. It is extended from a sound base, yet no overhead supply remains to act as resistance. Steadily rose above prior highs in the $78 area and further without great volume conviction.
>>> The latest Featured Stock Update with an annotated graph appeared on 7/14/2010. Click here.
View all notes |
Alert me of new notes |
CANSLIM.net Company Profile |
SEC |
Zacks Reports |
StockTalk |
News |
Chart |
Request a new note
C
A N
S L
I M
|
CACC
-
NASDAQ
Credit Acceptance Corp
FINANCIAL SERVICES - Credit Services
|
$58.36
|
-1.39
-2.33% |
$59.39
|
31,966
61.95% of 50 DAV
50 DAV is 51,600
|
$59.75
-2.33%
|
7/29/2010
|
$52.04
|
PP = $54.07
|
|
MB = $56.77
|
Most Recent Note - 8/9/2010 4:39:26 PM
G - Gain today on average volume for a new high. Prior highs in the $54 area define initial chart support to watch.
>>> The latest Featured Stock Update with an annotated graph appeared on 8/2/2010. Click here.
View all notes |
Alert me of new notes |
CANSLIM.net Company Profile |
SEC |
Zacks Reports |
StockTalk |
News |
Chart |
Request a new note
C
A N
S L
I M
|
CRM
-
NYSE
Salesforce.Com Inc
INTERNET - Internet Software and Services
|
$101.65
|
-2.41
-2.32% |
$102.39
|
1,861,862
75.59% of 50 DAV
50 DAV is 2,463,000
|
$104.44
-2.67%
|
6/2/2010
|
$88.44
|
PP = $89.60
|
|
MB = $94.08
|
Most Recent Note - 8/9/2010 4:40:58 PM
G - Gain today with light volume for another new all-time high, getting extended from a sound base. Prior highs near $97 define near-term support to watch above its 50 DMA line.
>>> The latest Featured Stock Update with an annotated graph appeared on 7/15/2010. Click here.
View all notes |
Alert me of new notes |
CANSLIM.net Company Profile |
SEC |
Zacks Reports |
StockTalk |
News |
Chart |
Request a new note
C
A N
S L
I M
|
Symbol/Exchange
Company Name
Industry Group |
PRICE |
CHANGE
(%Change) |
Day High |
Volume
(% DAV)
(% 50 day avg vol) |
52 Wk Hi
% From Hi |
Featured
Date |
Price
Featured |
Pivot Featured |
|
Max Buy |
DTSI
-
NASDAQ
D T S Inc
CONSUMER DURABLES - Electronic Equipment
|
$36.04
|
-0.96
-2.59% |
$36.70
|
142,699
148.34% of 50 DAV
50 DAV is 96,200
|
$37.60
-4.15%
|
7/27/2010
|
$37.00
|
PP = $36.28
|
|
MB = $38.09
|
 Most Recent Note - 8/10/2010 12:21:25 PM
G - The high-ranked Consumer Products - Electronic firm is holding its ground stubbornly today after its latest quarter ended June 30, 2010 showed earnings -67% on -28% sales revenues versus the year ago period. The fundamental flaw in its earnings history is very disappointing with respect to the C criteria now, and its color code is changed to green. Technically, prior highs in the $35-36 area define support above its 50 DMA line.
>>> The latest Featured Stock Update with an annotated graph appeared on 7/27/2010. Click here.
View all notes |
Alert me of new notes |
CANSLIM.net Company Profile |
SEC |
Zacks Reports |
StockTalk |
News |
Chart |
Request a new note
C
A N
S L
I M
|
FFIV
-
NASDAQ
F 5 Networks Inc
INTERNET - Internet Software and Services
|
$92.23
|
+0.82
0.90% |
$92.67
|
1,205,879
70.59% of 50 DAV
50 DAV is 1,708,400
|
$91.97
0.28%
|
6/16/2010
|
$74.50
|
PP = $74.10
|
|
MB = $77.81
|
Most Recent Note - 8/9/2010 4:44:43 PM
G - Gain today with average volume for a new all-time high. It has been repeatedly noted as -"extended from any sound base after recent volume-driven gains, it could go on to produce more climactic gains."
>>> The latest Featured Stock Update with an annotated graph appeared on 8/4/2010. Click here.
View all notes |
Alert me of new notes |
CANSLIM.net Company Profile |
SEC |
Zacks Reports |
StockTalk |
News |
Chart |
Request a new note
C
A N
S L
I M
|
FOSL
-
NASDAQ
Fossil Inc
CONSUMER DURABLES - Recreational Goods, Other
|
$45.84
|
+3.37
7.94% |
$46.28
|
2,847,321
346.85% of 50 DAV
50 DAV is 820,900
|
$43.42
5.57%
|
8/10/2010
|
$45.54
|
PP = $42.69
|
|
MB = $44.82
|
Most Recent Note - 8/10/2010 3:52:41 PM
Y - Considerable "breakaway gap" up today for a new 52-week high and all-time high leaves it clear of all resistance due to overhead supply. It was featured in yellow in today's mid-day report (read here). Sales revenues and earnings increases showed impressive acceleration in the 3 latest quarters (Dec '09, Mar and Jun '10) following a streak of 4 negative comparisons versus the year ago period. The lack of leadership in the Retail/Wholesale - Jewelry group (L criteria) is a concern.
There are no Featured Stock Updates™ available for this stock at this time. You may request one by clicking the Request a New Note link below
View all notes |
Alert me of new notes |
CANSLIM.net Company Profile |
SEC |
Zacks Reports |
StockTalk |
News |
Chart |
Request a new note
C
A N
S L
I M
|
MELI
-
NASDAQ
Mercadolibre Inc
INTERNET - Internet Software and; Services
|
$67.81
|
-0.03
-0.04% |
$68.67
|
856,935
83.69% of 50 DAV
50 DAV is 1,024,000
|
$68.48
-0.98%
|
5/13/2010
|
$54.21
|
PP = $55.85
|
|
MB = $58.64
|
Most Recent Note - 8/9/2010 4:45:36 PM
G - Gapped up today while posting its 5th consecutive gain. Extended from any sound base, prior highs in the $62 area define initial chart support.
>>> The latest Featured Stock Update with an annotated graph appeared on 7/23/2010. Click here.
View all notes |
Alert me of new notes |
CANSLIM.net Company Profile |
SEC |
Zacks Reports |
StockTalk |
News |
Chart |
Request a new note
C
A N
S L
I M
|
MWIV
-
NASDAQ
M W I Veterinary Supply
HEALTH SERVICES - Medical Instruments and; Supplies
|
$50.40
|
-1.84
-3.52% |
$51.92
|
105,820
145.16% of 50 DAV
50 DAV is 72,900
|
$54.48
-7.49%
|
7/29/2010
|
$52.05
|
PP = $52.09
|
|
MB = $54.69
|
Most Recent Note - 8/10/2010 1:11:24 PM
Y - Considerable loss today, slumping toward its 50 DMA line. Recent lows in the $46 area define the next chart support level below its short-term average.
>>> The latest Featured Stock Update with an annotated graph appeared on 7/30/2010. Click here.
View all notes |
Alert me of new notes |
CANSLIM.net Company Profile |
SEC |
Zacks Reports |
StockTalk |
News |
Chart |
Request a new note
C
A N
S L
I M
|
Symbol/Exchange
Company Name
Industry Group |
PRICE |
CHANGE
(%Change) |
Day High |
Volume
(% DAV)
(% 50 day avg vol) |
52 Wk Hi
% From Hi |
Featured
Date |
Price
Featured |
Pivot Featured |
|
Max Buy |
NEM
-
NYSE
Newmont Mining Corp
METALS and MINING - Gold
|
$57.40
|
+0.16
0.28% |
$57.82
|
5,020,709
59.87% of 50 DAV
50 DAV is 8,386,200
|
$63.38
-9.44%
|
6/22/2010
|
$59.60
|
PP = $59.67
|
|
MB = $62.65
|
Most Recent Note - 8/6/2010 6:16:23 PM
G - Technically volume totals have been light while it has rebounded near its 50 DMA line which may act as resistance after a damaging gap down on 7/27/10.
>>> The latest Featured Stock Update with an annotated graph appeared on 8/6/2010. Click here.
View all notes |
Alert me of new notes |
CANSLIM.net Company Profile |
SEC |
Zacks Reports |
StockTalk |
News |
Chart |
Request a new note
C
A N
S L
I M
|
NEOG
-
NASDAQ
Neogen Corp
DRUGS - Diagnostic Substances
|
$28.26
|
-1.03
-3.52% |
$29.02
|
87,576
94.17% of 50 DAV
50 DAV is 93,000
|
$30.39
-7.01%
|
7/22/2010
|
$27.19
|
PP = $27.87
|
|
MB = $29.26
|
Most Recent Note - 8/10/2010 1:12:49 PM
Y - Pulling back toward prior highs in the $27 area defining near-term chart support to watch.
>>> The latest Featured Stock Update with an annotated graph appeared on 7/22/2010. Click here.
View all notes |
Alert me of new notes |
CANSLIM.net Company Profile |
SEC |
Zacks Reports |
StockTalk |
News |
Chart |
Request a new note
C
A N
S L
I M
|
NETL
-
NASDAQ
Netlogic Microsystems
ELECTRONICS - Semiconductor - Memory Chips
|
$28.16
|
-1.27
-4.32% |
$29.09
|
1,866,533
144.37% of 50 DAV
50 DAV is 1,292,900
|
$35.00
-19.54%
|
7/28/2010
|
$33.44
|
PP = $35.10
|
|
MB = $36.86
|
Most Recent Note - 8/10/2010 1:06:58 PM
G - Slumping under its 7/30/10 low ($28.27) with a considerable loss today, raising more serious concerns while approaching its 200 DMA line and earlier chart lows. Based on weak action it will be dropped from the Featured Stocks list tonight.
>>> The latest Featured Stock Update with an annotated graph appeared on 7/28/2010. Click here.
View all notes |
Alert me of new notes |
CANSLIM.net Company Profile |
SEC |
Zacks Reports |
StockTalk |
News |
Chart |
Request a new note
C
A N
S L
I M
|
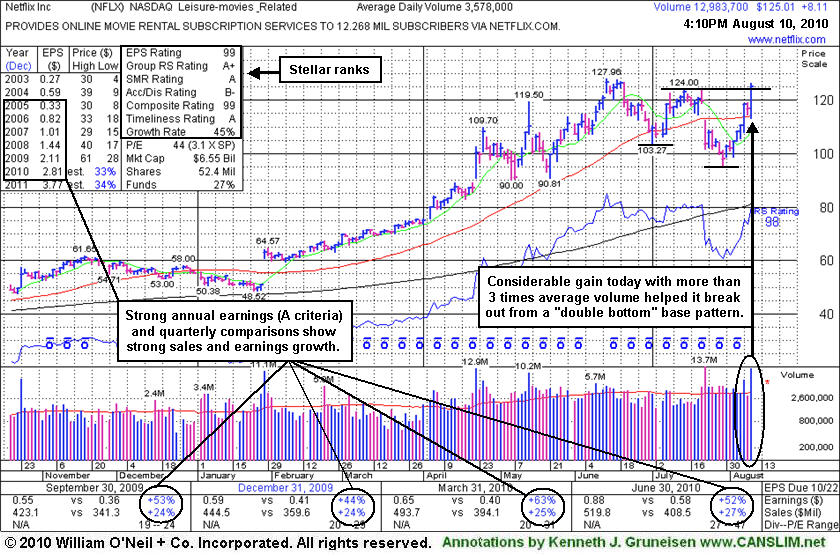
NFLX
-
NASDAQ
Netflix Inc
SPECIALTY RETAIL - Music and Video Stores
|
$125.01
|
+8.11
6.94% |
$126.48
|
12,997,203
363.79% of 50 DAV
50 DAV is 3,572,700
|
$127.96
-2.31%
|
8/10/2010
|
$124.05
|
PP = $124.00
|
|
MB = $130.20
|
Most Recent Note - 8/10/2010 3:50:35 PM
Y - Today's gain with more than 3 times average volume has lifted it above the pivot point after an 8-week "double bottom" base, and it may be considered a late-stage breakout. Featured in yellow in today's mid-day report (read here) and it was recently noted in the 6/16/10 and 5/13/10 mid-day reports - "Look of a possible 'climax run' in the making. Since its latest strong quarterly report it has been noted as very strong in terms of key investment criteria. NFLX rebounded impressively since it was dropped from the Featured Stocks list on 6/02/09 based on persistent trading under its 50 DMA line. It was first featured in yellow at $37.13 in the 1/29/09 CANSLIM.net Mid-Day Breakouts Report (read here). "
>>> The latest Featured Stock Update with an annotated graph appeared on 8/10/2010. Click here.
View all notes |
Alert me of new notes |
CANSLIM.net Company Profile |
SEC |
Zacks Reports |
StockTalk |
News |
Chart |
Request a new note
C
A N
S L
I M
|
ROVI
-
NASDAQ
Rovi Corp
COMPUTER SOFTWARE andamp; SERVICES - Security Software andamp; Services
|
$43.70
|
-0.40
-0.91% |
$44.01
|
1,071,250
89.23% of 50 DAV
50 DAV is 1,200,500
|
$44.96
-2.80%
|
6/3/2010
|
$38.70
|
PP = $40.16
|
|
MB = $42.17
|
Most Recent Note - 8/6/2010 6:51:52 PM
G - Hovering near its 52-week high, extended from prior highs in the $40 area and its 50 DMA line which define chart support.
>>> The latest Featured Stock Update with an annotated graph appeared on 7/21/2010. Click here.
View all notes |
Alert me of new notes |
CANSLIM.net Company Profile |
SEC |
Zacks Reports |
StockTalk |
News |
Chart |
Request a new note
C
A N
S L
I M
|
Symbol/Exchange
Company Name
Industry Group |
PRICE |
CHANGE
(%Change) |
Day High |
Volume
(% DAV)
(% 50 day avg vol) |
52 Wk Hi
% From Hi |
Featured
Date |
Price
Featured |
Pivot Featured |
|
Max Buy |
SHOO
-
NASDAQ
Steven Madden Limited
CONSUMER NON-DURABLES - Textile - Apparel Footwear
|
$38.35
|
-1.10
-2.79% |
$39.44
|
917,667
223.99% of 50 DAV
50 DAV is 409,700
|
$40.98
-6.42%
|
8/5/2010
|
$39.55
|
PP = $41.08
|
|
MB = $43.13
|
Most Recent Note - 8/10/2010 3:36:15 PM
Y - Pulling back today with a loss on above average volume after a 16-week cup shaped base. A proper "handle" forms over a minimum of 1 week and includes a pullback in the 10-12% range on light volume.
>>> The latest Featured Stock Update with an annotated graph appeared on 8/5/2010. Click here.
View all notes |
Alert me of new notes |
CANSLIM.net Company Profile |
SEC |
Zacks Reports |
StockTalk |
News |
Chart |
Request a new note
C
A N
S L
I M
|
ULTA
-
NASDAQ
Ulta Salon Cosm & Frag
SPECIALTY RETAIL - Specialty Retail, Other
|
$24.09
|
-0.62
-2.51% |
$24.64
|
364,839
50.64% of 50 DAV
50 DAV is 720,500
|
$26.75
-9.94%
|
8/4/2010
|
$24.90
|
PP = $26.85
|
|
MB = $28.19
|
Most Recent Note - 8/9/2010 4:57:32 PM
Y - Today's 5th consecutive loss while consolidating just above its 50 DMA line leaves it -7.6% off its 52-week high. It would need to rally above the new pivot point cited with volume conviction to trigger a proper technical buy signal.
>>> The latest Featured Stock Update with an annotated graph appeared on 7/19/2010. Click here.
View all notes |
Alert me of new notes |
CANSLIM.net Company Profile |
SEC |
Zacks Reports |
StockTalk |
News |
Chart |
Request a new note
C
A N
S L
I M
|
VIT
-
NYSE
Vanceinfo Tech Inc Ads
COMPUTER SOFTWARE and SERVICES - Business Software and Services
|
$27.79
|
+0.05
0.18% |
$27.96
|
218,930
44.07% of 50 DAV
50 DAV is 496,800
|
$27.93
-0.50%
|
7/8/2010
|
$25.20
|
PP = $26.58
|
|
MB = $27.91
|
Most Recent Note - 8/9/2010 4:58:36 PM
Y - Wedged up for a new all-time high today with a 4th consecutive gain on lighter than average volume. It has not triggered a confirming buy signal with volume yet since featured in the 7/08/10 mid-day report. Its 7/29/10 low ($24.55) defines initial support above its 50 DMA line.
>>> The latest Featured Stock Update with an annotated graph appeared on 7/26/2010. Click here.
View all notes |
Alert me of new notes |
CANSLIM.net Company Profile |
SEC |
Zacks Reports |
StockTalk |
News |
Chart |
Request a new note
C
A N
S L
I M
|