You are not logged in.
This means you
CAN ONLY VIEW reports that were published prior to Monday, April 14, 2025.
You
MUST UPGRADE YOUR MEMBERSHIP if you want to see any current reports.
AFTER MARKET UPDATE - FRIDAY, AUGUST 9TH, 2013
Previous After Market Report Next After Market Report >>>
|
|
|
|
DOW |
-72.96 |
15,425.36 |
-0.47% |
|
Volume |
637,317,010 |
-8% |
|
Volume |
1,502,259,860 |
-13% |
|
NASDAQ |
-9.01 |
3,660.11 |
-0.25% |
|
Advancers |
1,454 |
47% |
|
Advancers |
999 |
38% |
|
S&P 500 |
-6.06 |
1,691.42 |
-0.36% |
|
Decliners |
1,534 |
49% |
|
Decliners |
1,513 |
58% |
|
Russell 2000 |
-1.08 |
1,048.39 |
-0.10% |
|
52 Wk Highs |
129 |
|
|
52 Wk Highs |
114 |
|
|
S&P 600 |
-0.15 |
592.07 |
-0.03% |
|
52 Wk Lows |
101 |
|
|
52 Wk Lows |
23 |
|
|
 |
Major Averages Ended With Small Losses For Week
Kenneth J. Gruneisen - Passed the CAN SLIM® Master's Exam
For the week, the Dow Jones Industrial Average fell -1.5%, the S&P 500 Index was down -1.1% and the Nasdaq Compsite Index gave up -0.8%. Friday's volume totals were reported lighter than the prior session totals on the Nasdaq exchange and on the NYSE. Breadth was negative as decliners led advancers by a 3-2 margin on the Nasdaq exchange while decliners only narrowly led advancers on the NYSE. There were 46 high-ranked companies from the CANSLIM.net Leaders List made new 52-week highs and appeared on the CANSLIM.net BreakOuts Page, down from the prior session total of 53 stocks. The list of stocks hitting new 52-week highs outnumbered new 52-week lows on the Nasdaq exchange and on the NYSE. There were gains for 12 of the 18 high-ranked companies currently included on the Featured Stocks Page.
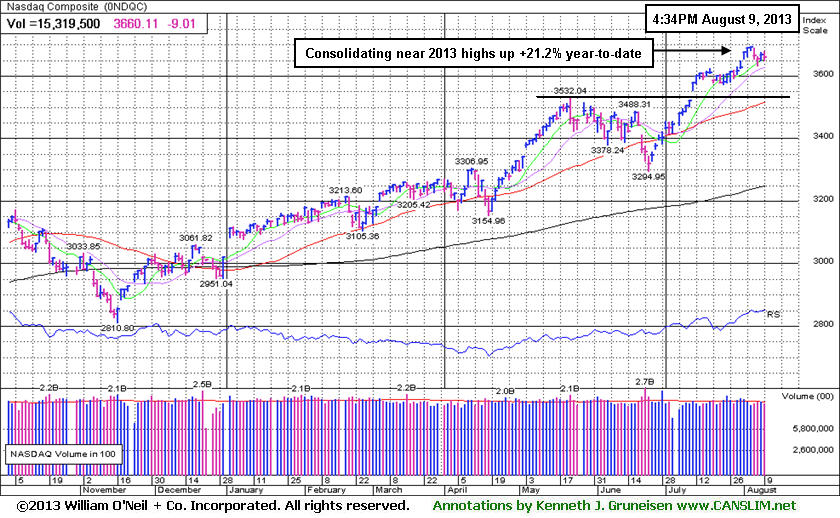
Markets ended the session in the red, albeit off of their worst levels. Investors weighed positive industrial data out of China amid ongoing concerns that the Fed may taper stimulus measure at the September FOMC meeting. On our shores, an unexpected decline in wholesale inventories also dampened sentiment.
Nine of the 10 sectors on the S&P ended lower. Material stocks managed to buck the trend as copper and gold prices moved higher. Shares of Freeport-McMoRan Copper & Gold Inc (FCX +2.63%) rose. On the earnings front, travel website Priceline.com (PCLN +3.87%) rallied after the company posted stronger-than-anticipated earnings and provided a positive full-year outlook. In other news, Blackberry (BBRY +5.74%) rose on rumors that the company may be looking to go private. The JC Penny Company Inc (JCP -5.78%) fell amid an escalating feud between the company's Board of Directors and its top investor, Bill Ackman.
Turning to fixed income markets, Treasuries ended modestly higher along the curve. The benchmark 10-year note was up about 1/8 of a point to yield 2.58% and the 30-year bond added about 3/16 of a point to yield 3.63%.
The market (M criteria) has endured a number of distributional sessions yet remains in a confirmed rally. For any rally to be sustained it is absolutely crucial to have a healthy crop of new leaders, so it would be most favorable to see the list of stocks hitting new highs and appearing on the BreakOuts Page continue to include many companies. A recent evaporation of leadership is enough to raise concerns, and during these times individual holding should be closely monitored for any worrisome technical sell signals.
Stay familiar with companies listed on the CANSLIM.net Featured Stocks Page - a page showing the most action-worthy candidates' latest notes and links to additional resources including detailed analysis with data-packed graphs which are annotated by a Certified expert. The Premium Member Homepage - includes "dynamic archives" to all prior pay reports published. Watch for an announcement via email concerning the next WEBCAST.
PICTURED: The Nasdaq Composite Index is consolidating near 2013 highs up +21.2% year-to-date..
|
 Kenneth J. Gruneisen started out as a licensed stockbroker in August 1987, a couple of months prior to the historic stock market crash that took the Dow Jones Industrial Average down -22.6% in a single day. He has published daily fact-based fundamental and technical analysis on high-ranked stocks online for two decades. Through FACTBASEDINVESTING.COM, Kenneth provides educational articles, news, market commentary, and other information regarding proven investment systems that work in good times and bad.
Comments contained in the body of this report are technical opinions only and are not necessarily those of Gruneisen Growth Corp. The material herein has been obtained from sources believed to be reliable and accurate, however, its accuracy and completeness cannot be guaranteed. Our firm, employees, and customers may effect transactions, including transactions contrary to any recommendation herein, or have positions in the securities mentioned herein or options with respect thereto. Any recommendation contained in this report may not be suitable for all investors and it is not to be deemed an offer or solicitation on our part with respect to the purchase or sale of any securities. |
|
 |
Tech and Energy-Related Shares Fell; XAU Added More to Prior Big Gain
Kenneth J. Gruneisen - Passed the CAN SLIM® Master's Exam
The tech sector was mostly lower as the Networking Index ($NWX -0.68%), Semiconductor Index ($SOX -0.54%), and Biotechnology Index ($BTK -0.46%) suffered modest losses and the Internet Index ($IIX +0.18%) eked out a small gain. Financial shares were mixed as the Bank Index ($BKX -0.41%) edged lower and the Broker/Dealer Index ($XBD +0.25%) posted a small gain. The Gold & Silver Index ($XAU +1.78%) was a standout gainer while the Oil Services Index ($OSX -0.40%) and the Integrated Oil Index ($XOI -0.22%) edged lower. The Retail Index ($RLX -0.09%) and the Healthcare Index ($HMO +0.05%) were little changed.
Charts courtesy www.stockcharts.com
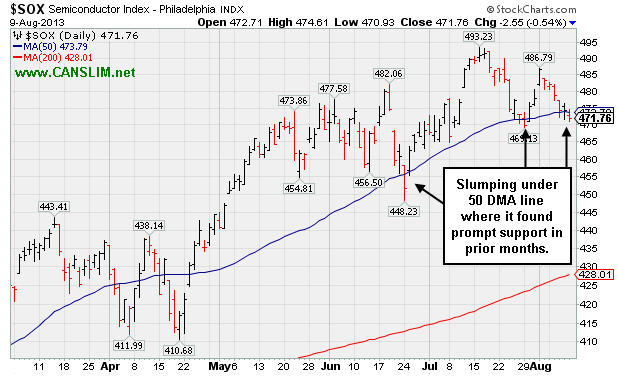
PICTURED: The Semiconductor Index ($SOX -0.54%) ended the week slumping under its 50-day moving average (DMA) line where it found prompt support in prior months.
| Oil Services |
$OSX |
263.69 |
-1.06 |
-0.40% |
+19.77% |
| Healthcare |
$HMO |
3,434.58 |
+1.61 |
+0.05% |
+36.61% |
| Integrated Oil |
$XOI |
1,380.61 |
-3.08 |
-0.22% |
+11.18% |
| Semiconductor |
$SOX |
471.76 |
-2.55 |
-0.54% |
+22.83% |
| Networking |
$NWX |
293.79 |
-2.00 |
-0.68% |
+29.68% |
| Internet |
$IIX |
408.30 |
+0.75 |
+0.18% |
+24.86% |
| Broker/Dealer |
$XBD |
134.31 |
+0.34 |
+0.25% |
+42.39% |
| Retail |
$RLX |
842.68 |
-0.79 |
-0.09% |
+29.04% |
| Gold & Silver |
$XAU |
97.67 |
+1.71 |
+1.78% |
-41.02% |
| Bank |
$BKX |
65.33 |
-0.27 |
-0.41% |
+27.40% |
| Biotech |
$BTK |
2,104.56 |
-9.65 |
-0.46% |
+36.04% |
|
|
|
 |
Finding Support Above Prior Highs and 50-Day Moving Average Line
Kenneth J. Gruneisen - Passed the CAN SLIM® Master's Exam
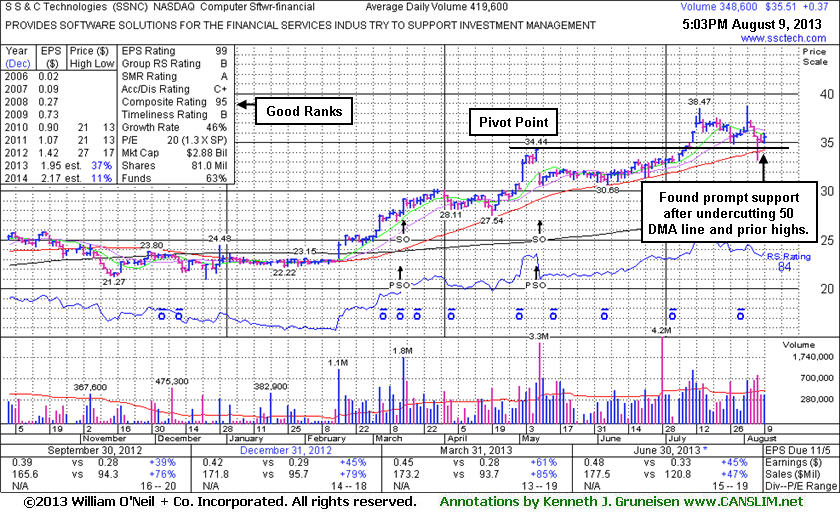
S S & C Technologies Holdings, Inc (SSNC +$0.37 or +1.05% to $35.51) rebounded and found prompt support this week after undercutting its 50-day moving average (DMA) and prior highs in the $34 area. It followed losses on higher volume with a small gain lacking great volume conviction. Disciplined investors always limit losses if ever any stock falls more than -7% from their purchase price. It was last shown in the FSU section on 7/12/13 with an annotated graph under the headline, "Extended From Prior Base Following Gap Up Gains". The stock convincingly cleared the pivot point based on its 5/08/13 high plus 10 cents which was cited in the 7/11/13 mid-day report (read here), triggering a technical buy signal while rising from an orderly base pattern formed above its 50-day moving average (DMA) line. The breakout gain was backed by +124% above average volume, well above the +40% above average volume threshold which is the bare minimum volume needed to trigger a proper technical buy signal.
Its small supply of only 62.4 million shares in the publicly traded float can contribute to greater price volatility in the event of institutional buying or selling pressure. SSNC completed another Secondary Offering on 5/09/13, while it was previously noted in the 5/20/13 mid-day report - "The high-ranked Computer Software - Financial firm completed previously noted Secondary Offerings on 3/14/13 and on 7/19/12." New institutional owners are often attracted when a company has the help of underwriters in placing shares during offerings.
It has earned high ranks due to its strong earnings history. The past 5 quarterly comparisons through Jun '13 showed earnings increases above the +25% minimum guideline (C criteria) for buy candidates. Its annual earnings (A criteria) history has also been very strong. The number of top-rated funds owning its shares rose from 260 in Dec' 12 to 299 in Jun '13, a reassuring sign concerning the I criteria of the fact-based investment system. The Computer Software - Financial industry group currently has a B Rating, and leadership among other individual issues in the group is a reassuring sign concerning the L criteria.
|
|
|
Color Codes Explained :
Y - Better candidates highlighted by our
staff of experts.
G - Previously featured
in past reports as yellow but may no longer be buyable under the
guidelines.
***Last / Change / Volume data in this table is the closing quote data***
Symbol/Exchange
Company Name
Industry Group |
PRICE |
CHANGE
(%Change) |
Day High |
Volume
(% DAV)
(% 50 day avg vol) |
52 Wk Hi
% From Hi |
Featured
Date |
Price
Featured |
Pivot Featured |
|
Max Buy |
AMBA
-
NASDAQ
Ambarella Inc
ELECTRONICS - Semiconductor - Specialized
|
$16.82
|
+0.22
1.33% |
$17.10
|
843,711
73.55% of 50 DAV
50 DAV is 1,147,100
|
$19.44
-13.48%
|
7/15/2013
|
$17.87
|
PP = $18.68
|
|
MB = $19.61
|
Most Recent Note - 8/8/2013 2:59:05 PM
G - Rallying toward its 50 DMA line which acted resistance following the technical violation which triggered a sell signal last week. A rebound above that important short-term average would help its outlook improve.
>>> The latest Featured Stock Update with an annotated graph appeared on 7/17/2013. Click here.
View all notes |
Alert me of new notes |
CANSLIM.net Company Profile |
SEC |
Zacks Reports |
StockTalk |
News |
Chart |
Request a new note
C
A N
S L
I M


|
BITA
-
NYSE
Bitauto Hldgs Ltd Ads
INTERNET - Internet Information Providers
|
$16.30
|
+1.92
13.35% |
$18.10
|
1,460,429
1,110.59% of 50 DAV
50 DAV is 131,500
|
$14.39
13.27%
|
8/7/2013
|
$12.01
|
PP = $13.30
|
|
MB = $13.97
|
 Most Recent Note - 8/9/2013 12:27:09 PM
G - Tallying its 2nd consecutive volume-driven gain for new highs. Color code was changed to green after quickly getting extended beyond the "max buy" level. Prior highs in the $13 area define initial support to watch on pullbacks. The 8/07/13 After Market Update included more details and a new annotated graph under the headline "Found Prompt Support After Undercutting 50-Day Average".
>>> The latest Featured Stock Update with an annotated graph appeared on 8/7/2013. Click here.
View all notes |
Alert me of new notes |
CANSLIM.net Company Profile |
SEC |
Zacks Reports |
StockTalk |
News |
Chart |
Request a new note
C
A N
S L
I M
|
CELG
-
NASDAQ
Celgene Corp
DRUGS - Drug Manufacturers - Major
|
$142.07
|
+0.07
0.05% |
$144.21
|
1,133,502
39.41% of 50 DAV
50 DAV is 2,876,300
|
$149.92
-5.23%
|
7/11/2013
|
$133.25
|
PP = $131.92
|
|
MB = $138.52
|
Most Recent Note - 8/6/2013 4:14:26 PM
G - Retreated from its 52-week and all-time highs with near average but higher volume today. Extended from its prior base and support at old highs in the $131 area.
>>> The latest Featured Stock Update with an annotated graph appeared on 7/29/2013. Click here.
View all notes |
Alert me of new notes |
CANSLIM.net Company Profile |
SEC |
Zacks Reports |
StockTalk |
News |
Chart |
Request a new note
C
A N
S L
I M
|
FLT
-
NYSE
Fleetcor Technologies
DIVERSIFIED SERVICES - Business/Management Services
|
$98.67
|
-0.23
-0.23% |
$99.06
|
389,529
55.69% of 50 DAV
50 DAV is 699,400
|
$100.87
-2.18%
|
5/29/2013
|
$86.02
|
PP = $85.66
|
|
MB = $89.94
|
Most Recent Note - 8/8/2013 5:20:36 PM
G- Holding its ground stubbornly, extended from any sound base and perched at all-time highs. Volume totals have been cooling after spiking higher with gains backed by above average volume.
>>> The latest Featured Stock Update with an annotated graph appeared on 7/18/2013. Click here.
View all notes |
Alert me of new notes |
CANSLIM.net Company Profile |
SEC |
Zacks Reports |
StockTalk |
News |
Chart |
Request a new note
C
A N
S L
I M
|
GNRC
-
NYSE
Generac Hldgs Inc
CONSUMER DURABLES - Electronic Equipment
|
$42.34
|
+0.11
0.26% |
$42.56
|
1,110,956
91.48% of 50 DAV
50 DAV is 1,214,400
|
$44.30
-4.42%
|
7/30/2013
|
$42.60
|
PP = $42.10
|
|
MB = $44.21
|
Most Recent Note - 8/8/2013 5:21:29 PM
Y - Holding its ground since gapping down on 8/02/13 after pricing a Secondary Offering. It recently rallied from an advanced "3-weeks tight" base. Disciplined investors always limit losses by selling if any stock falls more than -7% from its purchase price.
>>> The latest Featured Stock Update with an annotated graph appeared on 7/30/2013. Click here.
View all notes |
Alert me of new notes |
CANSLIM.net Company Profile |
SEC |
Zacks Reports |
StockTalk |
News |
Chart |
Request a new note
C
A N
S L
I M
|
Symbol/Exchange
Company Name
Industry Group |
PRICE |
CHANGE
(%Change) |
Day High |
Volume
(% DAV)
(% 50 day avg vol) |
52 Wk Hi
% From Hi |
Featured
Date |
Price
Featured |
Pivot Featured |
|
Max Buy |
KORS
-
NYSE
Michael Kors Hldgs Ltd
RETAIL - Apparel Stores
|
$72.05
|
+0.77
1.08% |
$72.53
|
4,148,240
111.01% of 50 DAV
50 DAV is 3,736,900
|
$71.73
0.45%
|
8/6/2013
|
$69.66
|
PP = $66.28
|
|
MB = $69.59
|
Most Recent Note - 8/8/2013 5:24:09 PM
G - Posted a gain with above average volume getting extended beyond its "max buy" level, and its color code is changed to green. Relative Strength rating improved to 83, above the 80+ minimum guideline for buy candidates.
>>> The latest Featured Stock Update with an annotated graph appeared on 8/6/2013. Click here.
View all notes |
Alert me of new notes |
CANSLIM.net Company Profile |
SEC |
Zacks Reports |
StockTalk |
News |
Chart |
Request a new note
C
A N
S L
I M
|
LOPE
-
NASDAQ
Grand Canyon Education
DIVERSIFIED SERVICES - Education and; Training Services
|
$34.50
|
-0.55
-1.57% |
$35.04
|
376,830
86.49% of 50 DAV
50 DAV is 435,700
|
$37.17
-7.18%
|
6/19/2013
|
$31.47
|
PP = $34.17
|
|
MB = $35.88
|
Most Recent Note - 8/8/2013 5:26:10 PM
Y - Reported earnings +15% on +19% sales for the Jun '13 quarter, below the +25% minimum earnings guideline (C criteria), raising fundamental concerns. Consolidating below its "max buy" level. Prior highs in the $34 area define support along with its 50 DMA line.
>>> The latest Featured Stock Update with an annotated graph appeared on 7/19/2013. Click here.
View all notes |
Alert me of new notes |
CANSLIM.net Company Profile |
SEC |
Zacks Reports |
StockTalk |
News |
Chart |
Request a new note
C
A N
S L
I M
|
PCLN
-
NASDAQ
Priceline.Com Inc
INTERNET - Internet Software and Services
|
$969.89
|
+36.14
3.87% |
$994.98
|
2,605,076
385.37% of 50 DAV
50 DAV is 676,000
|
$940.00
3.18%
|
7/8/2013
|
$878.28
|
PP = $847.43
|
|
MB = $889.80
|
Most Recent Note - 8/9/2013 12:59:35 PM
G - Challenged the $1,000 threshold after it gapped up for a considerable gain and new 52-week high, getting more extended from any sound base. Reported earnings +24% on +27% sales revenues for the Jun '13 quarter, just under the +25% minimum earnings guideline (C criteria).
>>> The latest Featured Stock Update with an annotated graph appeared on 7/25/2013. Click here.
View all notes |
Alert me of new notes |
CANSLIM.net Company Profile |
SEC |
Zacks Reports |
StockTalk |
News |
Chart |
Request a new note
C
A N
S L
I M
|
PRAA
-
NASDAQ
Portfolio Recovery Assoc
DIVERSIFIED SERVICES - Business/Management Services
|
$52.51
|
+0.33
0.63% |
$52.92
|
501,701
109.59% of 50 DAV
50 DAV is 457,800
|
$54.62
-3.87%
|
7/31/2013
|
$51.43
|
PP = $54.72
|
|
MB = $57.46
|
Most Recent Note - 8/8/2013 12:51:24 PM
Y - Trading heavy volume after it announced pricing of a $250 Million Offering of Convertible Senior Notes due 2020. It has not triggered a proper technical buy signal since returning to the Featured Stocks list highlighted in yellow with new pivot point cited based on its 6/17/13 high plus 10 cents. Members were repeatedly cautioned - "It faces some resistance and needs additional volume-driven gains to trigger a proper new technical buy signal."
>>> The latest Featured Stock Update with an annotated graph appeared on 8/2/2013. Click here.
View all notes |
Alert me of new notes |
CANSLIM.net Company Profile |
SEC |
Zacks Reports |
StockTalk |
News |
Chart |
Request a new note
C
A N
S L
I M
|
PRLB
-
NYSE
Proto Labs Inc
MANUFACTURING - Small Tools and Accessories
|
$66.03
|
+1.35
2.09% |
$66.35
|
328,633
67.05% of 50 DAV
50 DAV is 490,100
|
$72.08
-8.39%
|
7/29/2013
|
$64.86
|
PP = $67.50
|
|
MB = $70.88
|
Most Recent Note - 8/7/2013 5:40:31 PM
Y - Slumped on lighter but still above average volume today, testing support near its 50 DMA line and prior lows again after making only limited progress above prior highs and encountering recent distributional pressure. Disciplined investors always limit losses if any stock falls more than -7% from their purchase price. See the latest FSU analysis for more details and a new annotated graph.
>>> The latest Featured Stock Update with an annotated graph appeared on 8/5/2013. Click here.
View all notes |
Alert me of new notes |
CANSLIM.net Company Profile |
SEC |
Zacks Reports |
StockTalk |
News |
Chart |
Request a new note
C
A N
S L
I M
|
Symbol/Exchange
Company Name
Industry Group |
PRICE |
CHANGE
(%Change) |
Day High |
Volume
(% DAV)
(% 50 day avg vol) |
52 Wk Hi
% From Hi |
Featured
Date |
Price
Featured |
Pivot Featured |
|
Max Buy |
QCOR
-
NASDAQ
Questcor Pharmaceuticals
DRUGS - Biotechnology
|
$65.55
|
-0.64
-0.97% |
$66.89
|
851,892
40.34% of 50 DAV
50 DAV is 2,111,600
|
$70.55
-7.09%
|
7/31/2013
|
$66.46
|
PP = $59.01
|
|
MB = $61.96
|
Most Recent Note - 8/8/2013 3:01:23 PM
G - Still consolidating near its high with volume totals cooling following volume-driven gains. Quickly got extended beyond its "max buy" level after highlighted in yellow in the 7/31/13 mid-day report (read here) with a weekly graph which illustrated its powerful long-term breakout to new highs.
>>> The latest Featured Stock Update with an annotated graph appeared on 8/1/2013. Click here.
View all notes |
Alert me of new notes |
CANSLIM.net Company Profile |
SEC |
Zacks Reports |
StockTalk |
News |
Chart |
Request a new note
C
A N
S L
I M
|
RRTS
-
NYSE
Roadrunner Trans Systems
TRANSPORTATION - Air Delivery and Freight Service
|
$29.78
|
-0.26
-0.87% |
$30.25
|
38,125
27.77% of 50 DAV
50 DAV is 137,300
|
$30.98
-3.89%
|
4/3/2013
|
$22.77
|
PP = $23.75
|
|
MB = $24.94
|
Most Recent Note - 8/6/2013 4:19:53 PM
G - Hovering near its 52-week high, technically extended from any sound base. Fundamentally, it reported earnings +19% on +26% in the Jun '13 quarter, raising more concerns with its 2nd consecutive quarterly comparison with earnings increasing below the +25% minimum guideline (C criteria).
>>> The latest Featured Stock Update with an annotated graph appeared on 7/22/2013. Click here.
View all notes |
Alert me of new notes |
CANSLIM.net Company Profile |
SEC |
Zacks Reports |
StockTalk |
News |
Chart |
Request a new note
C
A N
S L
I M
|
SFUN
-
NYSE
Soufun Hldgs Ltd Ads A
INTERNET - Internet Information Providers
|
$38.93
|
-0.56
-1.42% |
$39.57
|
549,455
144.71% of 50 DAV
50 DAV is 379,700
|
$39.98
-2.63%
|
7/16/2013
|
$29.54
|
PP = $27.90
|
|
MB = $29.30
|
Most Recent Note - 8/8/2013 5:17:28 PM
G - Very extended from its latest base after another considerable volume-driven gain. See the latest FSU analysis for more details and a new annotated daily graph.
>>> The latest Featured Stock Update with an annotated graph appeared on 8/8/2013. Click here.
View all notes |
Alert me of new notes |
CANSLIM.net Company Profile |
SEC |
Zacks Reports |
StockTalk |
News |
Chart |
Request a new note
C
A N
S L
I M
|
SSNC
-
NASDAQ
S S & C Technologies
COMPUTER SOFTWARE and SERVICES - Application Software
|
$35.51
|
+0.37
1.05% |
$35.95
|
348,608
83.08% of 50 DAV
50 DAV is 419,600
|
$38.80
-8.48%
|
7/11/2013
|
$35.80
|
PP = $34.54
|
|
MB = $36.27
|
Most Recent Note - 8/9/2013 5:21:29 PM
Y - Found prompt support after undercutting its 50 DMA line and prior highs in the $34 area. Disciplined investors always limit losses if ever any stock falls more than -7% from their purchase price. See the latest FSU analysis for more details and a new annotated graph.
>>> The latest Featured Stock Update with an annotated graph appeared on 8/9/2013. Click here.
View all notes |
Alert me of new notes |
CANSLIM.net Company Profile |
SEC |
Zacks Reports |
StockTalk |
News |
Chart |
Request a new note
C
A N
S L
I M
|
SSYS
-
NASDAQ
Stratasys Ltd
COMPUTER HARDWARE - Computer Peripherals
|
$95.04
|
-3.22
-3.28% |
$97.80
|
1,614,393
201.50% of 50 DAV
50 DAV is 801,200
|
$99.50
-4.48%
|
7/8/2013
|
$91.44
|
PP = $95.00
|
|
MB = $99.75
|
Most Recent Note - 8/9/2013 5:22:12 PM
Y - Pulled back today with above average volume. Technically it broke out and hit a new 52-week high with heavy volume behind its considerable 8/08/13 gain triggering a technical buy signal. The stock's Relative Strength Rating has improved to 83, above the 80+ minimum guideline for buy candidates under the fact-based investment system. Reported earnings +41% on +116% sales revenues for the Jun '13 quarter. Found prompt support after briefly undercutting its 50 DMA line this week.
>>> The latest Featured Stock Update with an annotated graph appeared on 7/24/2013. Click here.
View all notes |
Alert me of new notes |
CANSLIM.net Company Profile |
SEC |
Zacks Reports |
StockTalk |
News |
Chart |
Request a new note
C
A N
S L
I M
|
Symbol/Exchange
Company Name
Industry Group |
PRICE |
CHANGE
(%Change) |
Day High |
Volume
(% DAV)
(% 50 day avg vol) |
52 Wk Hi
% From Hi |
Featured
Date |
Price
Featured |
Pivot Featured |
|
Max Buy |
STMP
-
NASDAQ
Stamps.Com Inc
INTERNET - Internet Software and Services
|
$40.34
|
+0.49
1.23% |
$40.47
|
107,443
74.36% of 50 DAV
50 DAV is 144,500
|
$46.47
-13.19%
|
7/31/2013
|
$40.00
|
PP = $42.98
|
|
MB = $45.13
|
Most Recent Note - 8/6/2013 4:24:51 PM
Y - Encountered more distributional pressure with today's 3rd consecutive loss on higher above average volume while slumping toward its 50 DMA line. Disciplined investors limit losses if any stock falls more than -7% from their purchase price.
>>> The latest Featured Stock Update with an annotated graph appeared on 7/31/2013. Click here.
View all notes |
Alert me of new notes |
CANSLIM.net Company Profile |
SEC |
Zacks Reports |
StockTalk |
News |
Chart |
Request a new note
C
A N
S L
I M
|
VRX
-
NYSE
Valeant Pharmaceuticals
DRUGS - Drug Manufacturers - Other
|
$101.87
|
+0.19
0.19% |
$102.13
|
1,450,724
89.37% of 50 DAV
50 DAV is 1,623,300
|
$102.54
-0.65%
|
4/30/2013
|
$60.24
|
PP = $76.66
|
|
MB = $80.49
|
Most Recent Note - 8/6/2013 4:30:21 PM
Y- Hovering near its 52-week high after wedging higher with recent gains lacking great volume conviction while rising from a 9-week cup-with-handle base. Due to report Q2 results before the open on August 7, 2013, and volume and volatility often increase near earnings news. No new pivot point has been cited while members were repeatedly cautioned - "Concerns were raised by its Mar '13 earnings report with only a +14% earnings increase, below the +25% minimum guideline (C criteria) for buy candidates."
>>> The latest Featured Stock Update with an annotated graph appeared on 7/23/2013. Click here.
View all notes |
Alert me of new notes |
CANSLIM.net Company Profile |
SEC |
Zacks Reports |
StockTalk |
News |
Chart |
Request a new note
C
A N
S L
I M
|
YNDX
-
NASDAQ
Yandex N V Class A
INTERNET - Internet Information Providers
|
$33.04
|
+0.04
0.12% |
$33.28
|
1,083,249
43.69% of 50 DAV
50 DAV is 2,479,500
|
$34.27
-3.59%
|
7/10/2013
|
$29.29
|
PP = $29.59
|
|
MB = $31.07
|
Most Recent Note - 8/6/2013 4:31:29 PM
G - Holding its ground stubbornly near its 52-week high with small losses on light volume following volume-driven gains into new high territory. Prior highs in the $28-29 area define near-term support to watch.
>>> The latest Featured Stock Update with an annotated graph appeared on 7/26/2013. Click here.
View all notes |
Alert me of new notes |
CANSLIM.net Company Profile |
SEC |
Zacks Reports |
StockTalk |
News |
Chart |
Request a new note
C
A N
S L
I M
|
|
|
|
THESE ARE NOT BUY RECOMMENDATIONS!
Comments contained in the body of this report are technical
opinions only. The material herein has been obtained
from sources believed to be reliable and accurate, however,
its accuracy and completeness cannot be guaranteed.
This site is not an investment advisor, hence it does
not endorse or recommend any securities or other investments.
Any recommendation contained in this report may not
be suitable for all investors and it is not to be deemed
an offer or solicitation on our part with respect to
the purchase or sale of any securities. All trademarks,
service marks and trade names appearing in this report
are the property of their respective owners, and are
likewise used for identification purposes only.
This report is a service available
only to active Paid Premium Members.
You may opt-out of receiving report notifications
at any time. Questions or comments may be submitted
by writing to Premium Membership Services 665 S.E. 10 Street, Suite 201 Deerfield Beach, FL 33441-5634 or by calling 1-800-965-8307
or 954-785-1121.
|
|
|

