***Last / Change / Volume data in this table is the closing quote data***
Symbol/Exchange
Company Name
Industry Group |
PRICE |
CHANGE
(%Change) |
Day High |
Volume
(% DAV)
(% 50 day avg vol) |
52 Wk Hi
% From Hi |
Featured
Date |
Price
Featured |
Pivot Featured |
|
Max Buy |
AMBA
-
NASDAQ
Ambarella Inc
ELECTRONICS - Semiconductor - Specialized
|
$16.60
|
+0.65
4.08% |
$16.76
|
988,676
86.48% of 50 DAV
50 DAV is 1,143,200
|
$19.44
-14.61%
|
7/15/2013
|
$17.87
|
PP = $18.68
|
|
MB = $19.61
|
 Most Recent Note - 8/8/2013 2:59:05 PM
G - Rallying toward its 50 DMA line which acted resistance following the technical violation which triggered a sell signal last week. A rebound above that important short-term average would help its outlook improve.
>>> The latest Featured Stock Update with an annotated graph appeared on 7/17/2013. Click here.
View all notes |
Alert me of new notes |
CANSLIM.net Company Profile |
SEC |
Zacks Reports |
StockTalk |
News |
Chart |
Request a new note
C
A N
S L
I M


|
BITA
-
NYSE
Bitauto Hldgs Ltd Ads
INTERNET - Internet Information Providers
|
$14.38
|
+2.38
19.83% |
$14.39
|
1,745,827
1,744.08% of 50 DAV
50 DAV is 100,100
|
$13.20
8.94%
|
8/7/2013
|
$12.01
|
PP = $13.30
|
|
MB = $13.97
|
Most Recent Note - 8/8/2013 12:22:53 PM
Y - Gapped up today and rallied to a new 52-week high with heavy volume behind its considerable gain. Rallied above the pivot point based on its 5/08/13 high plus 10 cents noted in the prior mid-day report (read here). This China-based Internet-Content firm reported earnings +109% on +41% sales revenues for the Jun '13 quarter, continuing its strong earnings history (C and A criteria). Last evening's After Market Update included more details and a new annotated graph under the headline "Found Prompt Support After Undercutting 50-Day Average".
>>> The latest Featured Stock Update with an annotated graph appeared on 8/7/2013. Click here.
View all notes |
Alert me of new notes |
CANSLIM.net Company Profile |
SEC |
Zacks Reports |
StockTalk |
News |
Chart |
Request a new note
C
A N
S L
I M
|
CELG
-
NASDAQ
Celgene Corp
DRUGS - Drug Manufacturers - Major
|
$142.00
|
-0.65
-0.46% |
$144.30
|
1,832,302
63.56% of 50 DAV
50 DAV is 2,882,600
|
$149.92
-5.28%
|
7/11/2013
|
$133.25
|
PP = $131.92
|
|
MB = $138.52
|
Most Recent Note - 8/6/2013 4:14:26 PM
G - Retreated from its 52-week and all-time highs with near average but higher volume today. Extended from its prior base and support at old highs in the $131 area.
>>> The latest Featured Stock Update with an annotated graph appeared on 7/29/2013. Click here.
View all notes |
Alert me of new notes |
CANSLIM.net Company Profile |
SEC |
Zacks Reports |
StockTalk |
News |
Chart |
Request a new note
C
A N
S L
I M
|
FLT
-
NYSE
Fleetcor Technologies
DIVERSIFIED SERVICES - Business/Management Services
|
$98.90
|
+0.96
0.98% |
$99.50
|
398,951
55.44% of 50 DAV
50 DAV is 719,600
|
$100.87
-1.95%
|
5/29/2013
|
$86.02
|
PP = $85.66
|
|
MB = $89.94
|
Most Recent Note - 8/8/2013 5:20:36 PM
G- Holding its ground stubbornly, extended from any sound base and perched at all-time highs. Volume totals have been cooling after spiking higher with gains backed by above average volume.
>>> The latest Featured Stock Update with an annotated graph appeared on 7/18/2013. Click here.
View all notes |
Alert me of new notes |
CANSLIM.net Company Profile |
SEC |
Zacks Reports |
StockTalk |
News |
Chart |
Request a new note
C
A N
S L
I M
|
GNRC
-
NYSE
Generac Hldgs Inc
CONSUMER DURABLES - Electronic Equipment
|
$42.23
|
+0.47
1.13% |
$42.44
|
1,029,066
85.02% of 50 DAV
50 DAV is 1,210,400
|
$44.30
-4.67%
|
7/30/2013
|
$42.60
|
PP = $42.10
|
|
MB = $44.21
|
Most Recent Note - 8/8/2013 5:21:29 PM
Y - Holding its ground since gapping down on 8/02/13 after pricing a Secondary Offering. It recently rallied from an advanced "3-weeks tight" base. Disciplined investors always limit losses by selling if any stock falls more than -7% from its purchase price.
>>> The latest Featured Stock Update with an annotated graph appeared on 7/30/2013. Click here.
View all notes |
Alert me of new notes |
CANSLIM.net Company Profile |
SEC |
Zacks Reports |
StockTalk |
News |
Chart |
Request a new note
C
A N
S L
I M
|
Symbol/Exchange
Company Name
Industry Group |
PRICE |
CHANGE
(%Change) |
Day High |
Volume
(% DAV)
(% 50 day avg vol) |
52 Wk Hi
% From Hi |
Featured
Date |
Price
Featured |
Pivot Featured |
|
Max Buy |
KORS
-
NYSE
Michael Kors Hldgs Ltd
RETAIL - Apparel Stores
|
$71.28
|
+1.75
2.52% |
$71.73
|
4,869,293
124.20% of 50 DAV
50 DAV is 3,920,400
|
$71.50
-0.31%
|
8/6/2013
|
$69.66
|
PP = $66.28
|
|
MB = $69.59
|
Most Recent Note - 8/8/2013 5:24:09 PM
G - Posted a gain with above average volume getting extended beyond its "max buy" level, and its color code is changed to green. Relative Strength rating improved to 83, above the 80+ minimum guideline for buy candidates.
>>> The latest Featured Stock Update with an annotated graph appeared on 8/6/2013. Click here.
View all notes |
Alert me of new notes |
CANSLIM.net Company Profile |
SEC |
Zacks Reports |
StockTalk |
News |
Chart |
Request a new note
C
A N
S L
I M
|
LOPE
-
NASDAQ
Grand Canyon Education
DIVERSIFIED SERVICES - Education and; Training Services
|
$35.05
|
-0.45
-1.27% |
$35.96
|
288,494
66.32% of 50 DAV
50 DAV is 435,000
|
$37.17
-5.70%
|
6/19/2013
|
$31.47
|
PP = $34.17
|
|
MB = $35.88
|
Most Recent Note - 8/8/2013 5:26:10 PM
Y - Reported earnings +15% on +19% sales for the Jun '13 quarter, below the +25% minimum earnings guideline (C criteria), raising fundamental concerns. Consolidating below its "max buy" level. Prior highs in the $34 area define support along with its 50 DMA line.
>>> The latest Featured Stock Update with an annotated graph appeared on 7/19/2013. Click here.
View all notes |
Alert me of new notes |
CANSLIM.net Company Profile |
SEC |
Zacks Reports |
StockTalk |
News |
Chart |
Request a new note
C
A N
S L
I M
|
PCLN
-
NASDAQ
Priceline.Com Inc
INTERNET - Internet Software and Services
|
$933.75
|
+6.17
0.67% |
$937.00
|
1,314,214
199.06% of 50 DAV
50 DAV is 660,200
|
$940.00
-0.66%
|
7/8/2013
|
$878.28
|
PP = $847.43
|
|
MB = $889.80
|
Most Recent Note - 8/7/2013 1:31:08 PM
G - Hovering near its 52-week high, extended from any sound base. Due to report earnings August 8th. Its 50 DMA line and prior highs in the $847 area define important support to watch on pullbacks.
>>> The latest Featured Stock Update with an annotated graph appeared on 7/25/2013. Click here.
View all notes |
Alert me of new notes |
CANSLIM.net Company Profile |
SEC |
Zacks Reports |
StockTalk |
News |
Chart |
Request a new note
C
A N
S L
I M
|
PRAA
-
NASDAQ
Portfolio Recovery Assoc
DIVERSIFIED SERVICES - Business/Management Services
|
$52.18
|
+1.63
3.22% |
$52.30
|
2,506,550
612.25% of 50 DAV
50 DAV is 409,400
|
$54.62
-4.47%
|
7/31/2013
|
$51.43
|
PP = $54.72
|
|
MB = $57.46
|
Most Recent Note - 8/8/2013 12:51:24 PM
Y - Trading heavy volume after it announced pricing of a $250 Million Offering of Convertible Senior Notes due 2020. It has not triggered a proper technical buy signal since returning to the Featured Stocks list highlighted in yellow with new pivot point cited based on its 6/17/13 high plus 10 cents. Members were repeatedly cautioned - "It faces some resistance and needs additional volume-driven gains to trigger a proper new technical buy signal."
>>> The latest Featured Stock Update with an annotated graph appeared on 8/2/2013. Click here.
View all notes |
Alert me of new notes |
CANSLIM.net Company Profile |
SEC |
Zacks Reports |
StockTalk |
News |
Chart |
Request a new note
C
A N
S L
I M
|
PRLB
-
NYSE
Proto Labs Inc
MANUFACTURING - Small Tools and Accessories
|
$64.68
|
+1.24
1.95% |
$65.38
|
367,304
75.67% of 50 DAV
50 DAV is 485,400
|
$72.08
-10.27%
|
7/29/2013
|
$64.86
|
PP = $67.50
|
|
MB = $70.88
|
Most Recent Note - 8/7/2013 5:40:31 PM
Y - Slumped on lighter but still above average volume today, testing support near its 50 DMA line and prior lows again after making only limited progress above prior highs and encountering recent distributional pressure. Disciplined investors always limit losses if any stock falls more than -7% from their purchase price. See the latest FSU analysis for more details and a new annotated graph.
>>> The latest Featured Stock Update with an annotated graph appeared on 8/5/2013. Click here.
View all notes |
Alert me of new notes |
CANSLIM.net Company Profile |
SEC |
Zacks Reports |
StockTalk |
News |
Chart |
Request a new note
C
A N
S L
I M
|
Symbol/Exchange
Company Name
Industry Group |
PRICE |
CHANGE
(%Change) |
Day High |
Volume
(% DAV)
(% 50 day avg vol) |
52 Wk Hi
% From Hi |
Featured
Date |
Price
Featured |
Pivot Featured |
|
Max Buy |
QCOR
-
NASDAQ
Questcor Pharmaceuticals
DRUGS - Biotechnology
|
$66.19
|
+1.63
2.52% |
$66.58
|
1,044,521
49.49% of 50 DAV
50 DAV is 2,110,500
|
$70.55
-6.18%
|
7/31/2013
|
$66.46
|
PP = $59.01
|
|
MB = $61.96
|
Most Recent Note - 8/8/2013 3:01:23 PM
G - Still consolidating near its high with volume totals cooling following volume-driven gains. Quickly got extended beyond its "max buy" level after highlighted in yellow in the 7/31/13 mid-day report (read here) with a weekly graph which illustrated its powerful long-term breakout to new highs.
>>> The latest Featured Stock Update with an annotated graph appeared on 8/1/2013. Click here.
View all notes |
Alert me of new notes |
CANSLIM.net Company Profile |
SEC |
Zacks Reports |
StockTalk |
News |
Chart |
Request a new note
C
A N
S L
I M
|
RRTS
-
NYSE
Roadrunner Trans Systems
TRANSPORTATION - Air Delivery and Freight Service
|
$30.04
|
+0.23
0.77% |
$30.25
|
61,401
44.46% of 50 DAV
50 DAV is 138,100
|
$30.98
-3.05%
|
4/3/2013
|
$22.77
|
PP = $23.75
|
|
MB = $24.94
|
Most Recent Note - 8/6/2013 4:19:53 PM
G - Hovering near its 52-week high, technically extended from any sound base. Fundamentally, it reported earnings +19% on +26% in the Jun '13 quarter, raising more concerns with its 2nd consecutive quarterly comparison with earnings increasing below the +25% minimum guideline (C criteria).
>>> The latest Featured Stock Update with an annotated graph appeared on 7/22/2013. Click here.
View all notes |
Alert me of new notes |
CANSLIM.net Company Profile |
SEC |
Zacks Reports |
StockTalk |
News |
Chart |
Request a new note
C
A N
S L
I M
|
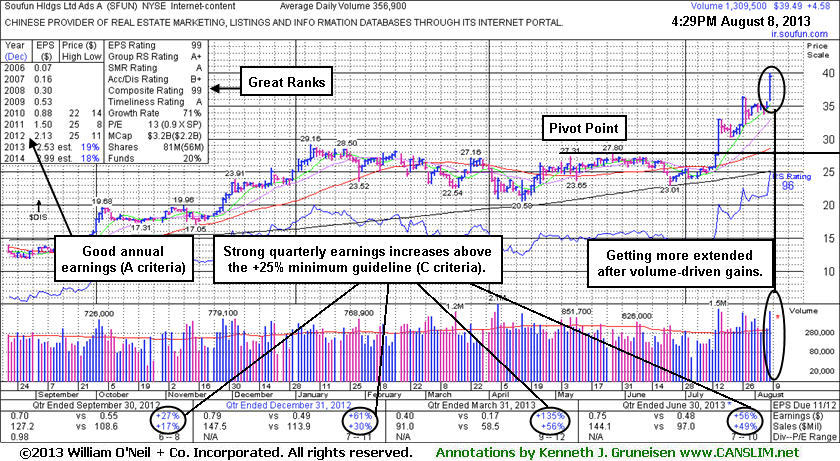
SFUN
-
NYSE
Soufun Hldgs Ltd Ads A
INTERNET - Internet Information Providers
|
$39.49
|
+4.58
13.12% |
$39.98
|
1,311,459
367.46% of 50 DAV
50 DAV is 356,900
|
$36.43
8.40%
|
7/16/2013
|
$29.54
|
PP = $27.90
|
|
MB = $29.30
|
Most Recent Note - 8/8/2013 5:17:28 PM
G - Very extended from its latest base after another considerable volume-driven gain. See the latest FSU analysis for more details and a new annotated daily graph.
>>> The latest Featured Stock Update with an annotated graph appeared on 8/8/2013. Click here.
View all notes |
Alert me of new notes |
CANSLIM.net Company Profile |
SEC |
Zacks Reports |
StockTalk |
News |
Chart |
Request a new note
C
A N
S L
I M
|
SSNC
-
NASDAQ
S S & C Technologies
COMPUTER SOFTWARE and SERVICES - Application Software
|
$35.14
|
-0.13
-0.37% |
$35.84
|
350,605
84.48% of 50 DAV
50 DAV is 415,000
|
$38.80
-9.43%
|
7/11/2013
|
$35.80
|
PP = $34.54
|
|
MB = $36.27
|
Most Recent Note - 8/7/2013 1:36:10 PM
Y - Rebounded from earlier lows as it found prompt support after undercutting its 50 DMA line with today's loss on above average volume. Prior highs in the $34 area also help define important near-term support. Disciplined investors always limit losses if ever any stock falls more than -7% from their purchase price.
>>> The latest Featured Stock Update with an annotated graph appeared on 7/12/2013. Click here.
View all notes |
Alert me of new notes |
CANSLIM.net Company Profile |
SEC |
Zacks Reports |
StockTalk |
News |
Chart |
Request a new note
C
A N
S L
I M
|
SSYS
-
NASDAQ
Stratasys Ltd
COMPUTER HARDWARE - Computer Peripherals
|
$98.26
|
+12.10
14.04% |
$99.50
|
3,447,126
465.76% of 50 DAV
50 DAV is 740,100
|
$96.44
1.89%
|
7/8/2013
|
$91.44
|
PP = $95.00
|
|
MB = $99.75
|
Most Recent Note - 8/8/2013 1:03:09 PM
Y - Earnings history through Jun '13 has remained strong. Touched a new 52-week high with heavy volume behind today's considerable gain. Found prompt support after briefly undercutting its 50 DMA line and prior low on the prior session. The stock's Relative Strength Rating has slumped to 65, well below the 80+ minimum guideline for buy candidates under the fact-based investment system.
>>> The latest Featured Stock Update with an annotated graph appeared on 7/24/2013. Click here.
View all notes |
Alert me of new notes |
CANSLIM.net Company Profile |
SEC |
Zacks Reports |
StockTalk |
News |
Chart |
Request a new note
C
A N
S L
I M
|
Symbol/Exchange
Company Name
Industry Group |
PRICE |
CHANGE
(%Change) |
Day High |
Volume
(% DAV)
(% 50 day avg vol) |
52 Wk Hi
% From Hi |
Featured
Date |
Price
Featured |
Pivot Featured |
|
Max Buy |
STMP
-
NASDAQ
Stamps.Com Inc
INTERNET - Internet Software and Services
|
$39.85
|
+0.20
0.50% |
$40.00
|
137,303
95.75% of 50 DAV
50 DAV is 143,400
|
$46.47
-14.25%
|
7/31/2013
|
$40.00
|
PP = $42.98
|
|
MB = $45.13
|
Most Recent Note - 8/6/2013 4:24:51 PM
Y - Encountered more distributional pressure with today's 3rd consecutive loss on higher above average volume while slumping toward its 50 DMA line. Disciplined investors limit losses if any stock falls more than -7% from their purchase price.
>>> The latest Featured Stock Update with an annotated graph appeared on 7/31/2013. Click here.
View all notes |
Alert me of new notes |
CANSLIM.net Company Profile |
SEC |
Zacks Reports |
StockTalk |
News |
Chart |
Request a new note
C
A N
S L
I M
|
VRX
-
NYSE
Valeant Pharmaceuticals
DRUGS - Drug Manufacturers - Other
|
$101.68
|
+4.09
4.19% |
$102.54
|
2,147,139
129.81% of 50 DAV
50 DAV is 1,654,100
|
$97.02
4.80%
|
4/30/2013
|
$60.24
|
PP = $76.66
|
|
MB = $80.49
|
Most Recent Note - 8/6/2013 4:30:21 PM
Y- Hovering near its 52-week high after wedging higher with recent gains lacking great volume conviction while rising from a 9-week cup-with-handle base. Due to report Q2 results before the open on August 7, 2013, and volume and volatility often increase near earnings news. No new pivot point has been cited while members were repeatedly cautioned - "Concerns were raised by its Mar '13 earnings report with only a +14% earnings increase, below the +25% minimum guideline (C criteria) for buy candidates."
>>> The latest Featured Stock Update with an annotated graph appeared on 7/23/2013. Click here.
View all notes |
Alert me of new notes |
CANSLIM.net Company Profile |
SEC |
Zacks Reports |
StockTalk |
News |
Chart |
Request a new note
C
A N
S L
I M
|
YNDX
-
NASDAQ
Yandex N V Class A
INTERNET - Internet Information Providers
|
$33.00
|
+0.24
0.73% |
$33.24
|
1,332,957
53.35% of 50 DAV
50 DAV is 2,498,600
|
$34.27
-3.71%
|
7/10/2013
|
$29.29
|
PP = $29.59
|
|
MB = $31.07
|
Most Recent Note - 8/6/2013 4:31:29 PM
G - Holding its ground stubbornly near its 52-week high with small losses on light volume following volume-driven gains into new high territory. Prior highs in the $28-29 area define near-term support to watch.
>>> The latest Featured Stock Update with an annotated graph appeared on 7/26/2013. Click here.
View all notes |
Alert me of new notes |
CANSLIM.net Company Profile |
SEC |
Zacks Reports |
StockTalk |
News |
Chart |
Request a new note
C
A N
S L
I M
|