You are not logged in.
This means you
CAN ONLY VIEW reports that were published prior to Monday, April 14, 2025.
You
MUST UPGRADE YOUR MEMBERSHIP if you want to see any current reports.
AFTER MARKET UPDATE - THURSDAY, AUGUST 9TH, 2012
Previous After Market Report Next After Market Report >>>
|
|
|
|
DOW |
-10.45 |
13,165.19 |
-0.08% |
|
Volume |
575,750,020 |
-10% |
|
Volume |
1,633,605,510 |
-10% |
|
NASDAQ |
+7.39 |
3,018.64 |
+0.25% |
|
Advancers |
1,649 |
53% |
|
Advancers |
1,368 |
53% |
|
S&P 500 |
+0.58 |
1,402.80 |
+0.04% |
|
Decliners |
1,354 |
43% |
|
Decliners |
1,097 |
42% |
|
Russell 2000 |
+2.74 |
802.90 |
+0.34% |
|
52 Wk Highs |
146 |
|
|
52 Wk Highs |
58 |
|
|
S&P 600 |
+0.82 |
452.14 |
+0.18% |
|
52 Wk Lows |
8 |
|
|
52 Wk Lows |
33 |
|
|
 |
Another Mixed Finish on Quieter Volume Totals
Kenneth J. Gruneisen - Passed the CAN SLIM® Master's Exam
The major averages ended mixed again on Thursday after stocks wavered in a narrow range throughout the session. The volume totals were lighter on the NYSE and on the Nasdaq exchange versus the prior session totals. Advancing issues narrowly led decliners by an 8-7 margin on the NYSE and by about a 7-5 margin on the Nasdaq exchange. The total number of new 52-week highs led new 52-week lows on the NYSE on the Nasdaq exchange, and the new lows total on the NYSE sank into the single digits again. There were 34 high-ranked companies from the CANSLIM.net Leaders List made new 52-week highs and appeared on the CANSLIM.net BreakOuts Page, down from the prior session total of 39 stocks. There were gains for 10 of the 20 high-ranked companies currently included on the Featured Stocks Page.
Trading lacked conviction as investors digested weak economic news out of China amid better-than-expected trade and unemployment data on our shores. Five of the 10 sectors on the S&P finished higher, led by gains in energy and material stocks. On the earnings front, shares of Kohl's Corp (KSS -1.23%) fell after the company reported a positive earnings result, but came up short of expectations in their same-store sales. On the M&A front, Robbins & Myers Inc (RBN +27.41%) rallied after National Oilwell Varco Inc (NOV +0.84%) announced they were acquiring the company for $60 per share.
Turning to fixed income, Treasuries were lower on the curve. The Benchmark 10-year notes was down nearly a point and a half to yield 1.70% and the 30-year bond was off 1/16 of a point to yield 2.76%.
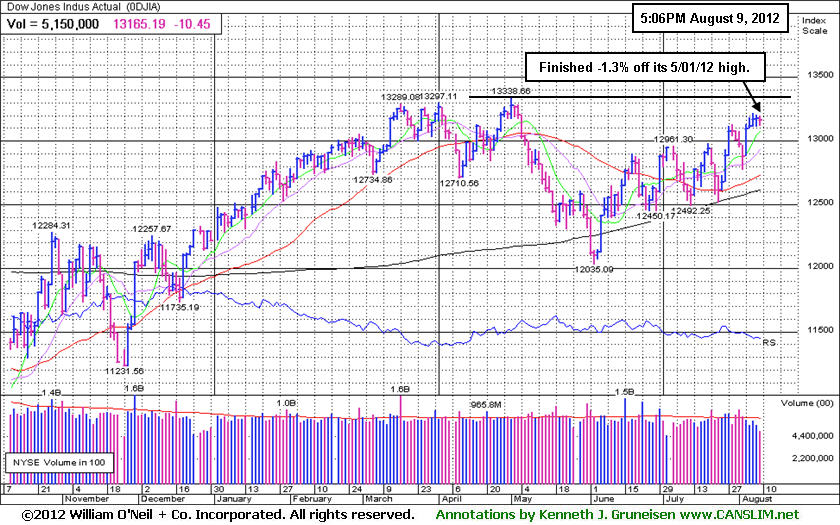
The S&P 500 Index finished only -1.4% off its April 2, 2012 high and the Nasdaq Composite Index ended -3.7% off its March 27, 2012 high. In terms of the M criteria, the major indices recently have been in a confirmed rally coupled with an expansion in leadership (stocks hitting new 52-week highs).
Watch for an announcement soon via email concerning new monthly webcasts starting in August and a new "Market's Leading Groups" archives tab to be added on the Premium Member Homepage. These changes are aimed at satisfying member requests and improving the service. If you have questions, comments or suggestions please let us know via the inquiry form here. The most recent WEBCAST (Q2 2012) is available "ON DEMAND" - CLICK HERE.
PICTURED: The Dow Jones Industrial Average ended -1.3% off its 5/01/12 high.
|
 Kenneth J. Gruneisen started out as a licensed stockbroker in August 1987, a couple of months prior to the historic stock market crash that took the Dow Jones Industrial Average down -22.6% in a single day. He has published daily fact-based fundamental and technical analysis on high-ranked stocks online for two decades. Through FACTBASEDINVESTING.COM, Kenneth provides educational articles, news, market commentary, and other information regarding proven investment systems that work in good times and bad.
Comments contained in the body of this report are technical opinions only and are not necessarily those of Gruneisen Growth Corp. The material herein has been obtained from sources believed to be reliable and accurate, however, its accuracy and completeness cannot be guaranteed. Our firm, employees, and customers may effect transactions, including transactions contrary to any recommendation herein, or have positions in the securities mentioned herein or options with respect thereto. Any recommendation contained in this report may not be suitable for all investors and it is not to be deemed an offer or solicitation on our part with respect to the purchase or sale of any securities. |
|
 |
Networking, Broker/Dealer, and Commodity-Linked Indexes Led Gains
Kenneth J. Gruneisen - Passed the CAN SLIM® Master's Exam
The Networking Index ($NWX +1.72%) led the tech sector higher while there were modest gains from the Semiconductor Index ($SOX +0.71%) and the Internet Index ($IIX +0.48%), and the Biotechnology Index ($BTK +0.11%) lagged. Commodity-linked stocks had a positive bias as the Gold & Silver Index ($XAU +1.25%) and Oil Services Index ($OSX +1.16%) posted gains, but the Integrated Oil Index ($XOI -0.03%) finished flat. The Broker/Dealer Index ($XBD +1.41%) tallied a solid gain while the Bank Index ($BKX +0.11%) barely inched higher. The Healthcare Index ($HMO -0.14%) and Retail Index ($RLX -0.12%) edged lower.
Charts courtesy www.stockcharts.com
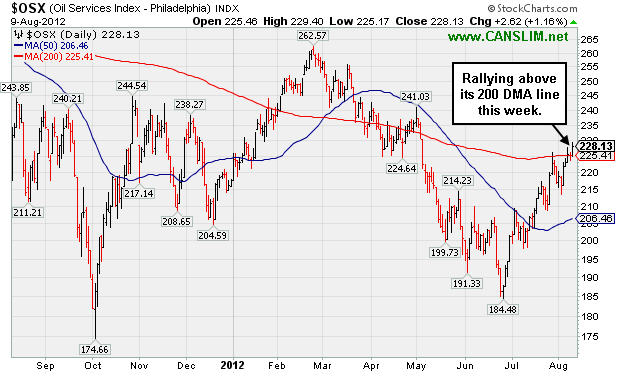
PICTURED: The Oil Services Index ($OSX +1.16%) has rallied back above its 200-day moving average (DMA) line with this week's gains.
| Oil Services |
$OSX |
228.13 |
+2.62 |
+1.16% |
+5.48% |
| Healthcare |
$HMO |
2,301.04 |
-3.16 |
-0.14% |
+0.85% |
| Integrated Oil |
$XOI |
1,239.24 |
-0.41 |
-0.03% |
+0.82% |
| Semiconductor |
$SOX |
403.98 |
+2.83 |
+0.71% |
+10.85% |
| Networking |
$NWX |
212.19 |
+3.58 |
+1.72% |
-1.38% |
| Internet |
$IIX |
312.43 |
+1.48 |
+0.48% |
+10.89% |
| Broker/Dealer |
$XBD |
80.76 |
+1.12 |
+1.41% |
-3.02% |
| Retail |
$RLX |
626.24 |
-0.74 |
-0.12% |
+19.69% |
| Gold & Silver |
$XAU |
157.44 |
+1.94 |
+1.25% |
-12.84% |
| Bank |
$BKX |
46.58 |
+0.05 |
+0.11% |
+18.28% |
| Biotech |
$BTK |
1,435.59 |
+1.63 |
+0.11% |
+31.53% |
|
|
|
 |
Breakout Gain Backed With Nearly 6 Times Average Volume
Kenneth J. Gruneisen - Passed the CAN SLIM® Master's Exam
Often, when a leading stock is setting up to breakout of a solid base it is highlighted in CANSLIM.net's Mid-Day Breakouts Report. The most relevant factors are noted in the report which alerts prudent CANSLIM oriented investors to place the issue in their watch list. After doing any necessary backup research, the investor is prepared to act after the stock triggers a technical buy signal (breaks above its pivot point on more than +50% average turnover) but before it gets too extended from a sound base. In the event the stock fails to trigger a technical buy signal and its price declines then it will simply be removed from the watch list. Disciplined investors know to buy as near as possible to the pivot point and avoid chasing stocks after they have rallied more than +5% above their pivot point. It is crucial to always limit losses whenever any stock heads the wrong direction, and disciplined investors sell if a struggling stock ever falls more than -7% from their purchase price.
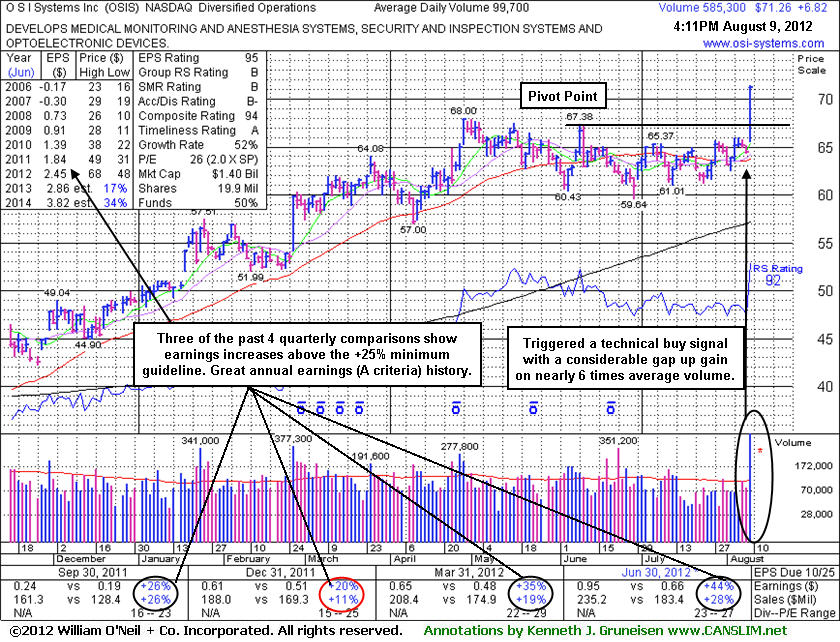
O S I Systems Inc (OSIS +$6.82 or +10.58% to $71.26) finished strong after it was highlighted in yellow with pivot point cited based on its 6/08/12 high plus 10 cents in the earlier mid-day report (read here). It reported earnings +44% on +28% sales revenues for the quarter ended June 30, 2012 versus the year ago period. Its considerable gain was backed by nearly 6 times average volume as it triggered a technical buy signal.
Its last appearance in this FSU section was on 1/31/12 with an annotated daily graph under the headline, "Earnings in Latest Quarter Reported Below System Guidelines." OSIS found support well above its 200-day moving average (DMA) line while consolidating after it was later dropped from the Featured Stocks list on 2/22/12. It had reported earnings +20% on +11% sales revenues for the quarter ended December 31, 2011 versus the year ago period. Those results, below the +25% minimum earnings guideline (C criteria) of the investment system, marked its weakest earnings comparison in 2 years. However, it has followed with sequentially stronger sales revenues increases and earnings increases in the latest quarters, and such acceleration in its growth rate is a very encouraging sign.
Annual earnings (A criteria) growth has been strong. Ownership by top-rated funds rose from 281 in Sep '11 to 307 in the Jun '12 quarter, a reassuring sign concerning the I criteria. As always, limit losses if any stock ever falls more than -7% from the purchase price. On pullbacks, its prior highs in the $67 area define initial support above its 50 DMA line.
|
|
|
Color Codes Explained :
Y - Better candidates highlighted by our
staff of experts.
G - Previously featured
in past reports as yellow but may no longer be buyable under the
guidelines.
***Last / Change / Volume data in this table is the closing quote data***
Symbol/Exchange
Company Name
Industry Group |
PRICE |
CHANGE
(%Change) |
Day High |
Volume
(% DAV)
(% 50 day avg vol) |
52 Wk Hi
% From Hi |
Featured
Date |
Price
Featured |
Pivot Featured |
|
Max Buy |
ALXN
-
NASDAQ
Alexion Pharmaceuticals
DRUGS - Drug Manufacturers - Other
|
$103.63
|
-1.09
-1.04% |
$105.46
|
730,094
43.85% of 50 DAV
50 DAV is 1,664,800
|
$109.96
-5.76%
|
5/1/2012
|
$91.73
|
PP = $95.11
|
|
MB = $99.87
|
Most Recent Note - 8/8/2012 4:05:52 PM
G - Holding its ground with volume totals cooling since last noted on 8/03/12 when it gapped up for a gain with above average volume. Chart support is defined by its 50 DMA line (now $98.11).
>>> The latest Featured Stock Update with an annotated graph appeared on 7/25/2012. Click here.
View all notes |
Alert me of new notes |
CANSLIM.net Company Profile |
SEC |
Zacks Reports |
StockTalk |
News |
Chart |
Request a new note
C
A N
S L
I M


|
ASPS
-
NASDAQ
Altisource Ptf Sltns Sa
REAL ESTATE - Property Management/Developmen
|
$83.61
|
-0.69
-0.82% |
$84.74
|
153,036
112.11% of 50 DAV
50 DAV is 136,500
|
$84.43
-0.97%
|
6/5/2012
|
$60.01
|
PP = $63.00
|
|
MB = $66.15
|
Most Recent Note - 8/8/2012 4:06:45 PM
G - Tallied a 9th consecutive gain today and hit another new high, getting more extended from its prior base. Recent low and its 50 DMA line define near-term support to watch.
>>> The latest Featured Stock Update with an annotated graph appeared on 8/3/2012. Click here.
View all notes |
Alert me of new notes |
CANSLIM.net Company Profile |
SEC |
Zacks Reports |
StockTalk |
News |
Chart |
Request a new note
C
A N
S L
I M
|
CFNL
-
NASDAQ
Cardinal Financial Corp
BANKING - Regional - Southeast Banks
|
$12.52
|
-0.12
-0.95% |
$12.66
|
36,878
47.71% of 50 DAV
50 DAV is 77,300
|
$13.21
-5.22%
|
7/20/2012
|
$12.85
|
PP = $12.41
|
|
MB = $13.03
|
Most Recent Note - 8/7/2012 4:24:18 PM
Y - Rebounded further above its pivot point with today's gain on +20% above average volume. Its 50 DMA line and prior chart highs define important near-term support to watch.
>>> The latest Featured Stock Update with an annotated graph appeared on 7/26/2012. Click here.
View all notes |
Alert me of new notes |
CANSLIM.net Company Profile |
SEC |
Zacks Reports |
StockTalk |
News |
Chart |
Request a new note
C
A N
S L
I M
|
CMCSA
-
NASDAQ
Comcast Corp Cl A
MEDIA - CATV Systems
|
$34.55
|
+0.04
0.12% |
$34.73
|
11,600,826
80.12% of 50 DAV
50 DAV is 14,480,200
|
$35.16
-1.73%
|
6/11/2012
|
$29.94
|
PP = $30.98
|
|
MB = $32.53
|
Most Recent Note - 8/7/2012 11:03:32 AM
G - Hit another new 52-week high today, getting more extended from its prior base with a streak of recent gains backed by above average volume. Gapped up on 8/01/12 after reporting earnings +19% on +6% sales revenues for the Jun '12 quarter, below the fact-based investment system's +25% minimum guideline for the C criteria, but better than Street expectations.
>>> The latest Featured Stock Update with an annotated graph appeared on 7/11/2012. Click here.
View all notes |
Alert me of new notes |
CANSLIM.net Company Profile |
SEC |
Zacks Reports |
StockTalk |
News |
Chart |
Request a new note
C
A N
S L
I M
|
DG
-
NYSE
Dollar General Corp
RETAIL - Discount, Variety Stores
|
$51.35
|
-0.75
-1.44% |
$52.46
|
1,426,234
35.65% of 50 DAV
50 DAV is 4,001,000
|
$56.04
-8.37%
|
7/16/2012
|
$54.68
|
PP = $56.14
|
|
MB = $58.95
|
Most Recent Note - 8/7/2012 11:00:14 AM
G - Consolidating near its 50 DMA line with volume totals cooling in recent weeks after encountering distributional pressure.
>>> The latest Featured Stock Update with an annotated graph appeared on 7/12/2012. Click here.
View all notes |
Alert me of new notes |
CANSLIM.net Company Profile |
SEC |
Zacks Reports |
StockTalk |
News |
Chart |
Request a new note
C
A N
S L
I M
|
Symbol/Exchange
Company Name
Industry Group |
PRICE |
CHANGE
(%Change) |
Day High |
Volume
(% DAV)
(% 50 day avg vol) |
52 Wk Hi
% From Hi |
Featured
Date |
Price
Featured |
Pivot Featured |
|
Max Buy |
ECPG
-
NASDAQ
Encore Capital Group Inc
FINANCIAL SERVICES - Credit Services
|
$28.50
|
+0.00
0.00% |
$28.60
|
113,796
71.71% of 50 DAV
50 DAV is 158,700
|
$30.47
-6.47%
|
8/3/2012
|
$29.91
|
PP = $30.45
|
|
MB = $31.97
|
Most Recent Note - 8/8/2012 12:04:47 PM
Y - Gapped down today, retreating to its 50 DMA line with a large loss on above average volume. A volume-driven gain and close above its pivot point may trigger a technical buy signal, meanwhile, subsequent deterioration below its 50 DMA line and recent lows would raise more serious concerns. See the latest FSU analysis for more details and a new annotated graph.
>>> The latest Featured Stock Update with an annotated graph appeared on 8/6/2012. Click here.
View all notes |
Alert me of new notes |
CANSLIM.net Company Profile |
SEC |
Zacks Reports |
StockTalk |
News |
Chart |
Request a new note
C
A N
S L
I M
|
EXPE
-
NASDAQ
Expedia Inc
INTERNET - Internet Information Providers
|
$55.96
|
-0.18
-0.32% |
$56.78
|
2,088,531
52.40% of 50 DAV
50 DAV is 3,985,900
|
$59.50
-5.95%
|
4/27/2012
|
$41.80
|
PP = $35.57
|
|
MB = $37.35
|
Most Recent Note - 8/8/2012 12:05:09 PM
G - Gapped down today amid weakness in travel-related stocks after Priceline.com Inc (PCLN) and Orbitz Worldwide Inc (OWW) reported disappointing results. EXPE recently reported earnings +24% on +14% sales revenues for the quarter ending June 30, 2012 versus the year ago period, just below the +25% minimum earnings guideline for buy candidates.
>>> The latest Featured Stock Update with an annotated graph appeared on 7/10/2012. Click here.
View all notes |
Alert me of new notes |
CANSLIM.net Company Profile |
SEC |
Zacks Reports |
StockTalk |
News |
Chart |
Request a new note
C
A N
S L
I M
|
GNC
-
NYSE
G N C Holdings Inc
RETAIL - Drug Stores
|
$39.18
|
+0.07
0.18% |
$39.40
|
1,308,450
52.37% of 50 DAV
50 DAV is 2,498,600
|
$42.70
-8.24%
|
6/29/2012
|
$39.20
|
PP = $40.00
|
|
MB = $42.00
|
Most Recent Note - 8/6/2012 5:33:33 PM
Y - Quietly consolidating just above its 50 DMA line today. Reported earnings +59% on +19% sales revenues for the quarter ended June 30, 2012 versus the year ago period, beating expectations, and it also raised guidance for FY '12.
>>> The latest Featured Stock Update with an annotated graph appeared on 8/8/2012. Click here.
View all notes |
Alert me of new notes |
CANSLIM.net Company Profile |
SEC |
Zacks Reports |
StockTalk |
News |
Chart |
Request a new note
C
A N
S L
I M
|
GPX
-
NYSE
G P Strategies Corp
DIVERSIFIED SERVICES - Education and Training Services
|
$18.75
|
-0.34
-1.78% |
$19.09
|
48,412
74.94% of 50 DAV
50 DAV is 64,600
|
$20.08
-6.62%
|
6/29/2012
|
$18.01
|
PP = $18.15
|
|
MB = $19.06
|
Most Recent Note - 8/7/2012 6:01:07 PM
G - Perched at its 52-week high after 4 consecutive volume-driven gains. See the latest FSU analysis for more details and a new annotated graph.
>>> The latest Featured Stock Update with an annotated graph appeared on 8/7/2012. Click here.
View all notes |
Alert me of new notes |
CANSLIM.net Company Profile |
SEC |
Zacks Reports |
StockTalk |
News |
Chart |
Request a new note
C
A N
S L
I M
|
HMSY
-
NASDAQ
H M S Holdings Corp
COMPUTER SOFTWARE and SERVICES - Healthcare Information Service
|
$35.63
|
-0.14
-0.39% |
$36.35
|
605,137
66.13% of 50 DAV
50 DAV is 915,100
|
$36.12
-1.36%
|
7/27/2012
|
$33.91
|
PP = $34.83
|
|
MB = $36.57
|
Most Recent Note - 8/8/2012 4:09:28 PM
Y - Touched a new 52-week high today with below average volume behind its 5th consecutive gain. Gains above a stock's pivot point must have at least +40% above average volume, preferably greater, to trigger a proper technical buy signal.
>>> The latest Featured Stock Update with an annotated graph appeared on 7/27/2012. Click here.
View all notes |
Alert me of new notes |
CANSLIM.net Company Profile |
SEC |
Zacks Reports |
StockTalk |
News |
Chart |
Request a new note
C
A N
S L
I M
|
Symbol/Exchange
Company Name
Industry Group |
PRICE |
CHANGE
(%Change) |
Day High |
Volume
(% DAV)
(% 50 day avg vol) |
52 Wk Hi
% From Hi |
Featured
Date |
Price
Featured |
Pivot Featured |
|
Max Buy |
LKQ
-
NASDAQ
L K Q Corp
WHOLESALE - Auto Parts
|
$37.73
|
+0.32
0.86% |
$38.31
|
1,138,212
154.94% of 50 DAV
50 DAV is 734,600
|
$37.48
0.67%
|
8/9/2012
|
$37.93
|
PP = $37.44
|
|
MB = $39.31
|
 Most Recent Note - 8/9/2012 12:39:29 PM
Y - Color code is changed to yellow with pivot point based on its 6/19/12 high plus 10 cents. Hitting a new 52-week high today with its 5th consecutive small gain. A gain with at least +40% above average volume while rising above its pivot point may trigger a technical buy signal. Reported earnings +28% on +32% sales revenues for the Jun '12 quarter. Three of the past 4 quarters showed earnings increases above the +25% minimum guideline (C criteria). Maintained a strong annual earnings (A criteria) growth history. Changed its ticker symbol (from LKQX) and found support above its 200 DMA line in recent months. It survived but failed to impress since dropped from the Featured Stocks list on 4/09/08.
There are no Featured Stock Updates™ available for this stock at this time. You may request one by clicking the Request a New Note link below
View all notes |
Alert me of new notes |
CANSLIM.net Company Profile |
SEC |
Zacks Reports |
StockTalk |
News |
Chart |
Request a new note
C
A N
S L
I M
|
MIDD
-
NASDAQ
Middleby Corp
MANUFACTURING - Diversified Machinery
|
$113.77
|
+13.56
13.53% |
$119.74
|
926,946
1,140.15% of 50 DAV
50 DAV is 81,300
|
$104.82
8.54%
|
8/9/2012
|
$118.60
|
PP = $104.92
|
|
MB = $110.17
|
Most Recent Note - 8/9/2012 1:05:36 PM
Y - Color code is changed to yellow with pivot point cited based on its 5/22/12 high plus 10 cents. Reported earnings +58% on +23% sales revenues for the Jun '12 quarter. Gapped up today for a new 52-week and all-time high, breaking out from a long flat base. A "breakaway gap" is one noted exception when buying more than +5% above prior highs is permitted under the fact-based system, however risk increases the further one chases a stock above its pivot point. Recent quarterly comparisons show strong sales and earnings reasonably meeting the C criteria. Its annual earnings (A criteria) had a downturn in FY '09, yet they have otherwise been good and steady.

>>> The latest Featured Stock Update with an annotated graph appeared on 1/19/2006. Click here.
View all notes |
Alert me of new notes |
CANSLIM.net Company Profile |
SEC |
Zacks Reports |
StockTalk |
News |
Chart |
Request a new note
C
A N
S L
I M
|
N
-
NYSE
Netsuite Inc
DIVERSIFIED SERVICES - Business/Management Services
|
$57.49
|
+0.24
0.42% |
$57.90
|
327,133
43.48% of 50 DAV
50 DAV is 752,400
|
$59.22
-2.92%
|
6/20/2012
|
$51.83
|
PP = $51.88
|
|
MB = $54.47
|
Most Recent Note - 8/8/2012 4:10:23 PM
G - Perched near its 52-week high, holding its ground with volume totals cooling. Found support near its 50 DMA line when encountering recent distributional pressure.
>>> The latest Featured Stock Update with an annotated graph appeared on 7/19/2012. Click here.
View all notes |
Alert me of new notes |
CANSLIM.net Company Profile |
SEC |
Zacks Reports |
StockTalk |
News |
Chart |
Request a new note
C
A N
S L
I M
|
NSM
-
NYSE
Nationstar Mtg Hldgs Inc
FINANCIAL SERVICES - Credit Services
|
$25.10
|
+0.13
0.52% |
$25.43
|
541,546
67.91% of 50 DAV
50 DAV is 797,400
|
$25.11
-0.04%
|
6/27/2012
|
$20.29
|
PP = $20.46
|
|
MB = $21.48
|
Most Recent Note - 8/8/2012 4:00:48 PM
G - Today's gain on light volume led to its best-ever close. It is not near a sound base. Recently found support above prior highs and its 50 DMA line in the $20 area.
>>> The latest Featured Stock Update with an annotated graph appeared on 8/1/2012. Click here.
View all notes |
Alert me of new notes |
CANSLIM.net Company Profile |
SEC |
Zacks Reports |
StockTalk |
News |
Chart |
Request a new note
C
A N
S L
I M
|
OSIS
-
NASDAQ
O S I Systems Inc
ELECTRONICS - Semiconductor Equipment and Mate
|
$71.26
|
+6.82
10.58% |
$71.44
|
585,846
587.61% of 50 DAV
50 DAV is 99,700
|
$68.00
4.79%
|
8/9/2012
|
$67.71
|
PP = $67.48
|
|
MB = $70.85
|
Most Recent Note - 8/9/2012 4:43:39 PM
Y - Finished strong after it was highlighted in yellow with pivot point cited based on its 6/08/12 high plus 10 cents in the mid-day report (read here). Reported earnings +44% on +28% sales revenues for the quarter ended June 30, 2012 versus the year ago period. Its considerable gain was backed by nearly 6 times average volume as it triggered a technical buy signal. See the latest FSU analysis for more details and a new annotated graph.
>>> The latest Featured Stock Update with an annotated graph appeared on 8/9/2012. Click here.
View all notes |
Alert me of new notes |
CANSLIM.net Company Profile |
SEC |
Zacks Reports |
StockTalk |
News |
Chart |
Request a new note
C
A N
S L
I M
|
Symbol/Exchange
Company Name
Industry Group |
PRICE |
CHANGE
(%Change) |
Day High |
Volume
(% DAV)
(% 50 day avg vol) |
52 Wk Hi
% From Hi |
Featured
Date |
Price
Featured |
Pivot Featured |
|
Max Buy |
RNF
-
NYSE
Rentech Nitrogen Ptnr Lp
CHEMICALS - Agricultural Chemicals
|
$32.44
|
-0.19
-0.58% |
$33.10
|
488,389
123.36% of 50 DAV
50 DAV is 395,900
|
$33.35
-2.73%
|
7/27/2012
|
$29.58
|
PP = $30.60
|
|
MB = $32.13
|
Most Recent Note - 8/8/2012 12:32:28 PM
G - Color code is changed to green after getting extended from its prior base. Triggered a technical buy signal yesterday with its considerable gain backed by +266% above average volume as it rallied above its pivot point into new high territory.
>>> The latest Featured Stock Update with an annotated graph appeared on 7/31/2012. Click here.
View all notes |
Alert me of new notes |
CANSLIM.net Company Profile |
SEC |
Zacks Reports |
StockTalk |
News |
Chart |
Request a new note
C
A N
S L
I M
|
SWI
-
NYSE
Solarwinds Inc
COMPUTER SOFTWARE and SERVICES - Application Software
|
$55.49
|
-0.39
-0.70% |
$56.18
|
576,343
45.55% of 50 DAV
50 DAV is 1,265,300
|
$56.80
-2.31%
|
7/25/2012
|
$47.82
|
PP = $47.89
|
|
MB = $50.28
|
Most Recent Note - 8/6/2012 5:30:45 PM
G - Hit a new all-time high today with a 3rd consecutive gain on light volume. Prior highs in the $48 area define initial support to watch on pullbacks.
>>> The latest Featured Stock Update with an annotated graph appeared on 7/30/2012. Click here.
View all notes |
Alert me of new notes |
CANSLIM.net Company Profile |
SEC |
Zacks Reports |
StockTalk |
News |
Chart |
Request a new note
C
A N
S L
I M
|
TDG
-
NYSE
Transdigm Group Inc
AEROSPACE/DEFENSE - Aerospace/Defense Products and; Services
|
$127.00
|
+1.87
1.49% |
$127.28
|
391,963
82.41% of 50 DAV
50 DAV is 475,600
|
$136.34
-6.85%
|
6/18/2012
|
$127.00
|
PP = $132.79
|
|
MB = $139.43
|
Most Recent Note - 8/7/2012 10:56:59 AM
G - Reported earnings +55% on +42% sales revenues for the quarter ended June 30, 2012 versus the year ago period. Gapped up today and traded above its 50 DMA line. Recent lows in the $117-118 are define near-term support above its 200 DMA line.
>>> The latest Featured Stock Update with an annotated graph appeared on 7/18/2012. Click here.
View all notes |
Alert me of new notes |
CANSLIM.net Company Profile |
SEC |
Zacks Reports |
StockTalk |
News |
Chart |
Request a new note
C
A N
S L
I M
|
TNGO
-
NASDAQ
Tangoe Inc
COMPUTER SOFTWARE and SERVICES - Technical and System Software
|
$21.40
|
+1.40
7.00% |
$22.07
|
1,286,217
273.49% of 50 DAV
50 DAV is 470,300
|
$23.05
-7.16%
|
8/9/2012
|
$21.30
|
PP = $23.10
|
|
MB = $24.26
|
Most Recent Note - 8/9/2012 1:37:21 PM
Y - Gapped up above its 50 DMA line today, improving its technical stance with a volume-driven gain. Reported earnings +67% on +39% sales revenues for the Jun '12 quarter. Color code is changed to yellow again as it returns to the Featured Stocks list with a new pivot point cited based on its 6/26/12 high plus 10 cents. It still faces resistance up to the $23 level which has been a stubborn resistance area in recent months. Volume-driven gains above its pivot point are needed to trigger a proper technical buy signal.
>>> The latest Featured Stock Update with an annotated graph appeared on 7/24/2012. Click here.
View all notes |
Alert me of new notes |
CANSLIM.net Company Profile |
SEC |
Zacks Reports |
StockTalk |
News |
Chart |
Request a new note
C
A N
S L
I M
|
VSI
-
NYSE
Vitamin Shoppe Inc
SPECIALTY RETAIL - Specialty Retail, Other
|
$59.85
|
+0.05
0.08% |
$60.31
|
423,665
114.32% of 50 DAV
50 DAV is 370,600
|
$61.83
-3.19%
|
6/29/2012
|
$54.93
|
PP = $55.03
|
|
MB = $57.78
|
Most Recent Note - 8/7/2012 12:41:45 PM
G - Reported earnings +38% on +13% sales revenues for the quarter ended June 30, 2012 versus the year ago period. Color code was changed to green while hitting new all-time highs above its "max buy" level. Its 50 DMA line and upward trendline define near-term chart support to watch.
>>> The latest Featured Stock Update with an annotated graph appeared on 8/2/2012. Click here.
View all notes |
Alert me of new notes |
CANSLIM.net Company Profile |
SEC |
Zacks Reports |
StockTalk |
News |
Chart |
Request a new note
C
A N
S L
I M
|
Symbol/Exchange
Company Name
Industry Group |
PRICE |
CHANGE
(%Change) |
Day High |
Volume
(% DAV)
(% 50 day avg vol) |
52 Wk Hi
% From Hi |
Featured
Date |
Price
Featured |
Pivot Featured |
|
Max Buy |
|
|
|
THESE ARE NOT BUY RECOMMENDATIONS!
Comments contained in the body of this report are technical
opinions only. The material herein has been obtained
from sources believed to be reliable and accurate, however,
its accuracy and completeness cannot be guaranteed.
This site is not an investment advisor, hence it does
not endorse or recommend any securities or other investments.
Any recommendation contained in this report may not
be suitable for all investors and it is not to be deemed
an offer or solicitation on our part with respect to
the purchase or sale of any securities. All trademarks,
service marks and trade names appearing in this report
are the property of their respective owners, and are
likewise used for identification purposes only.
This report is a service available
only to active Paid Premium Members.
You may opt-out of receiving report notifications
at any time. Questions or comments may be submitted
by writing to Premium Membership Services 665 S.E. 10 Street, Suite 201 Deerfield Beach, FL 33441-5634 or by calling 1-800-965-8307
or 954-785-1121.
|
|
|

